This "Dividend King" Stock Just Sweetened The Pot For Investors By Upping Its Dividend To Over 7%
Benzinga and Yahoo Finance LLC may earn commission or revenue on some items through the links below.
Investors looking for dividends know that not all dividend stocks are created equally. The size of the dividend is as important as the reliability of the payout, which is why dividend investors value consistency as much as the payout itself. With that in mind, investors may want to pay attention to this “Dividend King” stock that just raised its payout by a solid 4%.
Altria (NASDAQ:MO) is one of America’s most well-known tobacco companies. It produces and markets a full range of tobacco products, including traditional cigarettes, chewing tobacco, cigars, and e-cigarettes. More importantly, Altria sells these products through legacy brands like Skoal, Marlboro, and Copenhagen, which have customer bases stretching back several generations.
Trending Now:
Although traditional smoking tobacco remains Altria’s most marketable product and comprises most of its profits, the company is diversified. Altria’s asset portfolio includes a 10% share of Anheuser-Busch InBev, 35% of JUUL e-cigarettes, and 45% of the Cronos Group cannabis company.
This diversification across tobacco products and the growing cannabis industry has put Altria in a strong position to pay consistent dividends to its investors and raise them regularly. Altria has increased its shareholder dividend for 54 consecutive years, making it one of very few stocks to earn the title “Dividend King.”
The title “Dividend King” is reserved for stocks that have increased dividends for the last 50 years. Earning that title speaks to the stock’s longevity and the quality of its management. These stocks attract both institutional and independent investors for long-term holds. Recently, Altria further sweetened the pot for its investors with a significant dividend increase.
Read More:
Altria announced it would increase its quarterly dividend by 4.1% per share. The announcement raises Altria’s dividend yield to 7.9% on the company’s Aug. 21 stock price of $51.81, equating to a quarterly dividend of $1.02/share. The increase marks Altria’s 59th in the last 55 years, and the company’s goal is to continue paying dividends in the “mid-single digits” through 2028.
While it’s impossible to guarantee future performance, Altria’s track record is impressive. They provide products with strong global appeal, and many of Altria’s family brands, like Marlboro and Copenhagen, are instantly recognizable. Despite that, Altria stock is not without risks.
As global tobacco consumption decreases, companies like Altria face shrinking customer bases, with governments ramping up regulatory efforts and taxation on tobacco products. Many states have implemented heavy taxes on tobacco to discourage youth use, potentially impacting future profits and threatening Altria’s Dividend King status.
However, Altria has survived these regulatory challenges and multimillion-dollar tobacco settlements without losing its Dividend King status. The company is highly diversified, and if cannabis becomes legal, Altria is well-positioned to capitalize on that market. For these reasons, investors looking for a solid dividend stock may want to consider adding Altria to their portfolios.
A 9% Return In Just 3 Months
EquityMultiple’s ‘Alpine Note — Basecamp Series’ is turning heads and opening wallets. This short-term note investment offers investors a 9% rate of return (APY) with just a 3 month term and $5K minimum. The Basecamp rate is at a significant spread to t-bills. This healthy rate of return won’t last long. With the Fed poised to cut interest rates in the near future, now could be the time to lock in a favorable rate of return with a flexible, relatively liquid investment option.
What’s more, Alpine Note — Basecamp can be rolled into another Alpine Note for compounding returns, or into another of EquityMultiple’s rigorously vetted real estate investments, which also carry a minimum investment of just $5K. Basecamp is exclusively open to new investors on the EquityMultiple platform.
Looking for fractional real estate investment opportunities? The Benzinga Real Estate Screener features the latest offerings.
This article This “Dividend King” Stock Just Sweetened The Pot For Investors By Upping Its Dividend To Over 7% originally appeared on Benzinga.com
Pharmaceutical Packaging Equipment Market Set to Expand at 6.2% CAGR and Hitting USD 10.8 Billion by 2034 | Analysis by Transparency Market Research
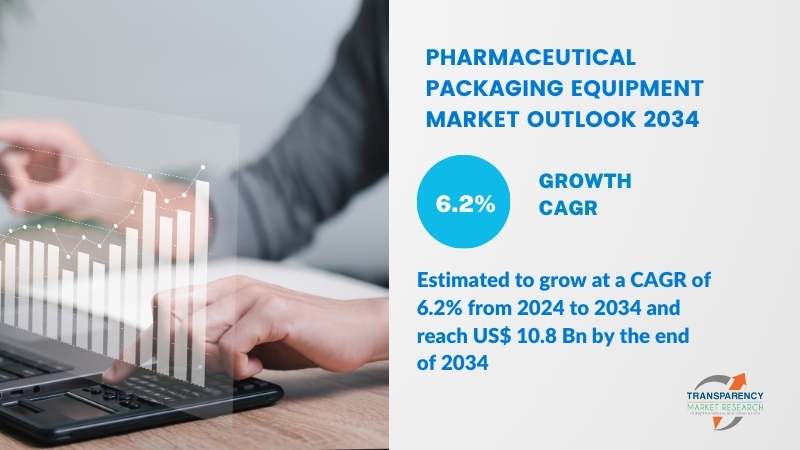
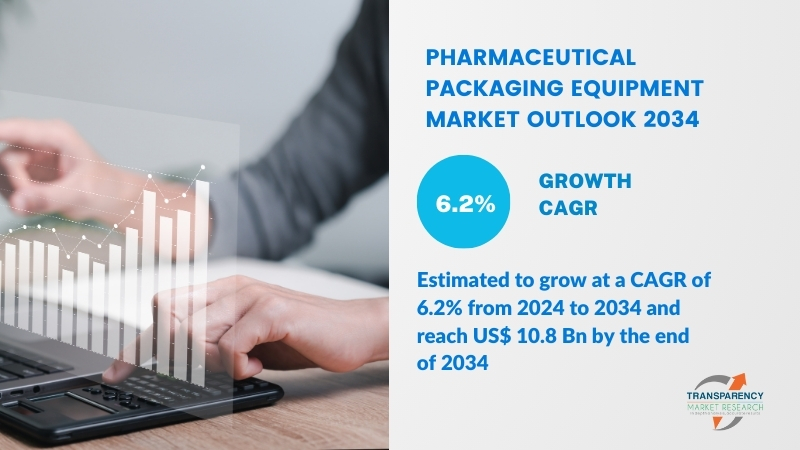
Wilmington, Delaware, United States, Transparency Market Research, Inc. , Sept. 10, 2024 (GLOBE NEWSWIRE) — The global pharmaceutical packaging equipment market (医薬品包装装置市場) was projected to attain US$ 5.6 billion in 2023. It is anticipated to garner a 6.2% CAGR from 2024 to 2034, and by 2034, the market is likely to attain US$ 10.8 billion.
The packaging used for pharmaceuticals aids in product identification. It also guards against deterioration, fracture, and leaking of a product’s contents. Various packaging materials such as glass, plastics, rubbers, paper/cardboard, and metals are used in pharmaceutical packaging.
Pharmaceutical packaging equipment is available in a variety of machine types, including strip packing machines, blister packing machines, cartoning machines, ampoule filling machines, liquid filling machines, syringe filling machines, automatic labeling/gumming/stickering machines, and pharmaceutical printing machines.
Download Sample PDF Brochure: https://www.transparencymarketresearch.com/pharmaceutical-packaging-equipment-market.html
Key Findings of Market Report
- Pharmaceutical filling machines serve a critical function in the pharmaceutical industry. Once medications have been developed, the next stage is packaging them. Products are shielded from physical harm by it.
- Additionally, pharmaceutical packaging increases the appeal and helps identify the product. It may enhance a patient’s adherence to medication.
- The pharmaceutical packaging equipment market is anticipated to rise in the near future due to research and development in packaging for improved outcomes.
- Pharmaceutical firms aim to lower expenses and increase productivity in their production and packaging processes. Due to the rising demand for packaging products, suppliers in the pharmaceutical packaging equipment sector are being forced to make investments in research and development and creative marketing techniques.
Market Trends for Pharmaceutical Packaging Equipment
- The need for safe packaging is growing as a result of an increase in counterfeiting. One of the biggest issues facing the pharmaceutical supply chain is pharmaceutical product counterfeiting.
- It endangers the lives of patients and results in billions of dollars in lost income. As of 2016, the value of all counterfeit pharmaceuticals trafficked globally was EUR 4.03 billion, according to the study “Trade in Counterfeit Pharmaceutical Products”.
- To combat counterfeit goods, governments everywhere are enacting strict laws pertaining to pharmaceutical packaging. The use of anti-counterfeiting technology is anticipated to present suppliers with profitable prospects in the pharmaceutical packaging equipment market.
Global Market for Pharmaceutical Packaging Equipment: Regional Outlook
- In 2023, North America held the greatest share. The region’s market dynamics are being driven by the existence of numerous and different drug-producing enterprises, as well as the implementation of strict regulations aimed at ensuring the greatest security of pharmaceutical packaging.
- The FDA (Food and Drug Administration) in the United States keeps an eye on manufacturers’ adherence to Current Good Manufacturing Practices (CGMP) in order to guarantee the quality of pharmaceutical goods.
Global Pharmaceutical Packaging Equipment Market: Competitive Landscape
Products that enable tamper-evident packaging are being offered by manufacturers of pharmaceutical packaging equipment. Products are protected from tampering before they are delivered to customers via tamper-evident packaging. The following companies are well-known participants in the global pharmaceutical packaging equipment market:
- Korber AG
- Mgt S.r.l.
- IMA S.P.A.
- Robert Bosch GmbH
- MULTIVAC Group
- Bausch+Ströbel SE + Co. KG
- OPTIMA
- Marchesini Group S.p.A.
- Uhlmann Group
- Tecnicam S.r.l.
- Romaco Group
Key developments by the players in this market are:
- Körber AG purchased the majority of Rondo-Pak LLC, a US-based printing and packaging firm, in February 2024. Körber is increasing the range of packaging solutions it offers to the biotech and pharmaceutical sectors.
- At the trade show Compamed 2023 in November 2023, MULTIVAC showcased a range of integrated solutions for the pharmaceutical industry. Among the goods was the R 3 thermoforming packaging machine, a brand-new type that offers a great price/performance ratio along with secure medical product packaging.
Purchase the Report for Market-Driven Insights: https://www.transparencymarketresearch.com/checkout.php?rep_id=6373<ype=S
Global Pharmaceutical Packaging Equipment Market Segmentation
By Product Type
- Solid Packaging Equipment
- Tablet Packaging Equipment
- Capsule Packaging Equipment
- Powder Packaging Equipment
- Semi-solid Packaging Equipment
- Ointment Packaging Equipment
- Cream Packaging Equipment
- Liquid Packaging Equipment
- Eye/Ear Drop Packaging Equipment
- Aerosol Packaging Equipment
- Syrup Packaging Equipment
By Package Type
- Primary Packaging Equipment
- Aseptic Filling and Sealing Equipment
- Bottle Filling and Capping Equipment
- Blister Packaging Equipment
- Soft Tube Filling and Sealing Equipment
- Sachet Packaging Equipment
- Others
- Secondary Packaging Equipment
- Cartoning Equipment
- Case Packaging Equipment
- Wrapping Equipment
- Others
By Region
- North America
- Latin America
- Europe
- Asia Pacific
- Middle East & Africa
Have a Look at More Valuable Insights of Factory Automation
- Sewage Pump Market: In 2021, the value of the global sewage pump market (下水ポンプ市場) was worth US$ 11.5 Bn. The global market is predicted to rise at a CAGR of 6.5% during the forecast period, from 2022 to 2031. The global market for sewage pump is anticipated to touch value of US$ 21.6 Bn by 2031.
- Solar Pumps Market: The global solar pumps market (ソーラーポンプ市場) stood at US$ 1.2 billion in 2021 and is projected to reach US$ 3.38 billion in 2031. The global solar pumps market is anticipated to expand at a CAGR of 11.1% between 2022 and 2031.
- Europe Medium Voltage Fuse Market – The global Europe medium voltage fuse market (中電圧ヒューズ市場) is expected to reach US$ 562.7 Mn by the end of 2034.
- Asia Pacific Security Seals Market – The Asia Pacific security seals market (セキュリティシール市場) is estimated to grow at a CAGR of 5.8% from 2024 to 2034 and reach US$ 599.3 Mn by the end of 2034.
About Transparency Market Research
Transparency Market Research, a global market research company registered at Wilmington, Delaware, United States, provides custom research and consulting services. Our exclusive blend of quantitative forecasting and trends analysis provides forward-looking insights for thousands of decision makers. Our experienced team of Analysts, Researchers, and Consultants use proprietary data sources and various tools & techniques to gather and analyses information.
Our data repository is continuously updated and revised by a team of research experts, so that it always reflects the latest trends and information. With a broad research and analysis capability, Transparency Market Research employs rigorous primary and secondary research techniques in developing distinctive data sets and research material for business reports.
Contact:
Transparency Market Research Inc.
CORPORATE HEADQUARTER DOWNTOWN,
1000 N. West Street,
Suite 1200, Wilmington, Delaware 19801 USA
Tel: +1-518-618-1030
USA – Canada Toll Free: 866-552-3453
Website: https://www.transparencymarketresearch.com
Email: sales@transparencymarketresearch.com
Follow Us: LinkedIn| Twitter| Blog | YouTube

Market News and Data brought to you by Benzinga APIs
© 2024 Benzinga.com. Benzinga does not provide investment advice. All rights reserved.
Market Isn't Worried About Recession — There Is One Way To Know When It Is, Analyst Says
The market is not fretting over the possibility of a recession, according to an analyst, despite concerns over the economy softening.
There is one metric that proves that the U.S. is not headed there, said Nick Colas, co-founder of Datatrek.
“U.S. corporate bond spreads are off their 2024 lows but still down from 2023 and the start of the year,” he wrote in Datatrek’s newsletter. “If this risk-averse market were worried about a looming recession, spreads would be gapping higher.”
The option adjusted spread (OAS) for high-yield corporate bonds have remained at 99 basis points since Sept. 4, according to the Federal Reserve Bank of St. Louis.
Read Also: Top 10 US Corporate Bonds By Market Performance In 2024: April Update
The spread went as low as 88 basis points on June 3 but reached 164 basis points on March 15, 2023.
This spread measures the additional yield investors demand to compensate for the higher risk associated with high-yield (or “junk”) bonds compared to the virtually risk-free U.S. Treasuries.
Colas also noted the Atlanta Fed’s GDPNow model continues to show solid economic growth in the third quarter, with a current estimate of 2.5% gross domestic product (GDP) growth and a consistent 2% GDP growth or better since the start of the quarter.
Investors worried about a recession when the S&P 500 dropped 4.1% last week to close at 5,406 points on Friday to mark the biggest drop since the March 2023 banking crisis.
The S&P 500, tracked by the SPDR S&P 500 ETF Trust, has since rebounded, slipping 0.04% to 5,469 points into Tuesday’s late-morning trading.
Read Now:
Photo: Shutterstock
Market News and Data brought to you by Benzinga APIs
© 2024 Benzinga.com. Benzinga does not provide investment advice. All rights reserved.
Sell Alert: Earl Michael Campbell Cashes Out $490K In Equinix Stock
Earl Michael Campbell, Chief Sales Officer at Equinix EQIX, reported an insider sell on September 9, according to a new SEC filing.
What Happened: Campbell’s decision to sell 600 shares of Equinix was revealed in a Form 4 filing with the U.S. Securities and Exchange Commission on Monday. The total value of the sale is $490,036.
Equinix‘s shares are actively trading at $858.5, experiencing a up of 3.21% during Tuesday’s morning session.
Unveiling the Story Behind Equinix
Equinix operates 260 data centers in 71 markets worldwide. It generates 44% of total revenue in the Americas, 35% in Europe, the Middle East, and Africa, and 21% in Asia-Pacific. The firm has more than 10,000 customers, including 2,100 network providers, that are dispersed over five verticals: cloud and IT services, content providers, network and mobile services, financial services, and enterprise. About 70% of Equinix’s revenue comes from renting space to tenants and related services, and more than 15% comes from interconnection. Equinix operates as a real estate investment trust.
Understanding the Numbers: Equinix’s Finances
Positive Revenue Trend: Examining Equinix’s financials over 3 months reveals a positive narrative. The company achieved a noteworthy revenue growth rate of 6.93% as of 30 June, 2024, showcasing a substantial increase in top-line earnings. As compared to competitors, the company surpassed expectations with a growth rate higher than the average among peers in the Real Estate sector.
Analyzing Profitability Metrics:
-
Gross Margin: The company shows a low gross margin of 49.88%, indicating concerns regarding cost management and overall profitability relative to its industry counterparts.
-
Earnings per Share (EPS): Equinix’s EPS outshines the industry average, indicating a strong bottom-line trend with a current EPS of 3.17.
Debt Management: Equinix’s debt-to-equity ratio is below the industry average. With a ratio of 1.46, the company relies less on debt financing, maintaining a healthier balance between debt and equity, which can be viewed positively by investors.
Navigating Market Valuation:
-
Price to Earnings (P/E) Ratio: A higher-than-average P/E ratio of 76.17 suggests caution, as the stock may be overvalued in the eyes of investors.
-
Price to Sales (P/S) Ratio: With a relatively high Price to Sales ratio of 9.32 as compared to the industry average, the stock might be considered overvalued based on sales performance.
-
EV/EBITDA Analysis (Enterprise Value to its Earnings Before Interest, Taxes, Depreciation & Amortization): The company’s EV/EBITDA ratio 26.74 is above the industry average, suggesting that the market values the company more highly for each unit of EBITDA. This could be attributed to factors such as strong growth prospects or superior operational efficiency.
Market Capitalization: Positioned above industry average, the company’s market capitalization underscores its superiority in size, indicative of a strong market presence.
Now trade stocks online commission free with Charles Schwab, a trusted and complete investment firm.
The Relevance of Insider Transactions
Investors should view insider transactions as part of a multifaceted analysis and not rely solely on them for decision-making.
Exploring the legal landscape, an “insider” is defined as any officer, director, or beneficial owner holding more than ten percent of a company’s equity securities, as stipulated by Section 12 of the Securities Exchange Act of 1934. This encompasses executives in the c-suite and major hedge funds. These insiders are required to report their transactions through a Form 4 filing, which must be submitted within two business days of the transaction.
Highlighted by a company insider’s new purchase, there’s a positive anticipation for the stock to rise.
But, insider sells may not necessarily indicate a bearish view and can be motivated by various factors.
Unlocking the Meaning of Transaction Codes
Investors prefer focusing on transactions that take place in the open market, indicated in Table I of the Form 4 filing. A P in Box 3 indicates a purchase, while S indicates a sale. Transaction code C indicates the conversion of an option, and transaction code A indicates grant, award or other acquisition of securities from the company.
Check Out The Full List Of Equinix’s Insider Trades.
This article was generated by Benzinga’s automated content engine and reviewed by an editor.
Market News and Data brought to you by Benzinga APIs
© 2024 Benzinga.com. Benzinga does not provide investment advice. All rights reserved.
Barnes & Noble Education Reports First Quarter Fiscal Year 2025 Financial Results
BNC First Day Program Revenues Increased 32%
Recent Initiatives Expected to Drive Over $10 Million of Go-Forward Savings
BASKING RIDGE, N.J., Sept. 10, 2024 (GLOBE NEWSWIRE) — Barnes & Noble Education, Inc. BNED, a leading solutions provider for the education industry, today reported sales and earnings for the first quarter ended on July 27, 2024. The following figures are GAAP results from continuing operations on a consolidated basis, unless noted otherwise. Note that Adjusted EBITDA is a non-GAAP calculation. Full quarterly financial tables and a reconciliation of non-GAAP measures to the most applicable GAAP measures can be found in the Investor Relations section of BNED’s website at https://investor.bned.com and its Current Report on Form 8-K filed with the SEC on the date of this release.
Barnes & Noble Education is a highly seasonal business, and the first quarter is historically a period of low sales activity for the Company. First quarter fiscal year 2025 revenue decreased by $(0.7) million, or -0.3%, from last year to $263.4 million, primarily driven by a net decrease in physical locations, many of which were closures of underperforming stores, which has helped to improve profitability. Revenues from BNC First Day programs increased approximately $19.6 million, or 32%, helping to offset much of the decline.
Overall net loss was $(99.5) million, which was elevated due to one-time expenses related to the recent milestone equity and refinancing transactions1, including a non-cash charge of $(55.2) million due to the extinguishment of debt caused by the conversion of our second lien debt into equity. This event meaningfully strengthened the Company’s balance sheet. Adjusted EBITDA improved by $5.2 million from last year to $(20.7) million, in part due to lower selling and administrative expenses of $10.5 million as the result of cost-saving and productivity initiatives.
Jonathan Shar, CEO, noted, “It was a very busy quarter as we completed our milestone equity and refinancing transactions and worked hard to prepare for the upcoming Fall Rush with our store teams, vendors and other business partners. We are excited by the momentum and fresh energy as we enter the new academic year.
“The rapid growth of our BNC First Day programs is a bright spot for our business, and we anticipate continued growth as numerous institutions adopt our affordable access models for the benefit of their students’ academic success through improved affordability, access and convenience.”
Shar further added, “Our stores are well stocked for Fall Rush, and we are prepared to support students across the country in their academic journey, ensuring they have the resources they need to succeed while providing all of our customers with an unmatched product assortment and retail experience.”
Barnes & Noble Education is focused on driving material improvements in its profitability and seeks to further build upon the strong financial foundation that it recently attained from the milestone transactions. Management is working on consolidating and simplifying its operations to better focus on its core physical and virtual bookstore businesses. Recently completed and in-progress initiatives comprised of over $10.0 million in go-forward savings include the following:
- Streamlining corporate employee staffing levels.
- Optimizing, consolidating and bidding out various insurance programs.
- Repricing, eliminating or consolidating multiple IT and telecom vendors and programs. These efforts included enhancing certain customer support services by utilizing insourcing.
- Changing certain professional service providers and eliminating lower-impact investor and communication resources.
In the medium term, BNED believes that there are opportunities to materially improve its working capital position by lowering certain credit reserves, improving inventory turns, and enhancing the Company’s overall capital allocation framework.
BNED is also working to launch a new stock compensation program, linking elements of compensation to stock price performance, for a broad range of employees that will promote a more ownership-minded culture and better align management and employees with stockholders.
The Company anticipates spending approximately $20.0 million on capital expenditures in fiscal year 2025, with the bulk of those investments focused on store improvements and technology.
At this time, BNED is not providing formal guidance, but management’s budget goals target a material improvement in fiscal year 2025 GAAP operating results and Adjusted EBITDA versus last year. Based on current estimates of capital expenditures and significantly reduced interest costs from last fiscal year, BNED believes it can drive meaningful operating free cash flow, which will be used to further de-lever its balance sheet.
1. On June 10, 2024, the Company closed on the milestone equity and refinancing transactions, which included the infusion of approximately $80.0 million of net new cash into the business and a new four-year, $325.0 million credit facility.
Use of Non-GAAP Financial Information – Adjusted Earnings, Adjusted EBITDA, and Free Cash Flow
To supplement the Company’s condensed consolidated financial statements presented in accordance with generally accepted accounting principles (“GAAP”) the Company uses the financial measures of Adjusted Earnings, Adjusted EBITDA, and Free Cash Flow, which are non-GAAP financial measures under Securities and Exchange Commission (the “SEC”) regulations. We define Adjusted Earnings as net income (loss) adjusted for certain reconciling items that are subtracted from or added to net income (loss). We define Adjusted EBITDA as net income (loss) plus (1) depreciation and amortization; (2) interest expense and (3) income taxes, (4) as adjusted for items that are subtracted from or added to net income (loss). We define Free Cash Flow as Cash Flows from Operating Activities less capital expenditures, cash interest and cash taxes.
These non-GAAP measures have been reconciled to the most comparable financial measures presented in accordance with GAAP as follows: the reconciliation of Adjusted Earnings to net income (loss); the reconciliation of consolidated Adjusted EBITDA to consolidated net income (loss); and the reconciliation of Free Cash Flow to Cash Flows from Operating Activities. All of the items included in the reconciliations are either (i) non-cash items or (ii) items that management does not consider in assessing our on-going operating performance.
These non-GAAP financial measures are not intended as substitutes for and should not be considered superior to measures of financial performance prepared in accordance with GAAP. In addition, the Company’s use of these non-GAAP financial measures may be different from similarly named measures used by other companies, limiting their usefulness for comparison purposes.
We review these non-GAAP financial measures as internal measures to evaluate our performance at a consolidated level to manage our operations. We believe that these measures are useful performance measures which are used by us to facilitate a comparison of our on-going operating performance on a consistent basis from period-to-period. We believe that these non-GAAP financial measures provide for a more complete understanding of factors and trends affecting our business than measures under GAAP can provide alone, as they exclude certain items that management believes do not reflect the ordinary performance of our operations in a particular period. Our Board of Directors and management also use Adjusted EBITDA at a consolidated level as one of the primary methods for planning and forecasting expected performance, for evaluating on a quarterly and annual basis actual results against such expectations, and as a measure for performance incentive plans. We believe that the inclusion of Adjusted Earnings and Adjusted EBITDA results provides investors useful and important information regarding our operating results, in a manner that is consistent with management’s evaluation of business performance. We believe that Free Cash Flow provides useful additional information concerning cash flow available to meet future debt service obligations and working capital requirements and assists investors in their understanding of our operating profitability and liquidity as we manage the business to maximize margin and cash flow.
The Company urges investors to carefully review the GAAP financial information included as part of the Company’s Form 10-K dated April 27, 2024 filed with the SEC on July 1, 2024, which includes consolidated financial statements for each of the three years for the period ended April 27, 2024, April 29, 2023, and April 30, 2022 (Fiscal 2024, Fiscal 2023, and Fiscal 2022, respectively). The Company also urges investors to carefully review the financial information included as part of the Company’s Quarterly Report on Form 10-Q for the period ended July 27, 2024, filed with the SEC on September 10, 2024. We do not provide a reconciliation of forward-looking non-GAAP financial metrics, because reconciling information is not available without an unreasonable effort, such as attempting to make assumptions that cannot reasonably be made on a forward-looking basis to determine the corresponding GAAP metric.
ABOUT BARNES & NOBLE EDUCATION, INC.
Barnes & Noble Education, Inc. BNED is a leading solutions provider for the education industry, driving affordability, access and achievement at hundreds of academic institutions nationwide and ensuring millions of students are equipped for success in the classroom and beyond. Through its family of brands, BNED offers campus retail services and academic solutions, wholesale capabilities and more. BNED is a company serving all who work to elevate their lives through education, supporting students, faculty and institutions as they make tomorrow a better and smarter world. For more information, visit www.bned.com.
Media & Investor Contact:
Kevin Watson
Executive Vice President
Chief Financial Officer
kwatson@bned.com
Forward-Looking Statements
This press release contains certain “forward-looking statements” within the meaning of the Private Securities Litigation Reform Act of 1995 and information relating to us and our business that are based on the beliefs of our management as well as assumptions made by and information currently available to our management. When used in this communication, the words “anticipate,” “believe,” “estimate,” “expect,” “intend,” “plan,” “will,” “forecasts,” “projections,” and similar expressions, as they relate to us or our management, identify forward-looking statements. Actual results could differ materially from those projected in the forward-looking statements, which include but are not limited to the anticipated savings and benefits of our expense management initiatives, anticipated growth in our BNC First Day program, future capital expenditures, expected trends in financial results, including forward-looking Adjusted EBITDA and operating free cash flow. We caution you not to place undue reliance on these forward-looking statements. Such statements reflect our current views with respect to future events, the outcome of which is subject to certain risks, including, but not limited to: the amount of our indebtedness and ability to comply with covenants contained in our credit agreement; our ability to maintain adequate liquidity levels to support ongoing inventory purchases and related vendor payments in a timely manner; slower than anticipated pace of adoption of our BNC First Day® equitable and inclusive access course material models; our dependency on strategic service provider relationships and the potential for adverse operational and financial changes to these strategic service provider relationships; non-renewal of our managed bookstore, physical and/or online store contracts; general competitive conditions; a decline in college enrollment or decreased funding available for students; technological changes, including the adoption of artificial intelligence technologies for educational content; disruptions to our information technology systems, infrastructure, data, supplier systems, and customer ordering and payment systems due to computer malware, viruses, hacking and phishing attacks; disruption of or interference with third party service providers and our own proprietary technology; impacts that public health crises may have on the overall demand for BNED products and services, our operations, the operations of our suppliers, service providers, and campus partners as well as the ability of our suppliers to manufacture or source products, particularly from outside of the United States; and changes in applicable domestic and international laws, rules or regulations or changes in enforcement practices, including, without limitation, the impact of recently proposed regulatory changes by the United States Department of Education, U.S. tax reform, or changes to consumer data privacy rights legislation, as well as related guidance. Moreover, we operate in a very competitive and rapidly changing environment and new risks may emerge from time to time. It is not possible for our management to predict all risks, nor can we assess the impact of all factors on our business or the extent to which any factor, or combination of factors, may cause actual results to differ materially from those contained in any forward-looking statements we may make.
For a more detailed discussion of these factors, and other factors that could cause actual results to vary materially, interested parties should review the risk factors listed in the Company’s Annual Report on Form 10-K for the year ended April 27, 2024 as filed with the SEC. Any forward-looking statements made by us in this press release speak only as of the date of this press release, and we do not intend to update these forward-looking statements after the date of this press release, except as required by law.

© 2024 Benzinga.com. Benzinga does not provide investment advice. All rights reserved.
Why Hanover Insurance Group is a Top Dividend Stock for Your Portfolio
Getting big returns from financial portfolios, whether through stocks, bonds, ETFs, other securities, or a combination of all, is an investor’s dream. However, when you’re an income investor, your primary focus is generating consistent cash flow from each of your liquid investments.
While cash flow can come from bond interest or interest from other types of investments, income investors hone in on dividends. A dividend is the distribution of a company’s earnings paid out to shareholders; it’s often viewed by its dividend yield, a metric that measures a dividend as a percent of the current stock price. Many academic studies show that dividends account for significant portions of long-term returns, with dividend contributions exceeding one-third of total returns in many cases.
Hanover Insurance Group in Focus
Hanover Insurance Group THG is headquartered in Worcester, and is in the Finance sector. The stock has seen a price change of 21.43% since the start of the year. The insurance company is paying out a dividend of $0.85 per share at the moment, with a dividend yield of 2.31% compared to the Insurance – Property and Casualty industry’s yield of 0.35% and the S&P 500’s yield of 1.58%.
Taking a look at the company’s dividend growth, its current annualized dividend of $3.40 is up 3.7% from last year. Over the last 5 years, Hanover Insurance Group has increased its dividend 5 times on a year-over-year basis for an average annual increase of 7.28%. Any future dividend growth will depend on both earnings growth and the company’s payout ratio; a payout ratio is the proportion of a firm’s annual earnings per share that it pays out as a dividend. Hanover Insurance’s current payout ratio is 41%, meaning it paid out 41% of its trailing 12-month EPS as dividend.
THG is expecting earnings to expand this fiscal year as well. The Zacks Consensus Estimate for 2024 is $10.85 per share, representing a year-over-year earnings growth rate of 595.51%.
Bottom Line
From greatly improving stock investing profits and reducing overall portfolio risk to providing tax advantages, investors like dividends for a variety of different reasons. However, not all companies offer a quarterly payout.
Big, established firms that have more secure profits are often seen as the best dividend options, but it’s fairly uncommon to see high-growth businesses or tech start-ups offer their stockholders a dividend. Income investors have to be mindful of the fact that high-yielding stocks tend to struggle during periods of rising interest rates. With that in mind, THG presents a compelling investment opportunity; it’s not only an attractive dividend play, but the stock also boasts a strong Zacks Rank of #2 (Buy).
Market News and Data brought to you by Benzinga APIs
© 2024 Benzinga.com. Benzinga does not provide investment advice. All rights reserved.
Chubb's Options: A Look at What the Big Money is Thinking
High-rolling investors have positioned themselves bearish on Chubb CB, and it’s important for retail traders to take note.
This activity came to our attention today through Benzinga’s tracking of publicly available options data. The identities of these investors are uncertain, but such a significant move in CB often signals that someone has privileged information.
Today, Benzinga’s options scanner spotted 8 options trades for Chubb. This is not a typical pattern.
The sentiment among these major traders is split, with 25% bullish and 50% bearish. Among all the options we identified, there was one put, amounting to $35,850, and 7 calls, totaling $395,285.
Predicted Price Range
Analyzing the Volume and Open Interest in these contracts, it seems that the big players have been eyeing a price window from $255.0 to $360.0 for Chubb during the past quarter.
Insights into Volume & Open Interest
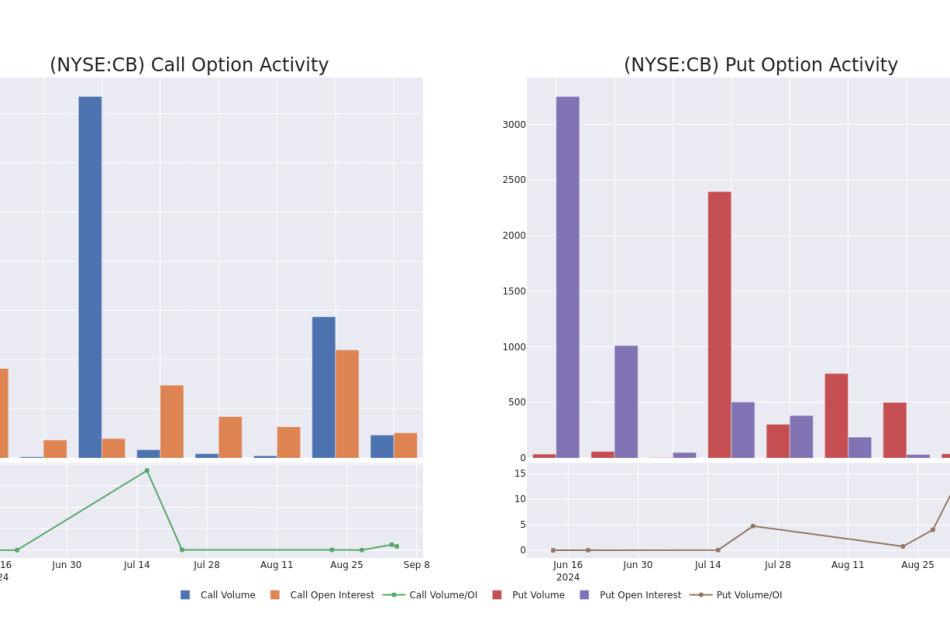
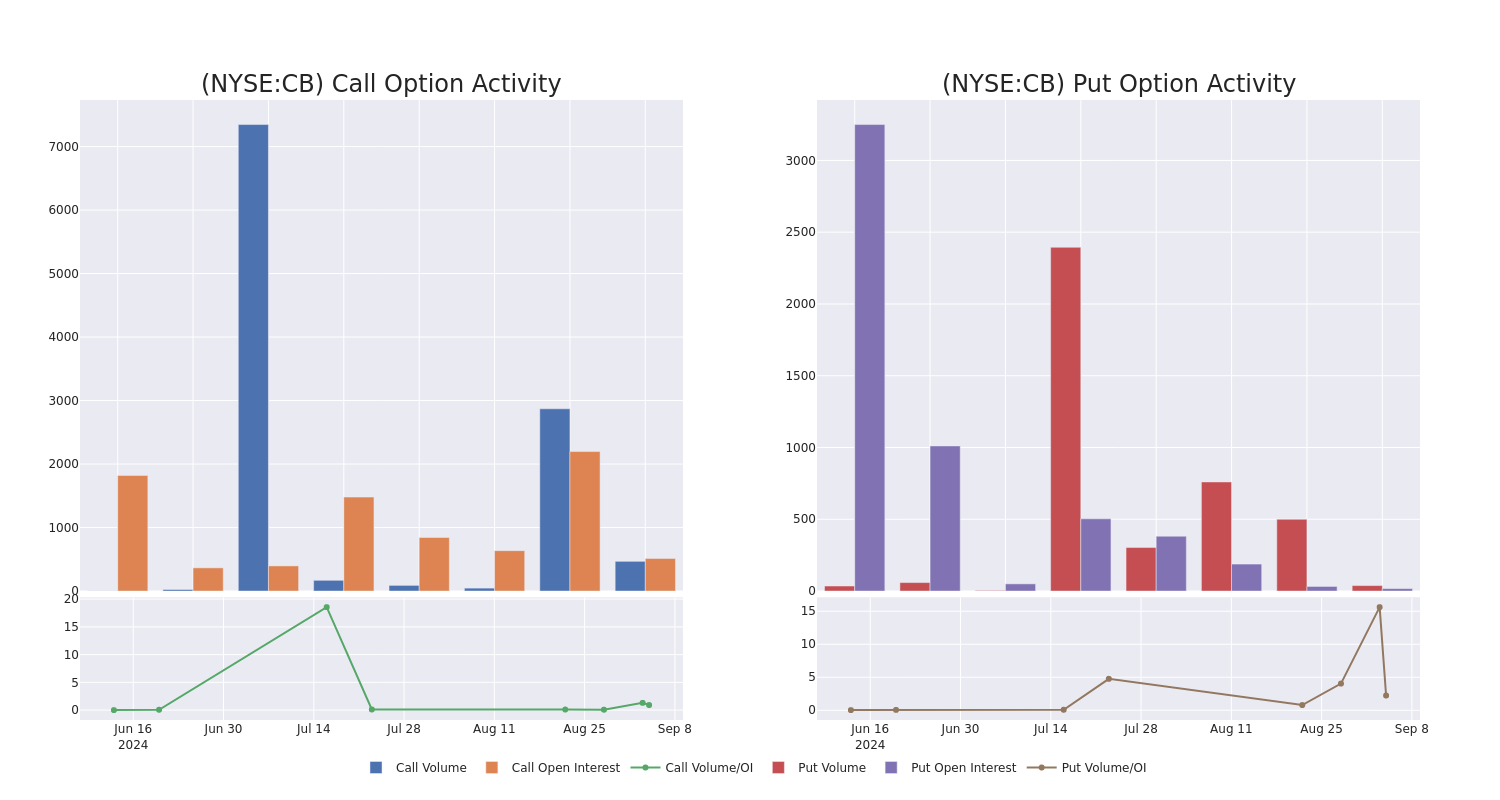
Assessing the volume and open interest is a strategic step in options trading. These metrics shed light on the liquidity and investor interest in Chubb’s options at specified strike prices. The forthcoming data visualizes the fluctuation in volume and open interest for both calls and puts, linked to Chubb’s substantial trades, within a strike price spectrum from $255.0 to $360.0 over the preceding 30 days.
Chubb Option Volume And Open Interest Over Last 30 Days
Biggest Options Spotted:
| Symbol | PUT/CALL | Trade Type | Sentiment | Exp. Date | Ask | Bid | Price | Strike Price | Total Trade Price | Open Interest | Volume |
|---|---|---|---|---|---|---|---|---|---|---|---|
| CB | CALL | SWEEP | NEUTRAL | 11/15/24 | $13.1 | $12.1 | $12.55 | $290.00 | $111.6K | 125 | 216 |
| CB | CALL | SWEEP | NEUTRAL | 11/15/24 | $8.1 | $6.9 | $7.55 | $300.00 | $67.1K | 149 | 194 |
| CB | CALL | SWEEP | BEARISH | 01/17/25 | $12.9 | $11.6 | $11.75 | $300.00 | $52.9K | 832 | 45 |
| CB | CALL | TRADE | BULLISH | 01/17/25 | $7.6 | $7.4 | $7.59 | $310.00 | $52.3K | 234 | 70 |
| CB | CALL | TRADE | BEARISH | 11/15/24 | $4.4 | $4.0 | $4.12 | $310.00 | $41.2K | 207 | 106 |
About Chubb
ACE acquired Chubb in the first quarter of 2016 and assumed the Chubb name. The combination made the new Chubb one of the largest domestic property and casualty insurers, with operations in 54 countries spanning commercial and personal P&C insurance, reinsurance, and life insurance.
Present Market Standing of Chubb
- With a trading volume of 1,138,845, the price of CB is down by -0.4%, reaching $291.03.
- Current RSI values indicate that the stock is may be overbought.
- Next earnings report is scheduled for 42 days from now.
What The Experts Say On Chubb
Over the past month, 1 industry analysts have shared their insights on this stock, proposing an average target price of $349.0.
- An analyst from Barclays has revised its rating downward to Overweight, adjusting the price target to $349.
Options trading presents higher risks and potential rewards. Astute traders manage these risks by continually educating themselves, adapting their strategies, monitoring multiple indicators, and keeping a close eye on market movements. Stay informed about the latest Chubb options trades with real-time alerts from Benzinga Pro.
Market News and Data brought to you by Benzinga APIs
© 2024 Benzinga.com. Benzinga does not provide investment advice. All rights reserved.
Wall Street Falls Ahead Of Trump-Harris Debate, Bank Stocks Tumble, Oil Plummets To $65 On Weaker Demand Outlook: What's Driving Markets Tuesday?
Risk aversion is shaping another tough day for Wall Street, with stocks trading in the red as investors await the presidential debate between Vice President Kamala Harris and former President Donald Trump, scheduled at 9 p.m. ET.
Energy and financial sectors are witnessing deeper losses, sharply underperforming the rest of the market.
In the latest monthly report, OPEC revised its global oil demand growth forecasts downward, now expecting 2024 oil demand to increase by 2.03 million barrels per day (bpd), down from the previous estimate of 2.1 million bpd. For 2025, OPEC has trimmed global demand growth forecast to 1.74 million bpd, compared to the earlier projection of 1.78 million bpd.
On the regulatory front, Federal Reserve Board Vice Chair for Supervision Michael Barr announced changes to the BASEL III and GSIB (Global Systemically Important Banks) surcharge proposals, which will now increase capital requirements for the largest banks by 9%, down from the original plan of 19%. Barr also clarified that banks with assets under $250 billion would largely be exempt from these heightened requirements.
Despite this capital relief, financial stocks sank across the board. The financial sector gauge fell 2%, with JPMorgan Chase & Co. JPM dropping 7%. The SPDR Regional Banking ETF KRE declined 2.6%, reflecting ongoing pressure even on the regional bank industry which is largely exempted from the regulation.
Elsewhere, Treasuries continued to rally. The iShares 20+ Year Treasury Bond ETF TLT rose 0.6%, hitting its highest levels since late July 2023.
The Japanese yen gained 0.5%, while both gold and Bitcoin BTC/USD traded broadly flat, reflecting a mixed sentiment in alternative assets.
| Major Indices | Price | 1-day %chg |
| Nasdaq 100 | 18,667.20 | 0.0% |
| S&P 500 | 5,458.25 | -0.2% |
| Dow Jones | 40,509.61 | -0.8% |
| Russell 2000 | 2,081.31 | -1.0% |
According to Benzinga Pro data:
- The SPDR S&P 500 ETF Trust SPY was 0.2% lower to $545.43.
- The SPDR Dow Jones Industrial Average DIA fell 0.6% to $406.46.
- The tech-heavy Invesco QQQ Trust Series QQQ inched 0.1% higher to $454.91.
- The iShares Russell 2000 ETF IWM fell 1% to $206.36.
- The Real Estate Select Sector SPDR Fund XLRE outperformed, up 0.8%. The Energy Select Sector SPDR Fund XLE and the Financials Select Sector SPDR Fund XLF were the laggards, down 2.1% and 1.9%, respectively.
- Worst-performing energy stocks were Diamondback Energy, Inc. FANG, APA Corporation APA and Exxon Mobil Corporation XOM, down 5.1%, 5% and 3.4%, respectively.
- Hewlett Packard Enterprise Company HPE fell over 7% as the company announced it has commenced a public offering of $1.35 billion (27 million shares) of Series C mandatory convertible preferred stock.
- Oracle Corp. ORCL rallied 12% on the back of stronger-than-expected quarterly results.
- Other stocks reacting to earnings were Rubrik Inc. RBRK down 5.8% and Academy Sports and Outdoors Inc. ASO up 5.68%.
- GameStop Corp. GME will report earnings after the close.
Read Also:
Photo: Shutterstock
Market News and Data brought to you by Benzinga APIs
© 2024 Benzinga.com. Benzinga does not provide investment advice. All rights reserved.
Unpacking the Latest Options Trading Trends in Ulta Beauty
Investors with a lot of money to spend have taken a bearish stance on Ulta Beauty ULTA.
And retail traders should know.
We noticed this today when the trades showed up on publicly available options history that we track here at Benzinga.
Whether these are institutions or just wealthy individuals, we don’t know. But when something this big happens with ULTA, it often means somebody knows something is about to happen.
So how do we know what these investors just did?
Today, Benzinga‘s options scanner spotted 24 uncommon options trades for Ulta Beauty.
This isn’t normal.
The overall sentiment of these big-money traders is split between 37% bullish and 54%, bearish.
Out of all of the special options we uncovered, 6 are puts, for a total amount of $298,006, and 18 are calls, for a total amount of $1,248,319.
What’s The Price Target?
Taking into account the Volume and Open Interest on these contracts, it appears that whales have been targeting a price range from $330.0 to $470.0 for Ulta Beauty over the last 3 months.
Insights into Volume & Open Interest
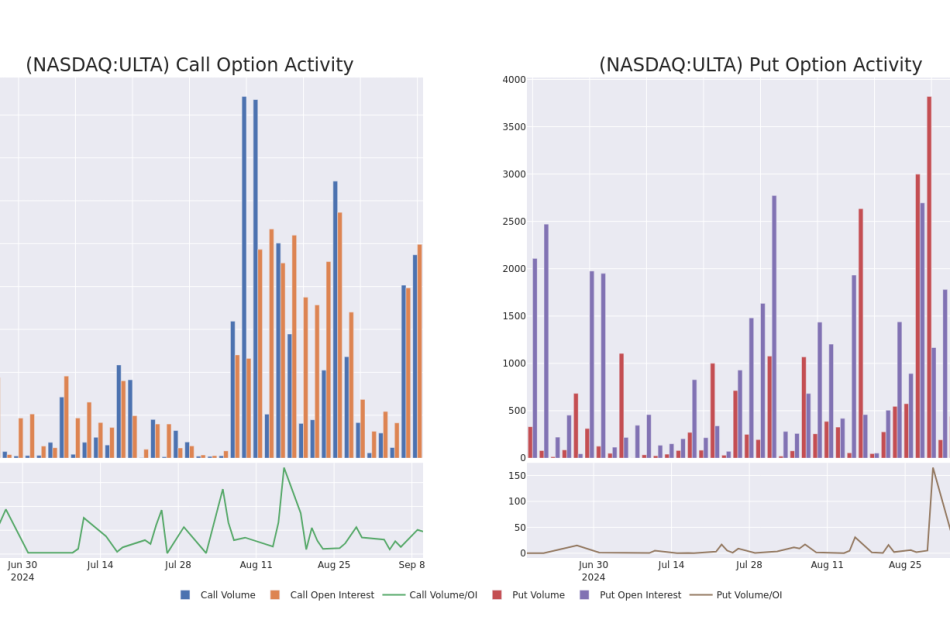
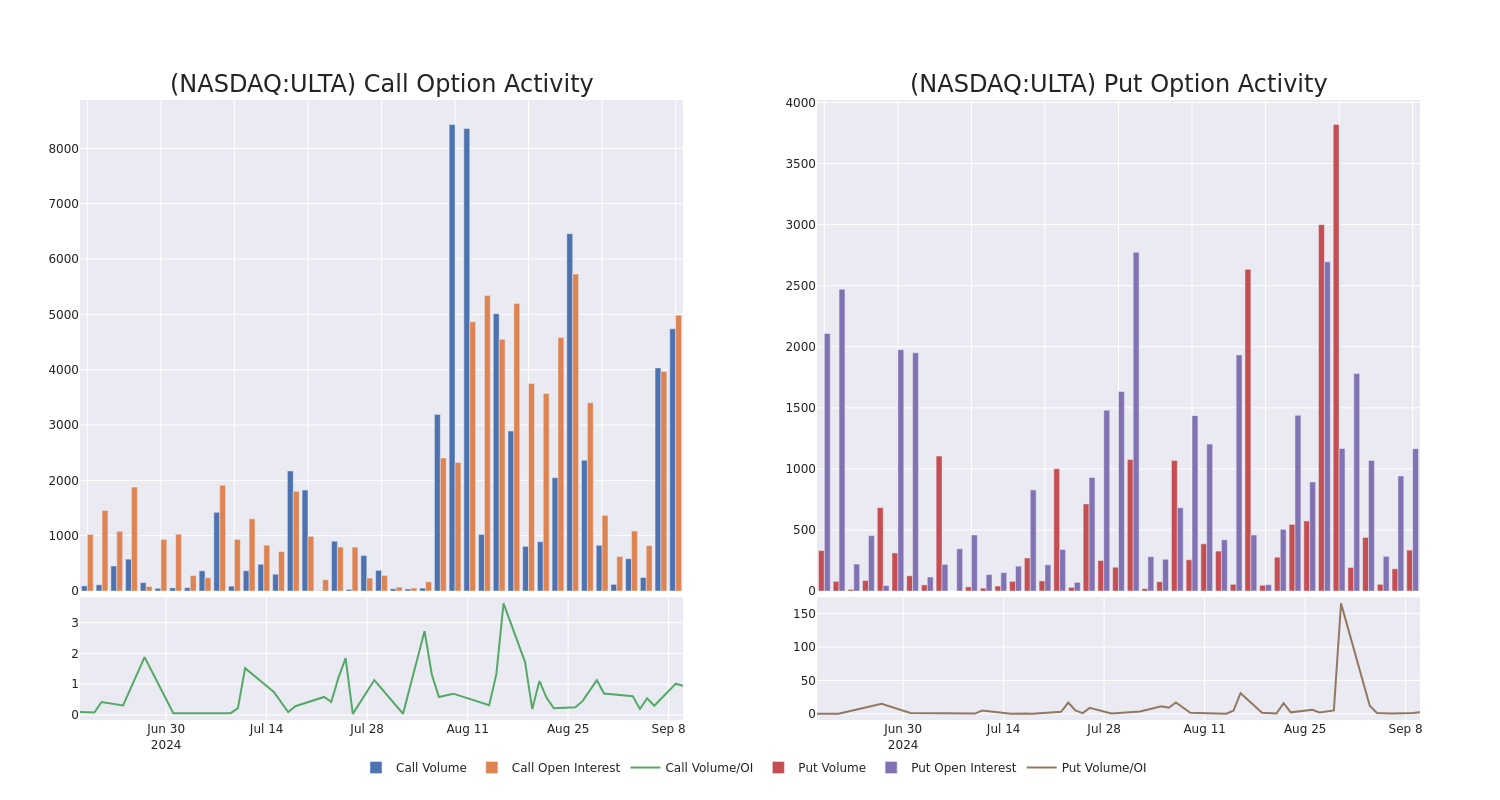
Assessing the volume and open interest is a strategic step in options trading. These metrics shed light on the liquidity and investor interest in Ulta Beauty’s options at specified strike prices. The forthcoming data visualizes the fluctuation in volume and open interest for both calls and puts, linked to Ulta Beauty’s substantial trades, within a strike price spectrum from $330.0 to $470.0 over the preceding 30 days.
Ulta Beauty Option Activity Analysis: Last 30 Days
Biggest Options Spotted:
| Symbol | PUT/CALL | Trade Type | Sentiment | Exp. Date | Ask | Bid | Price | Strike Price | Total Trade Price | Open Interest | Volume |
|---|---|---|---|---|---|---|---|---|---|---|---|
| ULTA | CALL | SWEEP | BEARISH | 06/20/25 | $21.1 | $18.5 | $18.5 | $450.00 | $560.5K | 1.9K | 432 |
| ULTA | CALL | TRADE | BEARISH | 06/20/25 | $20.8 | $17.2 | $18.5 | $450.00 | $133.2K | 1.9K | 1.0K |
| ULTA | PUT | TRADE | BEARISH | 09/13/24 | $11.9 | $9.6 | $11.9 | $377.50 | $83.3K | 128 | 103 |
| ULTA | PUT | TRADE | BULLISH | 10/11/24 | $14.9 | $14.5 | $14.5 | $375.00 | $72.5K | 52 | 53 |
| ULTA | CALL | TRADE | BEARISH | 09/20/24 | $6.3 | $5.0 | $5.3 | $375.00 | $53.0K | 574 | 149 |
About Ulta Beauty
With 1,385 stores at the end of fiscal 2023 and a partnership with Target, Ulta Beauty is the largest specialized beauty retailer in the US. The firm offers makeup (41% of 2023 sales), fragrances, skin care (19% of sales), and hair care products (19% of sales), and bath and body items. Ulta offers private-label products and merchandise from more than 500 vendors. It also offers salon services, including hair, makeup, skin, and brow services, in all stores. Most Ulta stores are approximately 10,000 square feet and are in suburban strip centers. Ulta was founded in 1990 and is based in Bolingbrook, Illinois.
Present Market Standing of Ulta Beauty
- Trading volume stands at 2,008,257, with ULTA’s price down by -2.11%, positioned at $373.5.
- RSI indicators show the stock to be may be approaching overbought.
- Earnings announcement expected in 80 days.
Options trading presents higher risks and potential rewards. Astute traders manage these risks by continually educating themselves, adapting their strategies, monitoring multiple indicators, and keeping a close eye on market movements. Stay informed about the latest Ulta Beauty options trades with real-time alerts from Benzinga Pro.
Market News and Data brought to you by Benzinga APIs
© 2024 Benzinga.com. Benzinga does not provide investment advice. All rights reserved.
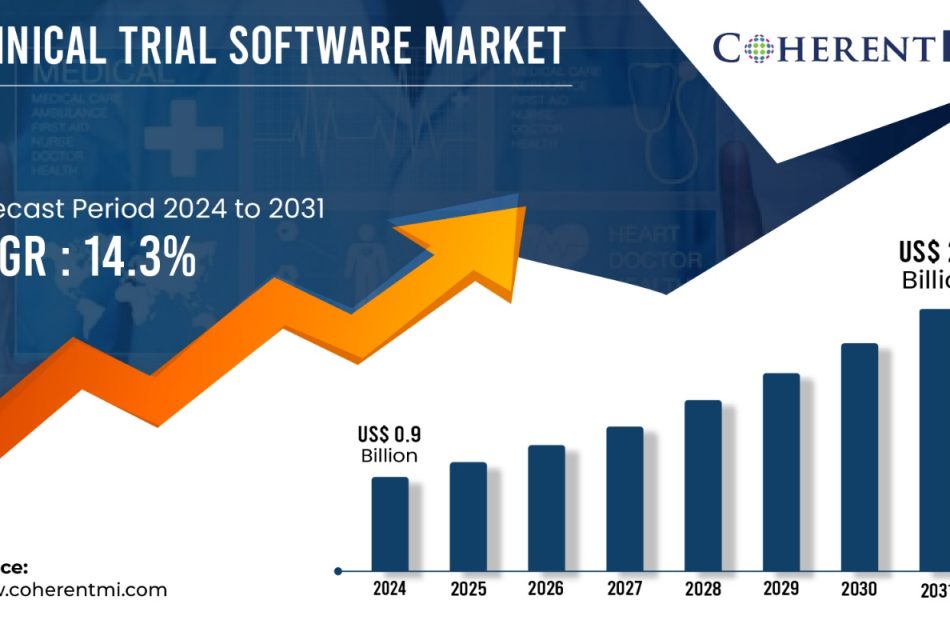
Clinical Trial Software Market Surges to US$ 2.3 Billion by 2031, Propelled by 14.3% CAGR, States CoherentMI
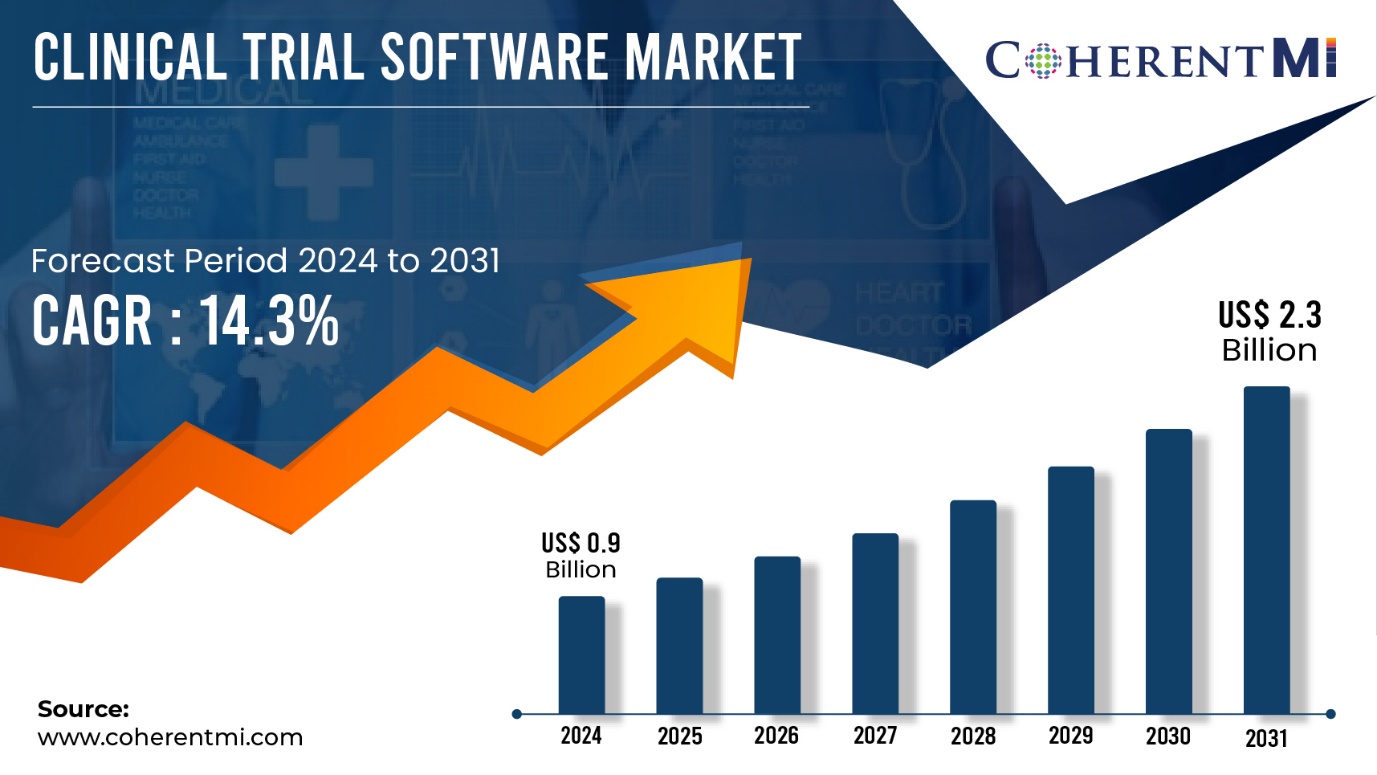
Burlingame, Sept. 10, 2024 (GLOBE NEWSWIRE) — CoherentMI published a report, titled, Clinical Trial Software Market is estimated to value at US$ 0.9 Billion in the year 2024, and is anticipated to reach US$ 2.3 Billion by 2031, with growing at a CAGR of 14.3% during forecast period 2024-2031. The biopharmaceutical industry has been steadily increasing investment in R&D year after year to develop new drugs and treatments. As complex clinical trials are an important part of drug development, companies are allocating greater budgets to clinical trial processes and management. Furthermore, The COVID-19 pandemic accelerated the adoption of digital health solutions as social distancing norms encouraged remote monitoring of patients. Telehealth emerged as a viable method to screen, diagnose and treat patients without physical visits. This highlighted how modern technologies can simplify clinical trials while maintaining participant safety.
Market Report Scope:
| Report Coverage | Details |
| Market Revenue in 2024: | US$ 0.9 Billion |
| Estimated Value by 2031: | US$ 2.3 Billion |
| Growth Rate: | Poised to grow at a CAGR of 14.3% |
| Historical Data: | 2019–2023 |
| Forecast Period: | 2024–2031 |
| Forecast Units: | Value (USD Million/Billion) |
| Report Coverage: | Revenue Forecast, Competitive Landscape, Growth Factors, and Trends |
| Segments Covered: | By Features of Software, By Type of Deployment |
| Geographies Covered: | Global |
| Major Players: | Advarra, Arisglobal, AssistRx, Calyx, Clario and Among Others. |
| Growth Drivers: | • Increased digitalization in clinical trials |
| • Rising demand for patient-centric clinical trial solutions | |
| Restraints & Challenges: | • High costs associated with implementation |
Market Dynamics:
The clinical trial software market is driven by the increasing digitization in the healthcare sector and rising adoption of clinical trial management systems. Clinical trial software enables efficient management of complex clinical trial processes by streamlining workflows, improving communication among research sites and sponsors, and ensuring compliance. This enhances the productivity and speed of clinical trials.
Key Market Takeaways:
The global clinical trial software market size is anticipated to witness a CAGR of 14.3% during the forecast period 2024-2031, owing to increasing digitalization and growing R&D investments in pharmaceutical and biotech industries. On the basis of features of software, EDC segment is expected to hold a dominant position, owing to its widespread adoption for simplifying clinical trial data management. On the basis of type of deployment, on-cloud segment is expected to hold a dominant position over the forecast period, due to benefits like seamless collaboration, remote monitoring and automatic updates.
On the basis of region, North America is expected to hold a dominant position over the forecast period, due to presence of majority global players, fast adoption of advanced technologies and high clinical research expenditure in the region. Key players operating in the clinical trial software market include Advarra, Arisglobal, AssistRx, Calyx, Clario, IBM, IQVIA, Medidata, Oracle, Signant Health, and Veeva. These players are focusing on new product launches and partnerships with pharmaceutical companies to strengthen their market position and capture higher shares in the overall clinical trial software market.
Market Trends:
Cloud-based clinical trial software is gaining popularity in the market. Cloud deployment reduces IT costs and provides remote access along with centralized data management. It helps clinical trial managers in making real-time decisions and resolving issues quickly. Another key trend is the advent of artificial intelligence in clinical trials. AI assists in patient recruitment, monitoring, and analysis of huge clinical data to gain meaningful insights for researchers. This accelerates various clinical processes and results.
Electronic Data Capture (EDC): The EDC feature allows monitoring and documentation of clinical trial data in electronic format replacing traditional paper-based methods. EDC software helps in efficiently planning, collecting, validating and managing clinical trial data in real-time. Streamlining data collection and management reduces costs and speeds up the overall clinical trial process. EDC segment is expected to hold the major share of over 35% of the overall clinical trial software market during the forecast period owing to its widespread adoption for simplifying data handling.
Cloud and On-premises Deployment: Clinical trial software can be deployed either through cloud or on-premises model. The cloud-based deployment or Software as a Service (SaaS) model is gaining popularity as it eliminates upfront capital expenses and provides flexibility to access software from any location. The on-cloud segment is anticipated to hold over 55% share of the total market size by 2031, attributed to benefits like seamless collaboration, remote monitoring and automatic updates. However, the on-premises deployment continues to find applications where data privacy and regulatory concerns necessitate local data storage.
Recent Development:
- In August 2023, Texas Tech University Health Sciences Center collaborated with Deep 6 AI to launch an AI program for clinical trials.
- In August 2023, Globant partnered with Medocity to accelerate digitalization in clinical research.
Get a detailed analysis on regions, market segments, and companies: https://www.coherentmi.com/industry-reports/clinical-trial-software-market
Clinical Trial Software Market Segmentation:
- By Features of Software –
- By Type of Deployment –
The research provides answers to the following key questions:
- What is the estimated growth rate of the market for the forecast period 2024-2031?
- What will be the market size during the estimated period?
- What are the key driving forces responsible for shaping the fate of the Clinical Trial Software market during the forecast period?
- Who are the major market vendors and what are the winning strategies that have helped them occupy a strong foothold in the Clinical Trial Software market?
- What are the prominent market trends influencing the development of the Clinical Trial Software market across different regions?
- What are the major threats and challenges likely to act as a barrier in the growth of the Clinical Trial Software market?
- What are the major opportunities the market leaders can rely on to gain success and profitability?
Purchase Latest Edition of this Research Report @ https://www.coherentmi.com/industry-reports/clinical-trial-software-market/buynow
Key insights provided by the report that could help you take critical strategic decisions?
- Regional report analysis highlighting the consumption of products/services in a region also shows the factors that influence the market in each region.
- Reports provide opportunities and threats faced by suppliers in the Clinical Trial Software industry around the world.
- The report shows regions and sectors with the fastest growth potential.
- A competitive environment that includes market rankings of major companies, along with new product launches, partnerships, business expansions, and acquisitions.
- The report provides an extensive corporate profile consisting of company overviews, company insights, product benchmarks, and SWOT analysis for key market participants.
- This report provides the industry’s current and future market outlook on the recent development, growth opportunities, drivers, challenges, and two regional constraints emerging in advanced regions.
Browse Related Reports:
At Home Testing Kits Market: The at home testing kits market is estimated to be valued at USD 20.40 Bn in 2024 and is expected to reach USD 31.15 Bn by 2031, growing at a compound annual growth rate (CAGR) of 6.2% from 2024 to 2031.
Clinical Trial Patient Recruitment Services Market: The clinical trial patient recruitment services market is estimated to be valued at USD 9.4 Bn in 2024 and is expected to reach USD 19.1 Bn by 2031, growing at a compound annual growth rate (CAGR) of 8.2% from 2024 to 2031.
Australia Blood Ketone Meter Market: The Australia Blood Ketone Meter Market is estimated to be valued at USD 10.9 Mn in 2024 and is expected to reach USD 18.8 Mn by 2031, growing at a compound annual growth rate (CAGR) of 7% from 2024 to 2031.
U.S. Colorectal Cancer Screening Market: U.S. colorectal cancer screening market size was valued at US$ 5.95 Bn in 2023 and is expected to reach US$ 10.62 Bn by 2031, grow at a compound annual growth rate (CAGR) of 7.5% from 2024 to 2031.
Author of this marketing PR:
Ravina Pandya, PR Writer, has a strong foothold in the market research industry. She specializes in writing well-researched articles from different industries, including food and beverages, information and technology, healthcare, chemical and materials, etc. With an MBA in E-commerce, she has an expertise in SEO-optimized content that resonates with industry professionals.
About Us:
At CoherentMI, we are a leading global market intelligence company dedicated to providing comprehensive insights, analysis, and strategic solutions to empower businesses and organizations worldwide. Moreover, CoherentMI is a subsidiary of Coherent Market Insights Pvt Ltd., which is a market intelligence and consulting organization that helps businesses in critical business decisions. With our cutting-edge technology and experienced team of industry experts, we deliver actionable intelligence that helps our clients make informed decisions and stay ahead in today’s rapidly changing business landscape.

Mr. Shah
CoherentMI,
U.S.: +1-650-918-5898
U.K: +44-020-8133-4027
Australia: +61-2-4786-0457
INDIA: +91-848-285-0837
Email: sales@coherentmi.com
Website: https://www.coherentmi.com
© 2024 Benzinga.com. Benzinga does not provide investment advice. All rights reserved.

