Bitcoin, Ethereum, Dogecoin Flat As Investors Await Fed's FOMC Meet: Top Analyst Warns About What Happens If King Crypto Stays Below $64K
Leading cryptocurrencies remained choppy on Thursday as the countdown to the widely anticipated interest rate cut began.
| Cryptocurrency | Gains +/- | Price (Recorded at 9:30 p.m. EDT) |
| Bitcoin BTC/USD | +0.43% | $57,967.54 |
| Ethereum ETH/USD |
-0.06% | $2,355.29 |
| Dogecoin DOGE/USD | +0.23% | $0.102 |
What Happened: Bitcoin wiggled in the narrow range between $57,700 and $58,400, showing no clear directional bias. Similarly, Ethereum dropped to $2,300 during early trading before clawing back to $2,350 overnight.
The market remained calm, with liquidations reaching just over $63 million in the last 24 hours. Nearly equal numbers of upside and downside bets got wiped out.
Former President Donald Trump announcing the launch date of his cryptocurrency project failed to have any meaningful impact on the market.
Bitcoin’s funding rate was negative on top cryptocurrency exchanges like Binance and Bybit, indicating the dominance of bearishly leveraged traders.
This was further exemplified by the significant dip in the Long/Short Ratio for the cryptocurrency.
Top Gainers (24-Hours)
| Cryptocurrency | Gains +/- | Price (Recorded at 8:30 p.m. EDT) |
| Beam (BEAM) | +9.91% | $0.0143 |
| Quant (QNT) | +9.88% | $77.38 |
| BinaryX (BNX) | +8.75% | $1.65 |
The global cryptocurrency market stood at $2.04 trillion, following an increase of 0.46% in the last 24 hours.
Stocks closed another day in the green. The S&P 500 rose 0.75% to end at 5,595.76. The tech-heavy Nasdaq Composite gained 1% to close at 17,569.68. The Dow Jones Industrial Average lifted 235.06 points, or 0.58%, to finish at 41,096.77.
Investors weighed in August’s producer inflation data, which showed a sharper-than-anticipated slowdown in the headline producer price index while core inflation remained stable.
Thursday’s report followed the consumer price index data, revealing an increase in core prices.
Investors now estimate a 59% chance of a 25-basis-point rate drop at next week’s FOMC meeting, while expectations of an aggressive 50-basis-point rate cut have risen to 41%, according to the CME FedWatch tool.
See More: Best Cryptocurrency Scanners
Analyst Notes: Prominent analytics firm Santiment noted a jump in bullish Bitcoin commentary over the past week, with the ratio of positive mentions more than twice the number of negative for the first time in more than a year.
Santiment interpreted the high FOMO as “concerning,” implying a market peak.
“When the crowd begins conveying doubt again, BTC will truly begin testing its March all-time high market values,” the on-chain researcher said.
Widely-followed cryptocurrency analyst and trader Ali Martinez drew attention to Bitcoin’s extended move below its 200-day moving average.
“BTC has now been below this key level, at $64,000, for over a month, hinting at a potential drop towards its realized price of $31,500!” Martinez projected.
Photo courtesy: Shutterstock
Read Next:
Market News and Data brought to you by Benzinga APIs
© 2024 Benzinga.com. Benzinga does not provide investment advice. All rights reserved.
Stocks Edge Up As Producer Inflation Supports Rate Cut Bets, Small Caps, Miners Rally: What's Driving Markets Thursday?
At midday on Thursday, Wall Street was showing slight gains, with small caps leading the charge. The Russell 2000 index surged 1.2%, outperforming large-cap indices in a notable rebound.
The session kicked off with the release of the August Producer Price Index (PPI), which revealed mixed inflation data, following a slightly hotter-than-expected underlying consumer inflation picture a day earlier.
However, the PPI report had little impact on market expectations surrounding future Federal Reserve rate cuts, with traders fully pricing in a reduction in the fed funds rate next week.
See Also: JPMorgan Warns Anticipated Rate Cuts May Not Significantly Boost Stock Markets
Meanwhile, jobless claims remained largely unchanged from the previous week and in line with forecasts, suggesting stability in the labor market.
Also in line with market expectations, the European Central Bank (ECB) also announced a 25-basis-point cut to the deposit facility rate, lowering it to 3.5%.
The macroeconomic backdrop provided a tailwind for commodities. Gold hit a new all-time high, up 1.7% surpassing $2,550 per ounce, boosting mining stocks.
The VanEck Gold Miners ETF GDX surged 4.3% by midday, marking its strongest session since early March 2024.
Silver prices also saw a strong uptick, rallying 3.8%, which pushed the Global X Silver Miners ETF SIL up by more than 5%, positioning it for its best session since December 2023.
Across the broader commodities complex, oil prices climbed 2.4%, while natural gas spiked 4.5%.
In the cryptocurrency market, Bitcoin BTC/USD was up 1.1%, rebounding after Wednesday’s slight dip.
Thursday’s Performance In Major US Indices, ETFs
| Major Indices | Price | 1-day %chg |
| Russell 2000 | 2,132.34 | 1.2% |
| Nasdaq 100 | 19,340.93 | 0.5% |
| S&P 500 | 5,572.48 | 0.3% |
| Dow Jones | 40,928.03 | 0.2% |
According to Benzinga Pro data:
- The SPDR S&P 500 ETF Trust SPY was 0.4% higher to $557.23.
- The SPDR Dow Jones Industrial Average DIA rose 0.3% to $410.61.
- The tech-heavy Invesco QQQ Trust Series QQQ rose 0.6% to $471.53.
- The iShares Russell 2000 ETF IWM rallied 1.3% to $211.46.
- The Communication Services Select Sector SPDR Fund XLC outperformed, up 1.3%. The Real Estate Select Sector SPDR Fund XLRE was the laggard, down 0.5%.
Thursday’s Stock Movers
- Newmont Corp. NEM soared 4.5% after BNP Paribas raised the price target from $58 to $65.
- Moderna Inc. MRNA plunged over 14% after announcing plans to cut annual R&D spending by approximately $1.1 billion starting in 2027, citing “recent commercial challenges.” The company now projects its 2025 revenue to range between $2.5 billion and $3.5 billion, below analyst expectations of $3.9 billion.
- Medical Properties Trust, Inc MPW rallied by over 17%, fter the medical REIT disclosed a global settlement with tenant Steward Health Care System, its secured lenders, and the Unsecured Creditors Committee.
- Micron Technology Inc. MU fell by about 3.5% after Raymond James lowered its price target on the stock from $160 to $125.
Now Read:
Market News and Data brought to you by Benzinga APIs
© 2024 Benzinga.com. Benzinga does not provide investment advice. All rights reserved.
The Becker Milk Company Limited: Three Month Financial Results and Regular Dividend
TORONTO, Sept. 12, 2024 (GLOBE NEWSWIRE) — The Becker Milk Company Limited (the “Company”) (TSX-BEK.B) is pleased to report the results for the three months ended July 31, 2024.
HIGHLIGHTS
- Total revenues for the three months ended July 31, 2024 were $727,502 compared to $742,639 for the same period in 2023;
- The non-GAAP financial measure Net Operating Income for Q1 fiscal 2025 was $607,453 compared to $583,806 in fiscal 2024;
- Net income for Q1 fiscal 2025 was $0.14 per share for the year, compared to $0.14 net income per share in Q1 fiscal 2024.
FINANCIAL HIGHLIGHTS
Total revenues for the three months ended July 31, 2024 fell $15,137 compared to the three months ended July 31, 2023, a result of reduced finance income.
| Three months ended | ||||||||
| July 31 | ||||||||
| 2024 | 2023 | |||||||
| Property revenue | $679,578 | $669,478 | ||||||
| Finance income | 47,924 | 73,161 | ||||||
| Total revenues | $727,502 | $742,639 | ||||||
| Net income attributable to common and special shareholders | $250,407 | $247,951 | ||||||
| Average common and special shares outstanding | 1,808,360 | 1,808,360 | ||||||
| Income (loss) per share | $0.14 | $0.14 | ||||||
Components of the $2,456 decrease in net income for the three months ended July 31, 2024 compared to the three months ended July 31, 2023 are:
| Changes in Net Income – Three months ended July 31, 2024 | |||||||
| compared to three months ended July 31, 2023 | |||||||
| Provision for environmental liability | |||||||
| Increase in the favourable fair value adjustment | $973,948 | ||||||
| Decrease in current taxes | 55,153 | ||||||
| Increase in net operating income | 23,647 | ||||||
| Decrease in administrative expenses | 1,421 | ||||||
| Decrease in gain on disposal | (2,122 | ) | |||||
| Decrease in finance income | (25,237 | ) | |||||
| Increase in deferred tax charges | (1,024,354 | ) | |||||
| Decrease in net loss | $2,456 | ||||||
Investment property capitalization rates were reduced 25 basis-points or 0.025% during the three months ended July 31, 2024. Compared to the three months ended July 31, 2023 there was a $984,200 favourable change in the fair value adjustment to investment properties.
Non-IFRS financial measures
Net operating income
The non-IFRS financial measure Net Operating Income for the three months ended July 31, 2024 was $607,453, a $23,647 increase compared with the previous year. This increase was the result of improved revenue and reduced operating expenses.
| Three months ended | ||||||||
| July 31 | ||||||||
| 2024 | 2023 | |||||||
| Property revenue | $679,578 | $669,478 | ||||||
| Property operating expenses | (72,125 | ) | (85,672 | ) | ||||
| Net operating income | $607,453 | $583,806 | ||||||
Funds from operations and adjusted funds from operations
For the three months ended July 31, 2024 the Company recorded Adjusted funds from operations of $246,638 ($0.06 per share) compared to $246,390 ($0.14 per share) in 2023.
| Three months ended | |||||||||
| July 31 | |||||||||
| 2024 | 2023 | ||||||||
| Net income | $250,407 | $247,951 | |||||||
| Add (deduct) items not affecting cash: | |||||||||
| Adjustment to fair value of investment properties | (973,948 | ) | – | ||||||
| Gain on sale of investment properties | – | (2,122 | ) | ||||||
| Tax on gains from sale of property | – | 54,736 | |||||||
| Deferred income taxes | 970,179 | (54,175 | ) | ||||||
| Funds from operations | 246,638 | 246,390 | |||||||
| Deduct non-operating items: | |||||||||
| Sustaining capital expenditures | (136,052 | ) | – | ||||||
| Adjusted funds from operations | $110,586 | $246,390 | |||||||
STRATEGIC REVIEW
The Board of Directors continually evaluates strategic directions for the Company and has engaged in discussions with potential acquirers. While the Company has engaged in some discussions within the last year, none of those discussions are active at this time. The Company continues to review its strategic alternatives and will update the market as appropriate, and as required.
DIVIDEND
The Directors of the Company have declared the regular semi-annual dividend on Class B Special and Common Shares of 40 cents per share. This dividend of 40 cents will be paid to those shareholders of record as of September 20, 2024, and payable on September 30, 2024.
The dividends for Canadian tax purposes will be considered as an eligible dividend.
The Company’s interim financial statements for the three months ended July 31, 2024, along with the Management’s Discussion and Analysis will be filed with SEDAR+ at www.sedarplus.ca
Readers are cautioned that although the terms “Net Operating Income”, and “Funds From Operations” are commonly used to measure, compare and explain the operating and financial performance of Canadian real estate companies and such terms are defined in the Management’s Discussion and Analysis, such terms are not recognized terms under Canadian generally accepted accounting principles. Such terms do not necessarily have a standardized meaning and may not be comparable to similarly titled measures presented by the other publicly traded entities.
For the Board of Directors
G.W.J. Pottow, President
Tel: 416-698-2591

Market News and Data brought to you by Benzinga APIs
© 2024 Benzinga.com. Benzinga does not provide investment advice. All rights reserved.
Carnival's Options: A Look at What the Big Money is Thinking
Deep-pocketed investors have adopted a bearish approach towards Carnival CCL, and it’s something market players shouldn’t ignore. Our tracking of public options records at Benzinga unveiled this significant move today. The identity of these investors remains unknown, but such a substantial move in CCL usually suggests something big is about to happen.
We gleaned this information from our observations today when Benzinga’s options scanner highlighted 23 extraordinary options activities for Carnival. This level of activity is out of the ordinary.
The general mood among these heavyweight investors is divided, with 13% leaning bullish and 82% bearish. Among these notable options, 4 are puts, totaling $149,344, and 19 are calls, amounting to $1,203,243.
Projected Price Targets
Analyzing the Volume and Open Interest in these contracts, it seems that the big players have been eyeing a price window from $15.0 to $19.0 for Carnival during the past quarter.
Insights into Volume & Open Interest
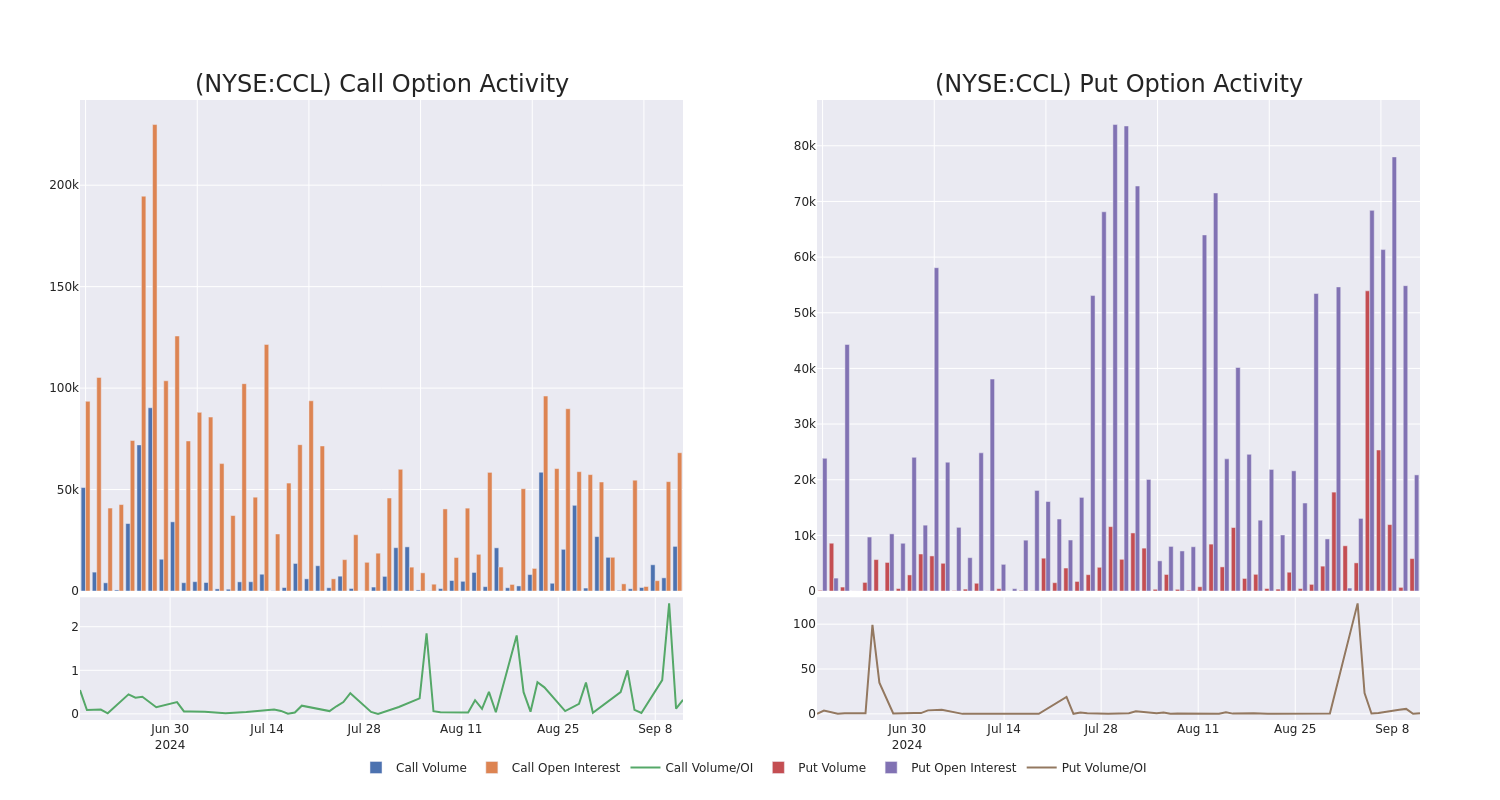
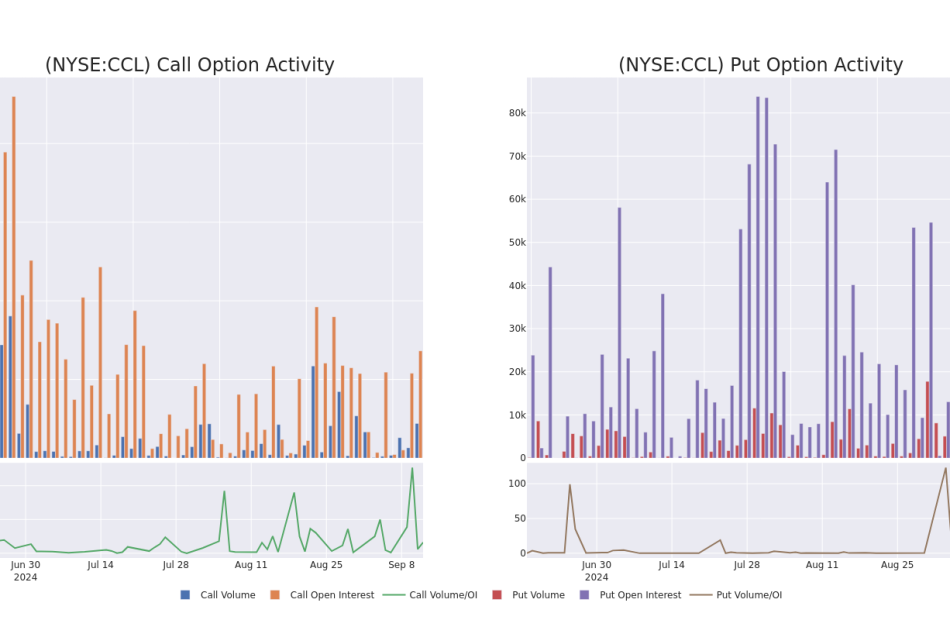
Assessing the volume and open interest is a strategic step in options trading. These metrics shed light on the liquidity and investor interest in Carnival’s options at specified strike prices. The forthcoming data visualizes the fluctuation in volume and open interest for both calls and puts, linked to Carnival’s substantial trades, within a strike price spectrum from $15.0 to $19.0 over the preceding 30 days.
Carnival Option Activity Analysis: Last 30 Days

Significant Options Trades Detected:
| Symbol | PUT/CALL | Trade Type | Sentiment | Exp. Date | Ask | Bid | Price | Strike Price | Total Trade Price | Open Interest | Volume |
|---|---|---|---|---|---|---|---|---|---|---|---|
| CCL | CALL | SWEEP | BEARISH | 04/17/25 | $2.24 | $2.22 | $2.22 | $18.00 | $190.9K | 321 | 141 |
| CCL | CALL | TRADE | BEARISH | 10/18/24 | $0.44 | $0.43 | $0.43 | $19.00 | $171.9K | 26.4K | 7.8K |
| CCL | CALL | TRADE | BULLISH | 10/18/24 | $0.34 | $0.3 | $0.34 | $19.00 | $102.0K | 26.4K | 20 |
| CCL | CALL | TRADE | BEARISH | 09/13/24 | $1.14 | $1.12 | $1.12 | $16.00 | $74.7K | 3.0K | 2.5K |
| CCL | CALL | TRADE | BULLISH | 06/20/25 | $2.98 | $2.98 | $2.98 | $17.00 | $74.5K | 8.8K | 517 |
About Carnival
Carnival is the largest global cruise company, with 92 ships in service at the end of fiscal 2023. Its portfolio of brands includes Carnival Cruise Lines, Holland America, Princess Cruises, and Seabourn in North America; P&O Cruises and Cunard Line in the United Kingdom; Aida in Germany; Costa Cruises in Southern Europe. It’s currently folding its P&O Australia brand into Carnival. The firm also owns Holland America Princess Alaska Tours in Alaska and the Canadian Yukon. Carnival’s brands attracted nearly 13 million guests in 2019, prior to covid-19, a level it reached again in 2023.
Having examined the options trading patterns of Carnival, our attention now turns directly to the company. This shift allows us to delve into its present market position and performance
Current Position of Carnival
- Currently trading with a volume of 27,358,731, the CCL’s price is up by 2.12%, now at $16.89.
- RSI readings suggest the stock is currently may be approaching overbought.
- Anticipated earnings release is in 15 days.
Options trading presents higher risks and potential rewards. Astute traders manage these risks by continually educating themselves, adapting their strategies, monitoring multiple indicators, and keeping a close eye on market movements. Stay informed about the latest Carnival options trades with real-time alerts from Benzinga Pro.
Market News and Data brought to you by Benzinga APIs
© 2024 Benzinga.com. Benzinga does not provide investment advice. All rights reserved.
Producer Inflation Slows To 1.7% Yearly In August, Jobless Claims Align With Expectations
Price pressures faced by U.S. producers eased in August, marking the slowest year-over-year increase since February in data released Thursday.
The headline Producer Price Index (PPI) showed sharper-than-anticipated deceleration, while core inflation remained stable. The report mirrored the pattern of Wednesday’s consumer inflation data.
Additionally, labor market data indicated a small uptick in initial jobless claims, aligning with economist expectations.
August Producer Price Index Report: Key Highlights
- Headline PPI for final demand slowed to 1.7% year-over-year in August, down from a downwardly revised 2.1% in July. This was slightly below economist expectations of 1.8% as tracked by TradingEconomics.
- On a monthly basis, PPI rose 0.2%, surpassing both July’s downwardly revised flat reading and the forecasted 0.1% increase.
- Core PPI (excluding food and energy) held steady at 2.4% year-over-year in August, slightly below market expectations of 2.5%.
- On a month-over-month basis, core PPI rose 0.3%, accelerating from the prior downwardly revised 0.2% contraction and surpassing forecasts of 0.2%.
| PPI Metrics | August 2024 | July 2024 | Consensus (August) |
|---|---|---|---|
| Headline PPI (YoY) | 1.7% | 2.1% | 1.8% |
| Headline PPI (MoM) | 0.2% | 0.0% | 0.1% |
| Core PPI (YoY) | 2.4% | 2.4% | 2.5% |
| Core PPI (MoM) | 0.3% | -0.2% | 0.2% |
Weekly Unemployment Claims Update
- Initial jobless claims increased by 3,000 to a total of 230,000 for the week ending Sept. 7, matching forecasts of 230,000.
- The four-week moving average for jobless claims, which helps smooth out weekly fluctuations, only marginally increased from 230,250 to 230,750.
- Continuing claims – a measure of those remaining on unemployment benefits after their initial filing – increased by 5,000 to 1.85 million, matching projections.
Read Next:
Photo via Shutterstock.
Market News and Data brought to you by Benzinga APIs
© 2024 Benzinga.com. Benzinga does not provide investment advice. All rights reserved.


