The Fed Is Set to Cut Interest Rates — the Time to Be Fearful When Others Are Greedy Has Arrived
For the better part of the last two years, it’s been all systems go for bulls on Wall Street. Since the start of 2023, the iconic Dow Jones Industrial Average (DJINDICES: ^DJI), benchmark S&P 500 (SNPINDEX: ^GSPC), and growth stock-powered Nasdaq Composite (NASDAQINDEX: ^IXIC) are higher by 25%, 47%, and 69%, respectively, as of the closing bell on Sept. 13, 2024, and have all hit multiple record-closing highs this year.
While there’s little question that a resilient U.S. economy, along with investor euphoria surrounding artificial intelligence (AI) and stock splits, have driven equities higher, it’s important to understand that stocks can and do move in both directions.
According to investing great Warren Buffett, “Be fearful when others are greedy. Be greedy when others are fearful.” The time to be fearful has officially arrived for Wall Street and investors.
The Federal Reserve is about to cut interest rates, and that’s historically bad news for stocks
On the surface, things appear to be going swimmingly for the U.S. economy. Gross domestic product is expanding, the unemployment rate is still near historic lows, and the prevailing rate of inflation is inching closer to the Federal Reserve’s long-term target of 2%.
But logic doesn’t always play out as you’d expect on Wall Street.
On the surface, a rising-rate environment would be viewed as bad for businesses and economic growth since it makes borrowing costlier. Conversely, a rate-easing cycle is typically seen as a positive for companies, with lower rates reducing the cost to service debt. But if you take a step back and look at the bigger picture, you’ll often find that the reaction of stocks is opposite to this thought process.
The nation’s central bank doesn’t alter monetary policy on a whim. It typically does so in response to changes in a multitude of economic data points. When the Fed raised its federal funds rate by 525 basis points beginning in March 2022, it did so to keep the U.S. inflation rate from getting out of hand with the U.S. economy firing on all cylinders.
On the other hand, rate-easing cycles are often undertaken by the Fed when one or more data points are amiss with the U.S. economy. The Federal Open Market Committee is widely expected to reduce its federal funds target rate when it meets later this week.
Since this century began, the Federal Reserve has kicked off three rate-easing cycles. Following the start of each cycle, the Dow, S&P 500, and Nasdaq Composite have swooned.
-
Jan. 3, 2001: Beginning in early 2001, the nation’s central bank began a roughly 11-month easing cycle that moved the federal funds rate from 6.5% to 1.75%. Unfortunately, equities didn’t find a bottom during the dot-com bubble until Oct. 9, 2002, some 645 calendar days later.
-
Sept. 18, 2007: With the financial crisis taking shape, the Fed began cutting rates on Sept. 18, 2007. Despite reducing the federal funds rate from 5% to a historically low range of 0%-0.25%, the stock market didn’t bottom until March 9, 2009, which is 538 calendar days after the first rate cut.
-
July 31, 2019: The third rate-easing cycle began shortly before the COVID-19 pandemic took hold. The fed funds rate was quickly chopped from a range of 2%-2.25% to, once again, a historically low range of 0%-0.25%. A total of 236 calendar days elapsed from the first rate cut to market bottom.
During the above rate-easing cycles, the benchmark S&P 500 endured three bear markets that resulted in respective losses of 49%, 57%, and 33% of its value, with the growth-fueled Nasdaq being hit even harder.
What’s more, since this century began, it’s taken an average — I repeat, an average — of 473 calendar days (roughly 15.5 months) following an initial rate cut for the stock market to find its bottom.
Rate-hiking cycles have a history of front-running recessions
In addition to rate-easing cycles leading to poor results for Wall Street, rate-hiking cycles have usually front-run downturns in the U.S. economy.
As you can see in the table below, the nation’s central bank has overseen 13 rate-hiking cycles over the last 70 years.
|
Hiking Cycle |
Total Fed Funds Rate Increase |
Followed by a Recession? |
|---|---|---|
|
Nov. 1954 to Oct. 1957 |
2.70% |
Yes |
|
May 1958 to Nov. 1959 |
3.40% |
Yes |
|
July 1961 to Aug. 1969 |
8% |
Yes |
|
Feb. 1972 to July 1974 |
8.70% |
Yes |
|
Jan. 1977 to April 1980 |
13% |
Yes |
|
July 1980 to Jan. 1981 |
10% |
Yes |
|
Feb. 1982 to Aug. 1984 |
3.10% |
No |
|
Oct. 1986 to March 1989 |
4% |
Yes |
|
Dec. 1993 to April 1995 |
3.10% |
No |
|
Jan. 1999 to June 2000 |
1.90% |
Yes |
|
June 2004 to July 2006 |
4.30% |
Yes |
|
Nov. 2015 to Jan. 2019 |
2.40% |
Yes |
|
Feb. 2022 to July 2023 |
5.25% |
To be determined… |
Data source: Board of Governors of the Federal Reserve. Table by author.
The standout data point from the above table is that 10 of the previous 12 rate-hiking cycles were followed by a U.S. recession. The only exceptions were two increases of 3.1 percentage points in the fed funds rate in 1982-1984 and 1993-1995.
Put another way, any increase above 310 basis points in the federal funds target rate by the Fed since 1954 has eventually (key word!) been followed by a recession. The latest rate-hiking cycle saw the nation’s central bank hike by 525 basis points.
Although the stock market and the U.S. economy aren’t linked at the hip, a shrinking economy does have a strong tendency to adversely impact stock valuations. If the unemployment rate rises and economic activity slows, it’s eventually going to translate into weaker earnings growth, if not a profit plunge, for corporate America.
Historically speaking, roughly two-thirds of the S&P 500’s drawdowns since 1929 have occurred during, not prior to, a U.S. recession.
Be fearful when others are greedy, but maintain perspective
While nothing is guaranteed on Wall Street, the historic correlation between the stock market and rate-hiking/rate-easing cycles would appear to point to meaningful downside to come for equities. Tack on the fact that the stock market has been this pricey on only two other occasions since January 1871, and you have a strong case that a bear market awaits.
Although having a healthy cash position at the ready to take advantage of eventual price dislocations can be a smart move, it’s important to maintain perspective if you’re a long-term investor.
For example, as much as working Americans and investors might dislike recessions, they’re ultimately a normal and inevitable part of the economic cycle. More importantly, they’ve historically resolved quickly. Out of the 12 recessions since the end of World War II, only three lasted at least 12 months, and none surpassed 18 months.
Comparatively, most economic expansions have endured multiple years, with two periods of growth surpassing 10 years. There’s little doubt that optimists have spent far more time in the sun than under gray clouds over the last eight decades.
This same non-linearity to cycles is seen in the stock market.
In June 2023, when the S&P 500 was confirmed to be in a new bull market, the researchers at Bespoke Investment Group released the data set you see above on X, the social platform formerly known as Twitter. Bespoke calculated the calendar-day length of every bear and bull market in the S&P 500, dating back to the start of the Great Depression in September 1929.
Based on Bespoke’s analysis, the average bear market for the S&P 500 has lasted only 286 calendar days, or about 9.5 months, over a 94-year stretch. On the other hand, the typical S&P 500 bull market has endured for 1,011 calendar days, or 3.5 times as long.
You’ll also note that close to half (13 out of 27) of the S&P 500 bull markets have lasted longer than the lengthiest bear market, which stuck around for 630 calendar days, from Jan. 11, 1973, to Oct. 3, 1974.
Although history is quite clear that notable downside is expected for the Dow Jones, S&P 500, and Nasdaq Composite, it’s important to maintain perspective and take a wide-lens approach. Over time, optimism eventually wins out on Wall Street.
Where to invest $1,000 right now
When our analyst team has a stock tip, it can pay to listen. After all, Stock Advisor’s total average return is 755% — a market-crushing outperformance compared to 165% for the S&P 500.*
They just revealed what they believe are the 10 best stocks for investors to buy right now…
*Stock Advisor returns as of September 9, 2024
Sean Williams has no position in any of the stocks mentioned. The Motley Fool has no position in any of the stocks mentioned. The Motley Fool has a disclosure policy.
The Fed Is Set to Cut Interest Rates — the Time to Be Fearful When Others Are Greedy Has Arrived was originally published by The Motley Fool
Move Over, Bank of America! You're No Longer Warren Buffett's Top Dividend Stock — This Company Is…
If you’ve ever wondered why professional and everyday investors pay such close attention to what stocks Berkshire Hathaway (NYSE: BRK.A)(NYSE: BRK.B) CEO Warren Buffett is buying and selling, look no further than his track record. Since taking over as CEO in the mid-1960s, he’s presided over an aggregate return in his company’s Class A shares of almost 5,470,000%, as of the closing bell on Sept. 12.
The Oracle of Omaha’s “recipe” for success has involved buying time-tested businesses with sustainable competitive advantages and hanging onto these investments for extended periods. Core holdings Coca-Cola and American Express, which Buffett’s company has owned since 1988 and 1991, respectively, are perfect examples of brand-name businesses with sustainable moats.
However, dividend stocks have played an equally important role in Buffett’s long-term success. Companies that regularly share a percentage of their profits with investors tend to be profitable on a recurring basis and time-tested.
More importantly, dividend stocks have demonstrably outperformed non-payers over the last half-century. In The Power of Dividends: Past, Present, and Future, the investment advisors at Hartford Funds note that dividend stocks more than doubled up the average annual return of non-payers over the last 50 years (1973-2023): 9.17% vs. 4.27%.
Based on Berkshire Hathaway’s existing portfolio, Buffett and his investment team should oversee the collection of well over $5 billion in dividend income over the next 12 months. But most of this dividend income can be traced back to just a few top holdings.
Although Bank of America (NYSE: BAC) had been Buffett’s top dividend stock, his recent selling activity in the money-center bank has allowed another income stock to take this honor.
Move over, Bank of America: You’re no longer Warren Buffett’s top dividend stock
On July 24, roughly four weeks after the latest round of annual stress tests by the Federal Reserve were published, Bank of America’s board announced plans to increase its quarterly payout by 8% to $0.26 per share, as well as return as much as $25 billion to its shareholders via buybacks. With Berkshire entering the third quarter with more than 1.03 billion shares of BofA in its portfolio, this position alone would have delivered north of $1.07 billion in dividend income over the coming 12 months.
But on July 17, the Oracle of Omaha began hitting the brakes on Bank of America stock and pretty much hasn’t stopped since then. Between July 17 and Sept. 10, a span of 39 trading days, Buffett has been a seller of BofA stock in 27 of these sessions. All told, Berkshire’s stake in Buffett’s once-favorite bank stock has been reduced by close to 174 million shares, as of this writing.
One possible reason behind this selling is Buffett’s desire to lock in gains ahead of an expected rate-easing cycle by the nation’s central bank. No money-center bank is more interest-sensitive than Bank of America. When interest rates decline, its net interest income will feel the pinch more than other large banks.
Buffett might also be selling for tax purposes. He proclaimed during Berkshire Hathaway’s annual shareholder meeting in early May that it’s likely corporate tax rates head higher. Thus, locking in sizable unrealized gains now will, in hindsight, be a smart move.
It’s also possible the Oracle of Omaha simply wants little to do with a historically pricey stock market.
Regardless of the reasons behind his active selling in BofA stock, Berkshire Hathaway still held 858,180,506 shares, as of the closing bell on Sept. 10. With Bank of America doling out a base annual payout of $1.04 per share, this stake would yield a hearty $892,507,726 in dividend income over the next 12 months, assuming no more selling activity.
But $892.5 million isn’t good enough to take the top spot among dividend stocks in Warren Buffett’s portfolio.
The Oracle of Omaha’s top dividend stock will generate almost $904 million each year
The latest round of selling in BofA has vaulted one of Buffett’s favorite stocks to buy over the last two-plus years, energy juggernaut Occidental Petroleum (NYSE: OXY), on to the pedestal in terms of dividend income.
Since 2022 began, Berkshire’s brightest minds have purchased 255,281,524 shares of oil and gas stock Occidental. With Occidental dishing out a $0.22-per-share dividend each quarter, Buffett’s common stock position is expected to generate $224,647,741 in dividend income over the next 12 months.
However, Buffett’s company also holds $8.489 billion in Occidental Petroleum preferred stock that yields 8% annually. This works out to an additional $679,120,000 that, in combination with the income received from Berkshire’s common-stock stake in Occidental, increases the 12-month dividend “haul” to $903,767,741!
One of the primary reasons Buffett can’t stop buying shares of Occidental Petroleum is the belief that the spot price of oil will remain elevated or head even higher. In addition to being an in-demand global resource, the supply of crude oil has been constrained by Russia’s invasion of Ukraine and multiple years of reduced capital spending by global energy majors during the COVID-19 pandemic. When the supply of a key commodity is tight, it’s not uncommon for its price to receive a boost.
Although a higher spot price for crude oil helps all drillers, it’s an outsized positive for Occidental, which generates the lion’s share of its revenue from its upstream drilling operations. If the price of oil rises, Occidental enjoys a greater increase to its operating cash flow than other integrated energy companies. Just be warned that the opposite holds true, too. If the spot price of crude oil declines, Occidental’s operating cash flow can take it on the chin more than other integrated oil and gas operators.
Furthermore, Berkshire Hathaway holds warrants to 83,858,848.81 common shares of Occidental stock that can be exercised at $59.624 per share. It’s in Buffett’s and Berkshire’s best interest that Occidental’s share price remains above this exercise price.
In mid-2017, the Oracle of Omaha exercised warrants to purchase 700 million shares of BofA at just $7.14 per share. When executed, Bank of America’s stock was trading in the neighborhood of $24 per share, which led to a sizable gain for Buffett and his company. He’d love for a repeat of this success with Occidental.
But even if these warrants aren’t exercised, it doesn’t change the fact that Occidental Petroleum is now Warren Buffett’s top dividend stock.
Should you invest $1,000 in Occidental Petroleum right now?
Before you buy stock in Occidental Petroleum, consider this:
The Motley Fool Stock Advisor analyst team just identified what they believe are the 10 best stocks for investors to buy now… and Occidental Petroleum wasn’t one of them. The 10 stocks that made the cut could produce monster returns in the coming years.
Consider when Nvidia made this list on April 15, 2005… if you invested $1,000 at the time of our recommendation, you’d have $729,857!*
Stock Advisor provides investors with an easy-to-follow blueprint for success, including guidance on building a portfolio, regular updates from analysts, and two new stock picks each month. The Stock Advisor service has more than quadrupled the return of S&P 500 since 2002*.
*Stock Advisor returns as of September 9, 2024
American Express and Bank of America are advertising partners of The Ascent, a Motley Fool company. Sean Williams has positions in Bank of America. The Motley Fool has positions in and recommends Bank of America and Berkshire Hathaway. The Motley Fool recommends Occidental Petroleum. The Motley Fool has a disclosure policy.
Move Over, Bank of America! You’re No Longer Warren Buffett’s Top Dividend Stock — This Company Is… was originally published by The Motley Fool
Warren Buffett Is Doing This for the 1st Time in 20 Years. Should Investors Be Worried?
Warren Buffett follows a routine. He gets plenty of sleep each night. He wakes up at the same time each morning. He drinks a can of Coca-Cola to kick off the day. He reads voraciously, including newspapers and companies’ financial reports.
But Buffett is now doing something for the first time in 20 years. And it could be concerning to many investors.
Hoarding cash
It’s not unusual for Buffett to keep a large amount of cash on hand for Berkshire Hathaway (NYSE: BRK.A) (NYSE: BRK.B). The company’s policy is to maintain at least $30 billion in cash, cash equivalents, and U.S. Treasuries.
However, Buffett is currently hoarding cash like never before. Berkshire’s cash position, including cash equivalents and short-term investments, totaled nearly $277 billion as of June 30. That’s the highest level ever.
Granted, Berkshire Hathaway is generating greater earnings than it has in the past. It has more money to sock away. Also, inflation has eroded the buying power of the U.S. dollar so a larger cash position makes sense to some extent.
But there’s another sign that Buffett’s current level of cash stockpiling is unusual. Berkshire’s cash position has increased more than 65% so far in 2024. It grew over 30% in 2023. The last time the conglomerate’s cash, cash equivalents, and U.S. Treasuries rose by 30% or more in back-to-back years was in 2003 and 2004.
Time to worry?
It’s not hard to figure out why Buffett is holding on to so much cash. He prefers to be more heavily invested in stocks but will buy stocks only when they’re attractively valued. The fact that Buffett has built Berkshire’s cash position to such a large level reflects his belief that most stocks are not valued attractively.
Buffett is almost certainly right that many stocks trade at a premium. One of his favorite valuation metrics, known as the Buffett indicator — the ratio of the total U.S. stock market value divided by GDP — is near its all-time high. In 2001, Buffett wrote in a Fortune essay, “[N]early two years ago the ratio rose to an unprecedented level. That should have been a very strong warning signal.”
Should investors worry? I think that’s too strong of a word to use. Buffett’s increase in Berkshire’s cash position by 30% or more in back-to-back years two decades ago didn’t lead to a near-term market meltdown. The S&P 500 rose over the next two years.
Also, the Buffett indicator is arguably less useful now than it was in the past, with technological innovations making it more challenging to accurately assess what their valuations should be. We should note as well that Buffett is still buying some stocks in the current environment.
Follow Buffett’s lead
I think the best thing for investors to do right now is to follow Buffett’s lead. When you find stocks of well-run companies that are available at a reasonable price, buy them. Build a solid cash position if you don’t already have one. Having plenty of dry powder on hand will enable you to buy stocks at a discount when the stock market inevitably pulls back.
Most importantly, maintain a long-term perspective. Buffett’s success is due in large part to his mindset. Thinking long-term is a part of his routine that every investor should adopt.
Should you invest $1,000 in Berkshire Hathaway right now?
Before you buy stock in Berkshire Hathaway, consider this:
The Motley Fool Stock Advisor analyst team just identified what they believe are the 10 best stocks for investors to buy now… and Berkshire Hathaway wasn’t one of them. The 10 stocks that made the cut could produce monster returns in the coming years.
Consider when Nvidia made this list on April 15, 2005… if you invested $1,000 at the time of our recommendation, you’d have $729,857!*
Stock Advisor provides investors with an easy-to-follow blueprint for success, including guidance on building a portfolio, regular updates from analysts, and two new stock picks each month. The Stock Advisor service has more than quadrupled the return of S&P 500 since 2002*.
*Stock Advisor returns as of September 9, 2024
Keith Speights has positions in Berkshire Hathaway. The Motley Fool has positions in and recommends Berkshire Hathaway. The Motley Fool has a disclosure policy.
Warren Buffett Is Doing This for the 1st Time in 20 Years. Should Investors Be Worried? was originally published by The Motley Fool
A Once-in-a-Decade Opportunity: 1 Super Growth Stock Down 70% to Buy and Hold Forever
Typically, value hunting among stocks that have plummeted more than 70% at any given point in their history can be dangerous. History suggests that winning stocks keep winning and that investors would be better off “watering their flowers and digging up their weeds.”
However, there are exceptions to this notion.
Take Paycom (NYSE: PAYC) and its human capital management (HCM) software-as-a-service (SaaS) solutions, for example. The stock is currently 70% off its high. In 2019, the upstart company had sales of roughly $600 million and a share price of around $170. Today, the company’s share price is the same, yet revenue has basically tripled.
This occurrence, paired with Paycom’s resilient free cash flow generation, leaves the company now trading at what could prove to be a once-in-a-decade valuation. While the market remains uncertain about the company’s growth story, here’s the case for buying and holding Paycom forever.
Why Paycom’s current growth slowdown isn’t a doomsday scenario
The primary reason for Paycom’s declining share price comes from its decelerating sales growth rate.
While a slowdown like this is concerning, management has argued that a decent portion of this drop stems from the introduction of its Beti payroll processing platform in late 2021. By empowering employees to manage their own payroll, Beti identifies and fixes many common errors prior to a company processing its payments, reducing the number of payroll reruns needed.
Obviously, this is fantastic for Paycom’s customers, with one client stating that it was able to cut its payroll department by half thanks to Beti’s time-saving value. However, prior to Beti, Paycom generated sales from rerunning payrolls for its customers any time there were errors. In short, the company’s successful new product is cannibalizing an existing base of sales, slowing growth.
Ultimately, investors who think in decades, not quarters, should welcome this trade-off between cannibalizing existing sales and giving customers the best products while keeping them as happy as possible. Thanks to this focus on customer satisfaction, Paycom’s Net Promoter Score (NPS) of 67 easily beats those of its payroll processing peers Paychex, Workday, and ADP, which have respective scores of -14, 31, and -10. A company’s NPS uses a -100 to 100 scale, with a score above 0 showing that more customers would recommend a product to their friends than wouldn’t. This means Paycom’s products are beloved.
Best yet for investors, there were a couple of signs in the company’s second-quarter earnings call signaling that this slowing sales growth could be coming to an end. Founder and CEO Chad Richison said that the company sold 24% more units in Q2 year over year, which is more promising than Paycom’s 9% sales growth in the quarter may indicate. In addition to these promising figures, Richison announced that “July starts are up 40% from a revenue perspective,” showing that higher sales growth could be incoming in the third quarter.
Furthermore, with Beti recently launching in Canada, Mexico, the U.K., and Ireland, Paycom could see further growth ahead as it expands to clients with global operations.
Growing cash generation despite increasing R&D spending
My favorite thing about Paycom is that it remains laser-focused on innovating and keeping its customers as happy as possible. By increasing its spending on research and development (R&D) over time, the company continues to ramp up the automation capabilities across its product suite. Despite this increased R&D spend, Paycom’s free cash flow (FCF) generation has proven to be incredibly resilient.
By delivering automated offerings like GONE, the company’s new time-off requests tool, Paycom has consistently proven that its new offerings generate enough value to offset the cost of the R&D needed to create them. Touching on the value that GONE brings to its clients, the company explained: “Each manual time-off review or approval can cost a company an average of $30.92, according to a November 2023 Ernst & Young study commissioned by Paycom.”
Maintaining its status as a genuine cash cow while increasing spending on R&D makes Paycom a strong candidate to become a top-tier compounder over the long haul.
Paycom’s potential once-in-a-decade valuation
As promising as Paycom’s growth prospects and automated products look, the company continues to trade at a once-in-a-decade low price-to-FCF ratio.
Anchored by a balance sheet that’s home to $346 million in cash and $0 in long-term debt, management has begun buying back shares at these lower prices and now has a $1.5 billion share buyback plan authorized. Compared to the company’s market cap of $9.7 billion, this buyback authorization could go a long way toward helping Paycom’s share price turn around.
Last but not least, Paycom pays a 0.9% dividend, but it has yet to raise it after starting it six quarters ago. While a dividend increase would be nice for investors, management may be more focused on buying back shares at today’s prices.
Ultimately, I think Paycom’s sales growth could be poised to turn around over the next couple of years. This rebound, paired with Paycom’s history of profitably innovating its products, leaves me more than happy to pick up shares at this once-in-a-decade valuation and hold them for the long term.
Should you invest $1,000 in Paycom Software right now?
Before you buy stock in Paycom Software, consider this:
The Motley Fool Stock Advisor analyst team just identified what they believe are the 10 best stocks for investors to buy now… and Paycom Software wasn’t one of them. The 10 stocks that made the cut could produce monster returns in the coming years.
Consider when Nvidia made this list on April 15, 2005… if you invested $1,000 at the time of our recommendation, you’d have $729,857!*
Stock Advisor provides investors with an easy-to-follow blueprint for success, including guidance on building a portfolio, regular updates from analysts, and two new stock picks each month. The Stock Advisor service has more than quadrupled the return of S&P 500 since 2002*.
*Stock Advisor returns as of September 9, 2024
Josh Kohn-Lindquist has positions in Paycom Software. The Motley Fool has positions in and recommends Paycom Software and Workday. The Motley Fool has a disclosure policy.
A Once-in-a-Decade Opportunity: 1 Super Growth Stock Down 70% to Buy and Hold Forever was originally published by The Motley Fool
Bitcoin Slips at Start of Key Week for Markets Awaiting Fed Rate Cut
(Bloomberg) — Bitcoin retreated ahead of a widely expected interest-rate reduction by the Federal Reserve, a looming policy change due later this week that has global markets on edge.
Most Read from Bloomberg
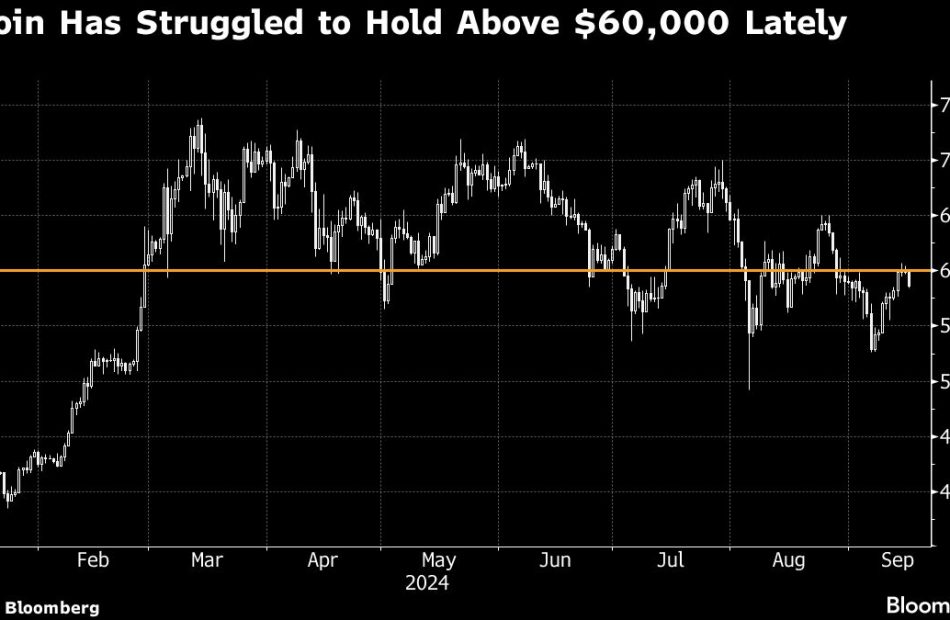
The largest digital asset slid as much as 2.8% on Monday before paring some of the wobble to trade at $58,633 as of 7:03 a.m. in London. Tokens including second-ranked Ether and meme-crowd favorite Dogecoin also nursed losses.
The first US rate cut in more than four years heralds looser financial conditions, typically a positive backdrop for riskier assets such as cryptocurrencies. But investors are uncertain about the magnitude of the move anticipated for Wednesday, as well as how markets will react to updated projections from Fed officials — the so-called dot plot — and Chair Jerome Powell’s briefing.
“The cut is less important than the signaling during the press conference and the release of the updated dot plot,” said Sean McNulty, director of trading at liquidity provider Arbelos Markets. “If the guidance and press conference is significantly dovish, we’d expect Bitcoin to outperform to the topside.”
The latest drop in Bitcoin follows a 10% jump in the seven days through Sunday, the biggest weekly rally since July — that push higher potentially reflected reviving bets on a 50 basis points Fed rate cut. Officials are forecast to lower borrowing costs by at least 25 basis points at the upcoming policy meeting.
In the Bitcoin options market, traders are “pricing a significantly larger event weight than we have seen in recent times” for the Fed meeting, said Caroline Mauron, co-founder of Orbit Markets, a provider of liquidity for trading in digital-asset derivatives.
The monetary policy outlook has become arguably the dominant short-term driver of the cryptocurrency, overshadowing — at least for now — the twists and turns around the US presidential contest.
In the latest election drama, former President Donald Trump was unharmed following another apparent assassination attempt. The Republican nominee’s Secret Service detail opened fire at a man who was wielding an assault rifle at his West Palm Beach, Florida, golf course on Sunday.
Trump has embraced the digital-asset industry in search of donations and votes in a tight contest with Democratic rival Vice President Kamala Harris. His defiant response to an assassination attempt in July spurred a surge in Bitcoin at the time, on speculation that his chances of winning reelection had improved.
Bitcoin reached a record of $73,798 in March, boosted by demand for dedicated US exchange-traded funds. Inflows into the products have since moderated.
Most Read from Bloomberg Businessweek
©2024 Bloomberg L.P.
Watch These Nvidia Price Levels After Stock's Recent Price Swings
Shares Gained Nearly 16% Last Week
Key Takeaways
-
Nvidia shares will likely remain on watchlists Monday after the AI investor darling surged last week as investors snapped up a recent dip in the stock.
-
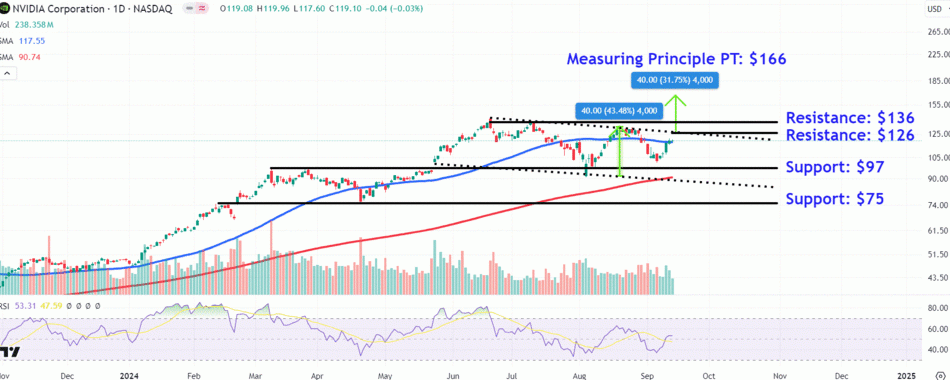
The stock has rallied towards the top trendline of a descending channel, though the move has occurred on lackluster volume, indicating a lack of institutional activity.
-
Investors should monitor key overhead price levels on Nvidia’s chart at $126, $136, and $166, while watching important lower price levels at $97 and $75.
Nvidia (NVDA) shares will likely remain on watchlists Monday after the artificial intelligence (AI)-darling surged last week, as investors snapped up a recent dip in the stock following favorable Wall Street commentary pointing to continuing growth opportunities amid insatiable demand for AI infrastructure.
Last week, the AI chipmaker’s stock gained nearly 16% after dropping around 23% between late August and early September as investors’ optimism towards AI cooled in the wake of the company posting slowing quarterly growth, despite exceeding analysts’ earnings and sales expectations. However, market sentiment received a boost recently after Bernstein analysts called Nvidia “the best way to play AI,” while Bank of America analysts noted earlier this month that the recent pullback provides an “enhanced Buy opportunity.”
Below, we’ll take a close look at Nvidia’s chart and use technical analysis to identify important price levels to watch out for after recent swings in the stock.
Shares Trade Within Descending Channel
Since setting their record high in late June, Nvidia shares have traded within a descending channel, a chart pattern consisting of two parallel downward sloping trendlines that indicates a downtrend in the stock.
More recently, the price has made a move towards the channel’s top trendline, reclaiming the 50-day moving average (MA) in the process.
However, similarly to the August rally, the stock’s latest advance has occurred on lackluster volume, pointing to lack of participation from institutional investors. The stock gained 15.8% last week and closed Friday at $119.10.
Overhead Price Levels to Monitor
The first key area to monitor on the chart sits around $126, where the shares may run into resistance near the descending channel’s top trendline. It’s also worth watching for increasing trading volumes at this level, which may signal a looming breakout above the pattern.
If a breakout does take place, investors should eye the $136 region, a location where sellers may lock in profits near the stock’s June 18 record close, which also closely corresponds with the mid-July swing high.
To forecast a price target above Nvidia’s all-time high (ATH), we can use the measuring principle. To do this, we calculate the distance between the descending channel’s two trendlines and add that amount to the pattern’s upper trendline. For example, we add $40 to $126, which predicts an upside target of $166.
Lower Price Levels to Watch
If Nvidia’s shares move lower from current levels, investors should keep an eye on the $97 region, an area where the shares may encounter support near a horizontal line connecting the March twin peaks with a series of comparable trading levels positioned around last month’s low.
Further selling could lead to a breakdown below the channel’s lower trendline and 200-day MA that may see the stock revisit the $75 area, a location on the chart that would likely attract bargain hunters near the mid-February peak and April trough.
The comments, opinions, and analyses expressed on Investopedia are for informational purposes only. Read our warranty and liability disclaimer for more info.
As of the date this article was written, the author does not own any of the above securities.
Read the original article on Investopedia.
Trump Media Faces $4B Downslide As Shareholders Prepare For Lockup Agreement Expiration
Donald Trump‘s media startup Trump Media & Technology Group Corp. has experienced a substantial depreciation in its value, shedding nearly $4 billion.
What Happened: As the lockup agreement nears its expiration, the company’s major shareholders are gearing up for a possible sell-off. The company, which operates the social media platform Truth Social, has witnessed a loss of approximately $6 billion in value over the last four months.
The stock has plummeted to its lowest level since its initial public offering through a special-purpose acquisition company (SPAC) merger in March.
According to the report by Bloomberg, Trump, who holds about 60% of the company, has seen his stake dwindle to roughly $2.1 billion. Other significant shareholders, including Andy Litinsky and Wes Moss, co-founders of the company, and Patrick Orlando, whose fund facilitated the SPAC merger, have also suffered considerable losses.
With the lockup agreement’s termination on the horizon, investors are expecting a wave of sales from these insiders. However, Trump has asserted that he has no intention of selling his shares. Despite this, the stock experienced a 12% surge following his statement.
Also Read: Can Trump Sell His Truth Social Stock To Pay Bills? His Son Could Be The Answer
The stock of Trump Media has been underperforming, dropping to $17.97 from $40.58 on July 15. Despite reporting second-quarter revenues of less than $1 million, the company’s valuation remains high.
As the lockup period concludes, investors are bracing for potential selling pressure. However, major shareholders may face difficulties in discreetly offloading their holdings.
Why It Matters: The impending lockup expiry has created a sense of uncertainty among the shareholders. The significant drop in the company’s value has raised concerns about the company’s future performance. The situation is further complicated by Trump’s assertion of not selling his shares, which has led to a temporary surge in the stock price.
However, the long-term impact of this decision remains to be seen. The company’s high valuation, despite its underwhelming revenues, is another point of concern for the investors.
As the lockup period ends, the market is likely to witness significant activity, the outcome of which will play a crucial role in shaping the company’s future.
Read Next
Donald Trump’s Billions On Hold As Insiders Sell Off Truth Social Shares
This content was partially produced with the help of AI tools and was reviewed and published by Benzinga editors.
Market News and Data brought to you by Benzinga APIs
© 2024 Benzinga.com. Benzinga does not provide investment advice. All rights reserved.
Coda Octopus, RF Industries And 3 Stocks To Watch Heading Into Monday
With U.S. stock futures trading mixed this morning on Monday, some of the stocks that may grab investor focus today are as follows:
- Wall Street expects Coda Octopus Group, Inc. CODA to report quarterly earnings at 10 cents per share on revenue of $5.42 million before the opening bell, according to data from Benzinga Pro. Coda Octopus shares rose 0.7% to $7.10 in after-hours trading.
- Exicure, Inc. XCUR shares surged in after-hours trading on Friday after the company entered into debt-for-equity exchange agreements and regained Nasdaq compliance. Exicure shares jumped 70% to $2.7205 in the after-hours trading session.
- Analysts are expecting RF Industries, Ltd. RFIL to post quarterly earnings at 6 cents per share on revenue of $17.84 million. The company will release earnings after the markets close. RF Industries shares gained 6.8% to $3.9499 in the after-hours trading session.
Check out our premarket coverage here
- AMREP Corporation AXR reported earnings of 76 cents per share, up from 25 cents per share in the year-ago period. Revenues rose to $19.09 million from $10.29 million. AMREP shares gained 0.9% to $22.00 in the after-hours trading session.
- Analysts expect Vince Holding Corp. VNCE to post a quarterly loss at 25 cents per share on revenue of $68.22 million after the closing bell. Vince Holding shares gained 2.1% to $1.93 in after-hours trading.
Check This Out:
Photo courtesy: Shutterstock
Market News and Data brought to you by Benzinga APIs
© 2024 Benzinga.com. Benzinga does not provide investment advice. All rights reserved.
3 Growth Stocks That Could Skyrocket in 2024 and Beyond
Growth investing requires you to place your money in promising businesses with great long-term potential. You need to pick out companies with proven track records, sustainable tailwinds, and competent management teams.
These stocks should see their share prices rise steadily over time, netting you significant capital gains to help you achieve your retirement dreams. You just need the patience to see your investments grow over the years or even decades.
The technology and software-as-a-service sectors are great places to start looking for businesses that can grow their top and bottom lines and free cash flow. Some of these stocks might be beaten down in the short term due to unmet expectations, making them enticing buys if you can hold through the volatility.
Here are three software companies that I believe could see their share prices soar as they continue to grow.
1. Snowflake
Snowflake (NYSE: SNOW) has a software-as-a-service platform that allows organizations to collate disparate data sets to perform data analytics. The company saw its shares plunge sharply when it released a weak sales outlook for fiscal 2025 and announced the retirement of its CEO, Frank Slootman, who was replaced by Sridhar Ramaswamy, a veteran executive at Alphabet‘s Google.
Investors should look past this dip and be impressed by Snowflake’s steady growth over the years. Revenue more than doubled from $1.2 billion in fiscal 2022 to $2.8 billion in fiscal 2024.
Gross profit did even better, rising from $760.9 million to $1.9 billion over the same period, while its gross margin went up from 62.4% to 68%. Free cash flow improved dramatically over these three years, going from $81.1 million in fiscal 2022 to $778.9 million in fiscal 2024.
The numbers continued to impress for the first half of the current fiscal year. Revenue rose 30.8% year over year to $1.7 billion, while gross profit improved by 30.7% to $1.1 billion. Free cash flow of $390.4 million was up around 11% from a year ago.
The software company’s remaining performance obligations (RPO) climbed by 47% year over year to $5.2 billion, signaling healthy top-line growth in the year ahead. The total customer count jumped 47.8% year over year to 5,231 in the second quarter of 2025, while customers that contributed more than $1 million in product revenue went from 399 to 510 over the same period.
Management believes that its total addressable market of $152 billion as of 2023 will more than double to $342 billion by 2028. This large market size will provide ample opportunities for Snowflake to continue its impressive growth in revenue and free cash flow.
Although its shares have slumped by 40% year to date, they are trading at one of their cheapest price-to-sales ratios at just 11.1, offering a great bargain to investors who have the patience and tenacity to wait for the market to recognize the quality of the business.
2. Salesforce
Salesforce (NYSE: CRM) uses artificial intelligence (AI) to deliver customer relationship management (CRM) analytics, tools, and insights on its platform. The company’s share price has stayed almost flat year to date even as its business continues to improve.
Total revenue climbed from $26.5 billion in fiscal 2022 to $34.9 billion in fiscal 2024. Operating income surged nearly tenfold from $548 million to $5 billion over the same period, while net income nearly tripled from $1.4 billion to $4.1 billion, and free cash flow climbed from $5.3 billion to $9.5 billion.
The company continued its earnings momentum in the first half of the current fiscal year. Revenue rose 9.5% year over year to $18.5 billion, while operating income increased 85% to $3.5 billion. Net income doubled year over year to $3 billion. Free cash flow of $6.8 billion was up 40% year over year.
Salesforce also announced a quarterly dividend of $0.40 per share for an annualized dividend of $1.60. Management projects that its total addressable market will grow 13% annually from 2022 to 2026, reaching $290 billion, giving it ample opportunities to expand its market share.
Earlier this month, the company acquired Own Company, a provider of data protection and management solutions, for approximately $1.9 billion. This purchase is aimed at enhancing the security and availability of customers’ data.
Salesforce also unveiled Agentforce, a suite of autonomous AI agents intended to help employees handle mundane tasks in service, sales, marketing, and commerce. The aim is to help customers improve efficiency with the AI agents analyzing data, making decisions, and optimizing marketing campaigns. These software enhancements should improve customer stickiness and ensure that Salesforce can continue to improve the number of its customers and their spending.
3. UiPath
UiPath (NYSE: PATH) isn’t your typical AI company, but it still helps numerous organizations to work more collaboratively. Its platform provides robotic process automation (RPA) to automate repetitive employee tasks.
Shares were pummeled this year after CEO Rob Enslin resigned abruptly and Daniel Dines was reappointed as the CEO. Because of this corporate shake-up, shares of the RPA company have dropped nearly 50% year to date.
Nonetheless, the business has grown steadily. From fiscal 2022 to fiscal 2024, revenue increased from $892.3 million to $1.3 billion while gross profit increased from $723.4 million to $1.1 billion. The first two of those three fiscal years saw negative free cash flow, but in fiscal 2024, free cash flow turned positive at $291.7 million.
In the first half of fiscal 2025, revenue and free cash flow continued to trend upward. Revenue climbed nearly 13% year over year to $651.4 million with gross profit at $532.8 million, up 10% year over year. Free cash flow rose 32% year over year to $143.8 million. The company recently unveiled new platform features that incorporate generative AI. UiPath Autopilot is meant to help software developers while making tests of that software easier and quicker. These enhancements, along with numerous other features incorporated into the company’s platform, should increase customer loyalty while attracting new clients. As proof, customers with more than $100,000 in annual recurring revenue jumped from 1,930 to 2,163 for its latest quarter.
During UiPath’s 2022 Investor Day, management projected a total addressable market of $93.2 billion. Investors should feel confident about the business’ potential and the chances of better days ahead.
Should you invest $1,000 in Salesforce right now?
Before you buy stock in Salesforce, consider this:
The Motley Fool Stock Advisor analyst team just identified what they believe are the 10 best stocks for investors to buy now… and Salesforce wasn’t one of them. The 10 stocks that made the cut could produce monster returns in the coming years.
Consider when Nvidia made this list on April 15, 2005… if you invested $1,000 at the time of our recommendation, you’d have $729,857!*
Stock Advisor provides investors with an easy-to-follow blueprint for success, including guidance on building a portfolio, regular updates from analysts, and two new stock picks each month. The Stock Advisor service has more than quadrupled the return of S&P 500 since 2002*.
*Stock Advisor returns as of September 9, 2024
Suzanne Frey, an executive at Alphabet, is a member of The Motley Fool’s board of directors. Royston Yang has positions in Alphabet. The Motley Fool has positions in and recommends Alphabet, Salesforce, Snowflake, and UiPath. The Motley Fool has a disclosure policy.
3 Growth Stocks That Could Skyrocket in 2024 and Beyond was originally published by The Motley Fool
Worried About Staggering Tech Valuation? Analyst Says These Stocks Are Poised To Go Higher As Fed Kicks Off 'Rate-Cutting Cycle' This Week
Tech’s extended bull run has more legs to play out, with a key imminent catalyst potentially giving a thrust to the stocks belonging to the sector, according to an analyst at Wedbush.
Fed To Kickstart Risk-On Trade: The Federal Reserve will finally begin to cut interest rates in the current monetary policy cycle. The likely cut will come two-and-a-half years after the first rate hike implemented to curb inflationary pressure that reared its ugly head following the stimulatory measures implemented to offset the impact of the COVID-19 pandemic.
Wedbush’s Daniel Ives said tech investors now look forward to risk-on trade after some nervousness seen in late July. “Despite all the noise and white knuckles, overall tech earnings have been generally robust with Oracle Corp. ORCL, the latest tech stalwart to give more validation that the AI Revolution is starting to quickly move towards the much-awaited software and use case part of the cycle,” he said.
See Also: Best Tech Stocks Right Now
Growth Sweet-spot: The tech supply chain is gearing up for an “unprecedented” period of growth, driven by the massive artificial intelligence capex spending over the next few years, Ives said, basing his view on Asia checks.
The AI revolution, which kickstarted with Nvidia Corp. NVDA, now has ramifications for the broader tech sector, the analyst said, calling the technology the fourth industrial revolution. This revolution is happening across semiconductor, software, infrastructure, internet and smartphones and will likely extend over the next 12 to 18 months, he said.
Nvidia and Microsoft Corp. MSFT are core drivers of AI, and now other tech stocks such as Oracle, ServiceNow, Inc. NOW, Palantir Technologies Inc. PLTR, Salesforce, Inc. CRM, Dell Technologies, Inc. DELL, International Business Machines Corp. IBM, Apple, Inc. AAPL and Advanced Micro Devices, Inc. AMD are joining the party as well, he said.
“We believe the stage is set for tech stocks to move higher into yearend and 2025 in our opinion as the Fed and Powell kick off its rate-cutting cycle this week, macro soft landing remains the path, and tech spending on AI remains a generational spending cycle just starting to hit the shores of the tech sector,” Ives said.
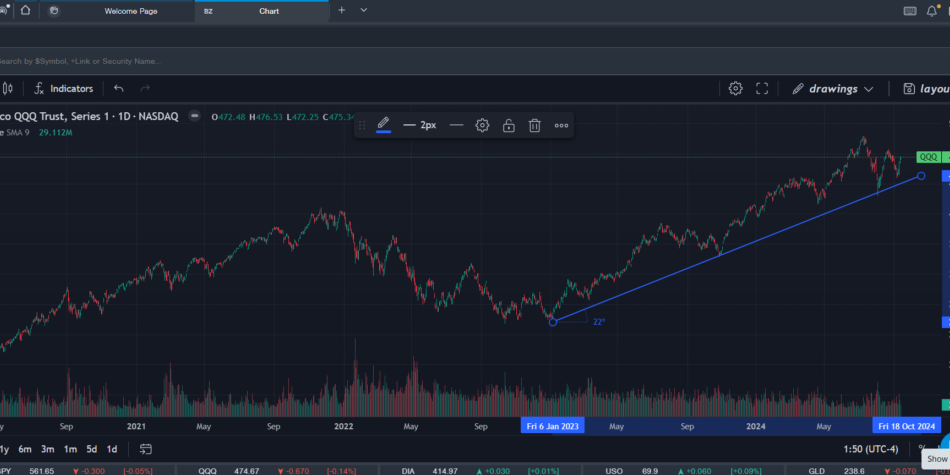
Why It’s Important: The Invesco QQQ Trust QQQ, an exchange-traded fund that tracks the Nasdaq 100 Index, has been on an extended uptrend since the start of 2023. This is despite the hiccup seen since mid-July due to concerns about the lavish capex plans of AI companies.
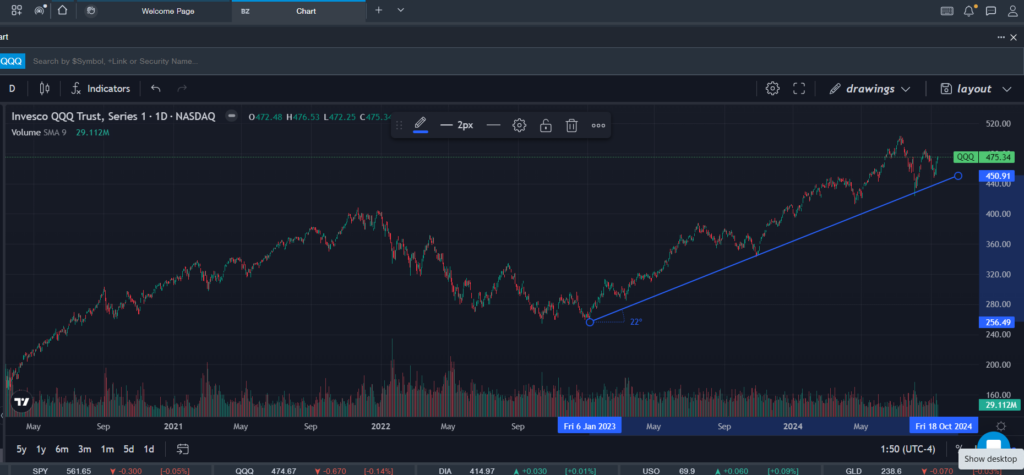
Source: Benzinga Pro data.
The extended run-up introduces caution among investors, given valuations have become stretched. Analysts also see the laggards and leaders switching places when the Fed begins to cut rates, with underperforming interest-rate sensitive small-cap stocks seen as the biggest beneficiaries.
Tech bulls such as Ives see the broadening of the rally rather than one gaining at the expense of the other, given the massive potential AI offers.
The QQQ settled Friday’s session up 0.45% at $475.34, according to Benzinga Pro data. The Technology Select Sector SPDR Fund XLK gained 0.50% to $220.44 and is up about 15% for the year.
Read Next:
Photo by Phongphan on Shutterstock
Market News and Data brought to you by Benzinga APIs
© 2024 Benzinga.com. Benzinga does not provide investment advice. All rights reserved.

