Contact The Gross Law Firm by October 7, 2024 Deadline to Join Class Action Against XPEL, Inc.(XPEL)
NEW YORK, Sept. 18, 2024 (GLOBE NEWSWIRE) — The Gross Law Firm issues the following notice to shareholders of XPEL, Inc. XPEL.
Shareholders who purchased shares of XPEL during the class period listed are encouraged to contact the firm regarding possible lead plaintiff appointment. Appointment as lead plaintiff is not required to partake in any recovery.
CONTACT US HERE:
https://securitiesclasslaw.com/securities/xpel-inc-loss-submission-form/?id=103179&from=3
CLASS PERIOD: November 8, 2023 to May 2, 2024
ALLEGATIONS: The complaint alleges that during the class period, Defendants issued materially false and/or misleading statements and/or failed to disclose that: (i) XPEL’s competitors were siphoning an increasingly large segment of the market; (ii) as a result, the Company’s revenue growth became increasingly dependent upon existing customers and partners; (iii) as a result, the Company’s revenue growth for 2023 and 2024 dwindled; and (iv) as a result, defendants’ positive statements about the Company’s business, operations, and prospects were materially misleading and/or lacked a reasonable basis.
DEADLINE: October 7, 2024 Shareholders should not delay in registering for this class action. Register your information here: https://securitiesclasslaw.com/securities/xpel-inc-loss-submission-form/?id=103179&from=3
NEXT STEPS FOR SHAREHOLDERS: Once you register as a shareholder who purchased shares of XPEL during the timeframe listed above, you will be enrolled in a portfolio monitoring software to provide you with status updates throughout the lifecycle of the case. The deadline to seek to be a lead plaintiff is October 7, 2024. There is no cost or obligation to you to participate in this case.
WHY GROSS LAW FIRM? The Gross Law Firm is a nationally recognized class action law firm, and our mission is to protect the rights of all investors who have suffered as a result of deceit, fraud, and illegal business practices. The Gross Law Firm is committed to ensuring that companies adhere to responsible business practices and engage in good corporate citizenship. The firm seeks recovery on behalf of investors who incurred losses when false and/or misleading statements or the omission of material information by a company lead to artificial inflation of the company’s stock. Attorney advertising. Prior results do not guarantee similar outcomes.
CONTACT:
The Gross Law Firm
15 West 38th Street, 12th floor
New York, NY, 10018
Email: dg@securitiesclasslaw.com
Phone: (646) 453-8903

Market News and Data brought to you by Benzinga APIs
© 2024 Benzinga.com. Benzinga does not provide investment advice. All rights reserved.
MillerKnoll to Report Q1 Earnings: What's in the Cards?
MillerKnoll, Inc. MLKN is set to release its first-quarter fiscal 2025 results on Sept. 19, 2024, after market close.
In the last reported quarter, the company’s earnings topped the Zacks Consensus Estimate by 26.4% and increased 63.4% year over year. Net sales missed the consensus mark by 1.1% and declined 7.1% year over year.
MillerKnoll’s earnings topped the consensus mark in each of the last four quarters, the average surprise being 29.6%.
MLKN’s Estimate Revision Trend
The Zacks Consensus Estimate for the company’s fiscal first-quarter earnings per share has remained unchanged at 42 cents over the past 60 days. The current estimate suggests 13.5% growth from the year-ago quarter’s reported EPS value of 37 cents.
The consensus mark for net sales is $892 million, indicating a 2.8% year-over-year decrease.
Factors to Note For MLKN’s Q1
MillerKnoll’s net sales are expected to have declined year over year in the fiscal first quarter due to a notable decline in sales volume on the back of the soft North American housing market. These ongoing market challenges are particularly evident from the Americas Contract and Global Retail segments’ fiscal fourth-quarter performance.
For the fiscal first quarter, the company also expects net sales between $872 million and $912 million, reflecting a slight year-over-year decline of approximately 2.8% at the midpoint. In the year-ago quarter, the company’s net sales were $917.7 million.
Nonetheless, MillerKnoll has been navigating a challenging market backdrop with improvements in margins and operational efficiency, supported by product innovation and integration synergies from Knoll. The realization of price optimization strategies, improved freight, distribution and inventory management and benefits from its ongoing synergy efforts are likely to have driven margins. MLKN projects an adjusted gross margin within the 39-40% range for the quarter, up from 39% from the previous year.
Adjusted operating expenses are anticipated to be between $291 million and $301 million, down from $302.7 million reported a year ago. The company expects adjusted EPS in the range of 38-44 cents for the quarter, up from 37 cents reported in the year-ago quarter.
What Our Quantitative Model Predicts for MLKN’s Q1
Our proven model does not conclusively predict an earnings beat for MLKN this time around. The combination of a positive Earnings ESP and a Zacks Rank #1 (Strong Buy), 2 (Buy) or 3 (Hold) increases the odds of an earnings beat. But that’s not the case here, as you will see below.
Earnings ESP: The company has an Earnings ESP of 0.00%.
Zacks Rank: MillerKnoll currently carries a Zacks Rank #3.
Peer Releases
Virco Manufacturing Corporation VIRC reported mixed second-quarter fiscal 2024 (ended July 31, 2024) results, wherein earnings surpassed the Zacks Consensus Estimate but sales missed the same.
Going forward, VIRC aims to seek potential acquisition opportunities to expand and strengthen its current business capabilities. Also, along with driving its prospects, Virco expects to add shareholder value through quarterly dividends and share repurchases.
Bassett Furniture Industries, Incorporated BSET reported tepid second-quarter fiscal 2024 (ended June 1, 2024) results, with earnings and net sales missing the Zacks Consensus Estimate and declined year over year.
BSET announced a restructuring plan to better align its cost structure for future growth. This strategy leverages Bassett’s brand quality, design expertise and service. The focus is on driving long-term revenue growth and profitability.
Culp, Inc. CULP reported mixed results in fourth-quarter fiscal 2024 (ended April 28, 2024). Its adjusted loss was narrower than the Zacks Consensus Estimate while net sales marginally missed the same. On a year-over-year basis, net sales declined and the adjusted loss widened.
The quarterly results reflect softness in industry demand for CULP’s reportable businesses due to ongoing macroeconomic headwinds and the timing of orders, due to many larger customers experiencing prolonged conditions beginning in January. Nonetheless, initiatives to lower manufacturing costs and execute operational excellence aided the bottom line to some extent. Culp intends to work on its restructuring plan as it believes this will enable it to grow more efficiently and profitably, with a lower level of fixed costs.
© 2024 Benzinga.com. Benzinga does not provide investment advice. All rights reserved.
Extended Warranty Market to Reach $286.4 billion, Globally, by 2032 at 8.4% CAGR: Allied Market Research
Wilmington, Delaware, Sept. 18, 2024 (GLOBE NEWSWIRE) — Allied Market Research published a report, titled, ”Extended Warranty Market by Sales Type (Point of Sale and After Sale), Coverage (Standard Protection Plan and Accidental Protection Plan), Distribution Channel (Manufacturers, Retailers, and Others), Application (Automobiles, Consumer Electronics, Home Appliances, Mobile Devices and PCs, and Others) and End Users (Individuals and Business): Global Opportunity Analysis and Industry Forecast, 2024-2032“. According to the report, the “extended warranty market” was valued at $129.7 billion in 2022, and is projected to reach $286.4 billion by 2032, growing at a CAGR of 8.4% from 2023 to 2032.
Get Your Sample Report & TOC Today: https://www.alliedmarketresearch.com/request-sample/5022
The extended warranty market is expected to witness notable growth owing to a surge in awareness for extended guarantees for cars, a rise in penetration of laptops, smartphones, and tablets, and rising product complexities. Moreover, the expansion of products and services, electrical vehicles and car warranties, and the untapped potential of emerging economies are expected to provide lucrative opportunities for the growth of the market during the forecast period. On the contrary, the decline in sales of PCs limits the growth of the extended warranty market.
The retailers segment held the highest market share in 2023.
By distribution channel, the retailers segment dominated the market in 2023, This was driven by the strong presence of large retail chains, e-commerce platforms, and electronics stores, which increasingly bundled extended warranties with the sale of high-value consumer goods like electronics, appliances, and automobiles. However, the others segment is expected to witness the largest of CAGR of 9.9%, This growth is driven by several factors, including the increasing demand for product protection, the rising costs of repairs and replacements, and the expansion of independent insurance providers in offering specialized services.
Purchase This Comprehensive Report (PDF with Insights, Charts, Tables, and Figures) @ https://bit.ly/4en0V7T
The automobiles segment held the highest market share in 2023.
By application, the automobiles segment accounted for the largest share in 2023. This dominance can be attributed to several factors, including the rising costs of vehicle repairs and replacements due to the increasing complexity of modern automobiles. With advancements in technology, such as electric vehicles and autonomous driving systems, the demand for extended warranties has surged as consumers seek protection against expensive repairs for high-tech components. However, the mobile devices and PCs segment is expected to witness the largest CAGR of 8.7%. The rapid pace of technological advancements and shorter product life cycles make extended warranties for mobile devices and PCs an appealing choice for consumers who want to safeguard their investments.
Regional Insights: The North America region held the highest market share in 2023.
By region, the extended warranty market was dominated by North America in 2023. This dominance is attributed to the fact that in places such as the U.S. and Canada, the extended warranty has become a more feasible alternative for helping organizations create electronic production. Moreover, companies are increasingly expanding their extended warranty business to the North American region, resulting in market growth.
Get More Information Before Buying: https://www.alliedmarketresearch.com/purchase-enquiry/5022
Players: –
- Endurance Warranty Services Llc
- American International Group Inc.
Key Industry Developments
- In July 2024, iA Financial Group raised a $10 million investment in Canadian business Clutch Technologies Inc. (“Clutch”), which specializes in online sales of pre-owned vehicles. Clutch customers are currently able to purchase iA Financial Group extended warranty and guaranteed asset protection products.
- In August 2024, UK-based Evolution Warranties acquired Autogroup (TAG) Warranties, a move that is set to combine the strengths of both companies in the warranty sector. The acquisition of TAG by Evolution Warranties is expected to leverage the combined expertise and resources of both entities to better serve their customers.
- In May 2021, Extend raised $260 million in a funding round led by SoftBank Group Corp’s (9984.T), opening a new tab Vision Fund 2 that valued the company at over $1 billion. Extend allows companies to add a button to their online markets that gives customers the option to pay extra to protect their purchases.
Access Your Customized Sample Report & TOC Now: https://www.alliedmarketresearch.com/request-for-customization/5022
Key Benefits For Stakeholders
- This report provides a quantitative analysis of the market segments, current trends, estimations, and dynamics of the extended warranty market analysis from 2022 to 2032 to identify the prevailing extended warranty market opportunity.
- The extended warranty market research is offered along with information related to key drivers, restraints, and opportunities.
- Porter’s five forces analysis highlights the potency of buyers and suppliers to enable stakeholders make profit-oriented business decisions and strengthen their supplier-buyer network.
- In-depth analysis of the extended warranty market segmentation assists to determine the prevailing extended warranty market outlook.
- Major countries in each region are mapped according to their revenue contribution to the global extended warranty market.
- Market player positioning facilitates benchmarking and provides a clear understanding of the present position of the market players.
- The report includes the analysis of the regional as well as global extended warranty market trends, key players, market segments, application areas, and market growth strategies.
Extended Warranty Market Key Segments:
By Sales Type
By Coverage
- Standard Protection Plan
- Accidental Protection Plan
By Distribution Channel
By Application
By End-users
By Region
- North America (U.S., Canada)
- Europe (Germany, UK, France, Italy, Spain, Netherlands, Rest of Europe)
- Asia-Pacific (China, Japan, India, South Korea, Australia, Rest of Asia-Pacific)
- LAMEA (Latin America, Middle East, Africa)
Trending Reports in BFSI Industry (Book Now with 10% Discount + Covid-19 scenario):
U.S., Brazil & India Extended Warranty Market Size, Share, Competitive Landscape and Trend Analysis Report, by Coverage, Distribution Channel, End User and Device Type : Opportunity Analysis and Industry Forecast, 2021-2030
Asia-Pacific Extended Warranty Market Size, Share, Competitive Landscape and Trend Analysis Report, by Coverage, by Distribution Channel, by Application, by End User: Opportunity Analysis and Industry Forecast, 2021-2031
UK Extended Warranty Market Size, Share, Competitive Landscape and Trend Analysis Report, by Coverage, By Distribution Channel, By Application, By End users : Country Opportunity Analysis and Industry Forecast, 2023-2032
Italy Extended Warranty Market Size, Share, Competitive Landscape and Trend Analysis Report, by Coverage, by Distribution Channel, by Application, by End User: Opportunity Analysis and Industry Forecast, 2021-2031
North America Extended Warranty Market Size, Share, Competitive Landscape and Trend Analysis Report, by Coverage, by Distribution Channel, by Application, by End User: Opportunity Analysis and Industry Forecast, 2021-2031
About Us:
Allied Market Research (AMR) is a full-service market research and business-consulting wing of Allied Analytics LLP based in Wilmington, Delaware. Allied Market Research provides global enterprises as well as medium and small businesses with unmatched quality of “Market Research Reports Insights” and “Business Intelligence Solutions.” AMR has a targeted view to provide business insights and consulting to assist its clients to make strategic business decisions and achieve sustainable growth in their respective market domain.
We are in professional corporate relations with various companies and this helps us in digging out market data that helps us generate accurate research data tables and confirms utmost accuracy in our market forecasting. Allied Market Research CEO Pawan Kumar is instrumental in inspiring and encouraging everyone associated with the company to maintain high quality of data and help clients in every way possible to achieve success. Each and every data presented in the reports published by us is extracted through primary interviews with top officials from leading companies of domain concerned. Our secondary data procurement methodology includes deep online and offline research and discussion with knowledgeable professionals and analysts in the industry.
Contact:
David Correa
1209 Orange Street,
Corporation Trust Center,
Wilmington,
New Castle,
Delaware 19801 USA.
Int’l: +1-503-894-6022
Toll Free: +1-800-792-5285
UK: +44-845-528-1300
India (Pune): +91-20-66346060
Fax: +1-800-792-5285

© 2024 Benzinga.com. Benzinga does not provide investment advice. All rights reserved.
LANDSEA HOMES CLOSES ON 124 HOMESITES IN CENTRAL FLORIDA, EXPANDING PORTFOLIO IN VOLUSIA AND OSCEOLA COUNTIES
Brach Ranch in St. Cloud and Trinity Gardens in DeLand will feature single-family detached High Performance Homes
ORLANDO, Fla., Sept. 18, 2024 /PRNewswire/ — Landsea Homes Corporation LSEA (“Landsea Homes” or the “Company”), a publicly traded residential homebuilder, today announced it has closed on a total of 124 homesites for two new communities in Central Florida.
The first phase of Brack Ranch in St. Cloud includes 14 single-family detached homes on 50-foot lots ranging from 1,900 to 3,200 square feet of living space. At full buildout, the community will include 138 homes.
The first phase of Trinity Gardens in DeLand will offer 110 homes on 50 and 60-foot lots ranging from 1,635 to 4,418 square feet of living space.
Development is already underway on both communities, and homes are expected to begin selling in Summer 2025.
“Both of these land closings are important steps forward for Landsea Homes as we continue to grow our footprint throughout Central Florida. We are currently seeing high demand for housing in both Volusia and Osceola counties, which are experiencing significant and rapid growth,” said Jeff Wochner, Florida Division President, Landsea Homes. “With these new homes at Brack Ranch and Trinity Gardens, we will be able to help meet some of this demand and provide high-quality, High Performance Homes to eager homebuyers.”
All homes at Brack Ranch and Trinity Gardens will include the company’s renowned High Performance Home features including smart home automation technology utilized by the Apple Home™ to make life at home healthier and more comfortable. The smart home automation technology includes an Apple® HomePod mini™, wireless access point, Wi-Fi enabled entry door locks, thermostat control, garage door opener control, light dimmer switches, a doorbell camera pre-wire, and Smart Home Activation with an individualized in-person training session through Best Buy’s Geek Squad.
Homes will also contain the REME HALO® air purifier, a state-of-the-art product that mitigates indoor contaminants to keep residents safe and support healthy living by reducing airborne particles and air pollutants such as dust, dander, pollen, and mold spores, killing up to 99% of bacteria, allergens, and odor.
Located in Osceola County, St. Cloud is close to Orlando’s bustling downtown district. The city also has one of the highest concentrations of top ranked public schools in Florida and its downtown boasts an extensive array of restaurants, shops and galleries.
DeLand is located in Volusia County, just 40 minutes from downtown Orlando and 30 minutes from Daytona, and easy access to major highways making travel to any Central Florida destination easy. Its wealth of outdoor recreation opportunities, public art displays, and scenic drives make DeLand a prime destination for homebuyers.
Both St. Cloud and DeLand are in proximity to Walt Disney World® Resort, Universal Studios Florida, and SeaWorld® Orlando as well as some of the region’s most beautiful beaches.
Landsea Homes is currently selling at Trinity Place, Sky Lakes Estates and Hanover Lakes, also in St. Cloud as well as at Beresford Woods also in Deland.
To learn more about Landsea Homes’ Florida communities, visit: https://landseahomes.com/florida/
About Landsea Homes Corporation
Landsea Homes Corporation LSEA is a publicly traded residential homebuilder based in Dallas, Texas that designs and builds best-in-class homes and sustainable master-planned communities in some of the nation’s most desirable markets. The company has developed homes and communities in New York, Boston, New Jersey, Arizona, Colorado, Florida, Texas and throughout California in Silicon Valley, Los Angeles, and Orange County. Landsea Homes was honored as the Green Home Builder 2023 Builder of the Year, after being named the 2022 winner of the prestigious Builder of the Year award, presented by BUILDER magazine, in recognition of a historical year of transformation.
An award-winning homebuilder that builds suburban, single-family detached and attached homes, mid-and high-rise properties, and master-planned communities, Landsea Homes is known for creating inspired places that reflect modern living and provides homebuyers the opportunity to “Live in Your Element.” Our homes allow people to live where they want to live, how they want to live – in a home created especially for them.
Driven by a pioneering commitment to sustainability, Landsea Homes’ High Performance Homes are responsibly designed to take advantage of the latest innovations with home automation technology supported by Apple®. Homes include features that make life easier and provide energy savings that allow for more comfortable living at a lower cost through sustainability features that contribute to healthier living for both homeowners and the planet.
Led by a veteran team of industry professionals who boast years of worldwide experience and deep local expertise, Landsea Homes is committed to positively enhancing the lives of our homebuyers, employees, and stakeholders by creating an unparalleled lifestyle experience that is unmatched.
For more information on Landsea Homes, visit: www.landseahomes.com.
![]() View original content to download multimedia:https://www.prnewswire.com/news-releases/landsea-homes-closes-on-124-homesites-in-central-florida-expanding-portfolio-in-volusia-and-osceola-counties-302251205.html
View original content to download multimedia:https://www.prnewswire.com/news-releases/landsea-homes-closes-on-124-homesites-in-central-florida-expanding-portfolio-in-volusia-and-osceola-counties-302251205.html
SOURCE Landsea Homes
© 2024 Benzinga.com. Benzinga does not provide investment advice. All rights reserved.
Wabtec's EPS Estimates Northbound: Time to Buy WAB Stock?
Shares of Pittsburgh, PA-based company Westinghouse Air Brake Technologies Corporation, operating as Wabtec Corporation WAB, have been benefiting from its consistent shareholder-friendly initiatives, as well as strength across its Freight and Transit segments. Bullish full-year 2024 earnings guidance looks encouraging and raises optimism about the stock.
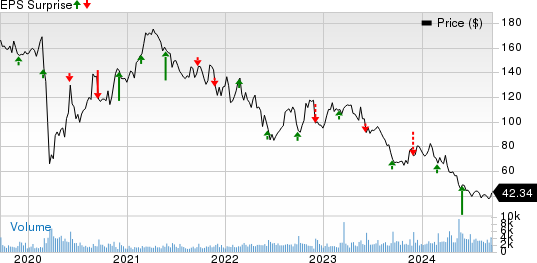
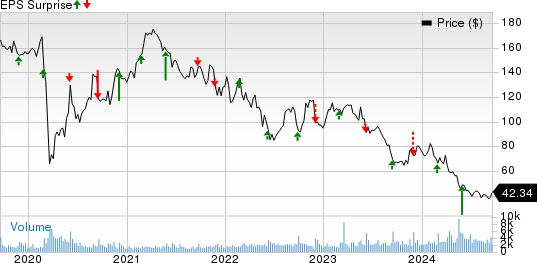
The positive sentiment surrounding WAB stock is evident from the fact that the Zacks Consensus Estimate for the third quarter and full-year 2024 earnings has been revised upward in the past 60 days. The Zacks Consensus Estimate for third-quarter and full-year 2024 earnings per share indicates growth of 9.4% and 26% from the respective 2023 figures.

Image Source: Zacks Investment Research
The company’s long-term (three-to-five years) earnings growth rate is 16.1%, higher than its industry’s 13.4%.
Let’s delve deeper.
Solid Financial Returns for Shareholders
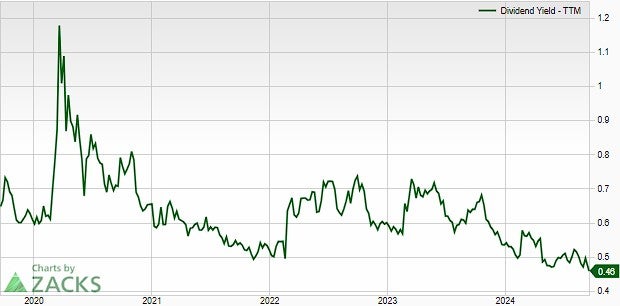
Highlighting its pro-investor stance, Wabtec (on Feb. 14, 2024) announced a 17.6% dividend increase, thereby raising its quarterly cash dividend from 17 cents per share to 20 cents. This quarterly dividend of 20 cents (80 cents annualized) per share gives Wabtec a 0.47% yield at the current stock price. This company’s payout ratio is 11%, with a five-year dividend growth rate of 12.34%.
Dividend-paying stocks provide a solid income stream and have fewer chances of experiencing wild price swings. Dividend stocks, like WAB, are safe bets for creating wealth, as the payouts generally act as a hedge against economic uncertainty like the current scenario.
Segmental Strength Boosts WAB’s Top Line
Wabtec’s top line has been benefiting from higher sales across its Freight and Transit segments. While the Freight segment benefits from growth in services and components, the transit segment gains from strong aftermarket and original equipment manufacturing sales.
WAB is expected to continue its strong performance due to strong underlying demand and a robust backlog.The ongoing summer season is expected to provide a further boost to revenues. The Zacks Consensus Estimate for WAB’s third-quarter and fourth-quarter 2024 revenues is pegged at $2.64 billion and $2.61 billion, which indicates an improvement of 3.6% and 3.2% from 2023’s actuals, respectively.
Driven by this encouraging backdrop, management raised its current-year EPS guidance. Wabtec raised 2024 EPS guidance to the range of $7.20-$7.50 from $7.00-$7.40 guided previously. The Zacks Consensus Estimate of $7.46 lies within the updated guided range.
Wabtec’s full-year revenue guidance remains unchanged in the $10.25 billion-$10.55 billion band. The Zacks Consensus Estimate of $10.39 billion lies within the guided range.
WAB’s Price Performance Soars High
Wabtec has an impressive earnings surprise history. The company’s earnings outpaced the Zacks Consensus Estimate in three of the trailing four quarters (missed the mark in the remaining quarter), delivering an average surprise of 11.83%. Driven by this upbeat earnings performance and the positives mentioned above, WAB shares have gained 37.2% so far this year, outperforming its industry as well as the S&P 500, of which the company is a key member.
Additionally, WAB’s price performance so far this year compares favorably with that of other industry players like Ryder Corporation R and Air Lease Corporation AL.
YTD Price Performance

Image Source: Zacks Investment Research
Some Other Tailwinds Working in Favor of WAB Stock
We are impressed with WAB’s healthy balance sheet. The company’s cash and equivalents increased to $595 million at the end of second-quarter 2024 from $371 million at the end of second-quarter 2023. Meanwhile, the long-term debt level has decreased to $3.5 billion at the end of second-quarter 2024 from $3.4 billion in the second quarter of 2023.
Long-Term Debt to Capitalization

Image Source: Zacks Investment Research
Wrapping Up
Given the positives surrounding the WAB stock, as highlighted throughout the write-up, we believe that investors should add WAB stock to their portfolio for healthy returns. The Zacks Rank #2 (Buy) carried by the stock supports our thesis.
Market News and Data brought to you by Benzinga APIs
© 2024 Benzinga.com. Benzinga does not provide investment advice. All rights reserved.
Coherent Unusual Options Activity
Investors with a lot of money to spend have taken a bullish stance on Coherent COHR.
And retail traders should know.
We noticed this today when the positions showed up on publicly available options history that we track here at Benzinga.
Whether these are institutions or just wealthy individuals, we don’t know. But when something this big happens with COHR, it often means somebody knows something is about to happen.
Today, Benzinga’s options scanner spotted 16 options trades for Coherent.
This isn’t normal.
The overall sentiment of these big-money traders is split between 68% bullish and 31%, bearish.
Out of all of the options we uncovered, there was 1 put, for a total amount of $49,980, and 15, calls, for a total amount of $1,125,050.
Expected Price Movements
Analyzing the Volume and Open Interest in these contracts, it seems that the big players have been eyeing a price window from $60.0 to $110.0 for Coherent during the past quarter.
Insights into Volume & Open Interest
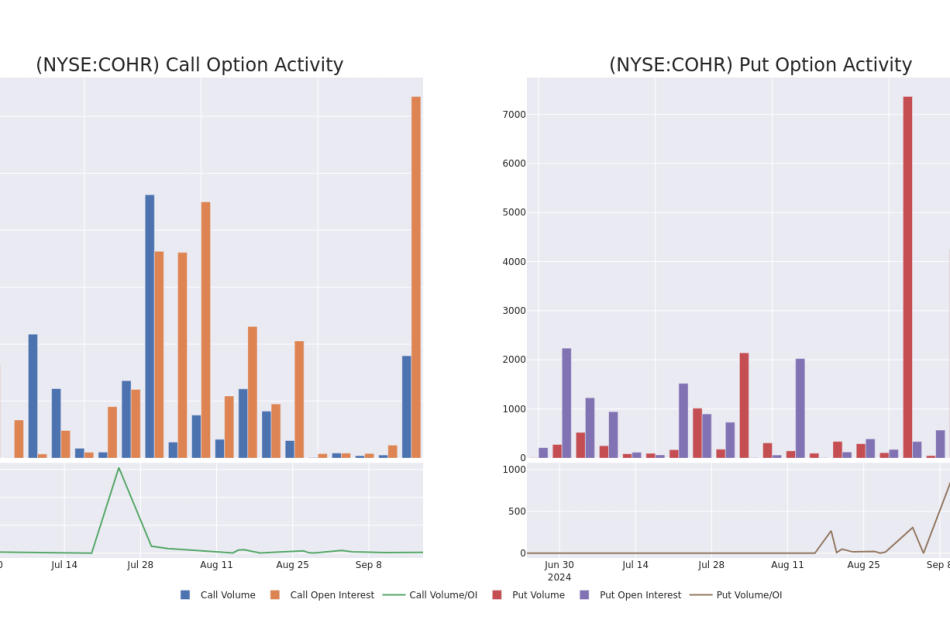
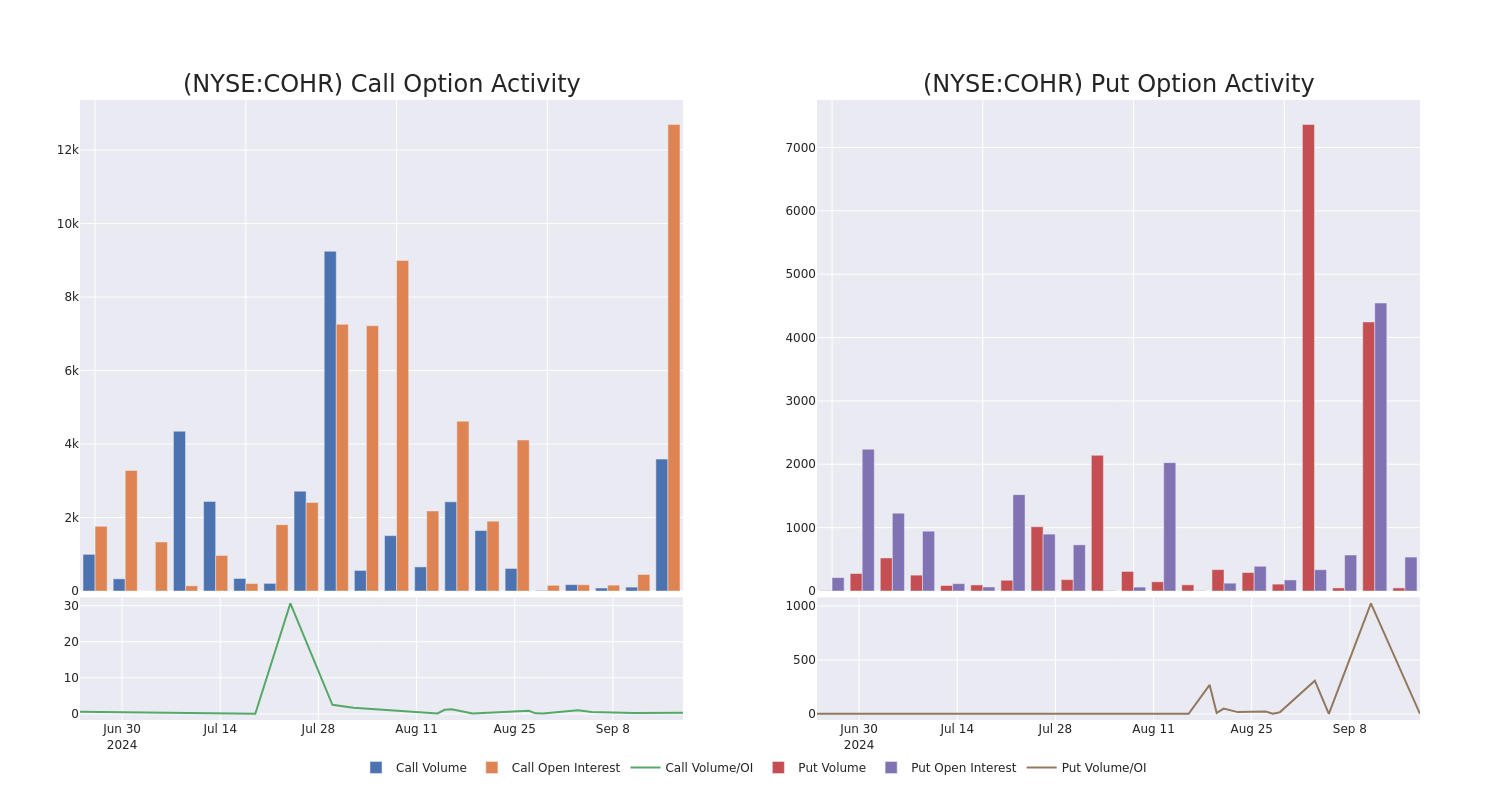
Looking at the volume and open interest is a powerful move while trading options. This data can help you track the liquidity and interest for Coherent’s options for a given strike price. Below, we can observe the evolution of the volume and open interest of calls and puts, respectively, for all of Coherent’s whale trades within a strike price range from $60.0 to $110.0 in the last 30 days.
Coherent Option Volume And Open Interest Over Last 30 Days
Biggest Options Spotted:
| Symbol | PUT/CALL | Trade Type | Sentiment | Exp. Date | Ask | Bid | Price | Strike Price | Total Trade Price | Open Interest | Volume |
|---|---|---|---|---|---|---|---|---|---|---|---|
| COHR | CALL | SWEEP | BULLISH | 04/17/25 | $26.5 | $25.1 | $26.5 | $60.00 | $265.0K | 103 | 0 |
| COHR | CALL | SWEEP | BULLISH | 02/21/25 | $3.6 | $2.9 | $3.5 | $110.00 | $263.7K | 93 | 754 |
| COHR | CALL | SWEEP | BEARISH | 10/18/24 | $4.4 | $4.1 | $4.1 | $80.00 | $82.0K | 4.6K | 207 |
| COHR | CALL | SWEEP | BULLISH | 01/17/25 | $3.6 | $3.5 | $3.6 | $100.00 | $74.9K | 874 | 224 |
| COHR | CALL | SWEEP | BULLISH | 11/15/24 | $10.1 | $10.0 | $10.1 | $75.00 | $50.5K | 788 | 101 |
About Coherent
Coherent Corp engaged in materials, networking, and lasers, is a vertically integrated manufacturing company that develops, manufactures, and markets engineered materials, optoelectronic components and devices, and lasers for use in the industrial, communications, electronics and instrumentation markets. The firm operates in three segments Networking, Materials, and Lasers Segment. It generates maximum revenue from Networking segment. The company geographically operates in North America. Europe, China, Japan and Rest of the world.
Following our analysis of the options activities associated with Coherent, we pivot to a closer look at the company’s own performance.
Current Position of Coherent
- With a volume of 4,787,861, the price of COHR is up 4.16% at $81.16.
- RSI indicators hint that the underlying stock may be approaching overbought.
- Next earnings are expected to be released in 47 days.
Options trading presents higher risks and potential rewards. Astute traders manage these risks by continually educating themselves, adapting their strategies, monitoring multiple indicators, and keeping a close eye on market movements. Stay informed about the latest Coherent options trades with real-time alerts from Benzinga Pro.
Market News and Data brought to you by Benzinga APIs
© 2024 Benzinga.com. Benzinga does not provide investment advice. All rights reserved.
Wind Turbine Market to Reach $115.2 Billion, Globally, by 2033 at 6.2% CAGR: Allied Market Research
Wilmington, Delaware , Sept. 18, 2024 (GLOBE NEWSWIRE) — Allied Market Research published a report, titled, “Wind Turbine Market by Axis Type (Horizontal and Vertical), Installation (Onshore and Offshore), Component (Rotator Blade, Gearbox, Generator, Nacelle and Others), and Application (Industrial, Commercial, Residential and Utility): Global Opportunity Analysis and Industry Forecast, 2024-2033″. According to the report, the wind turbine market was valued at $63.4 billion in 2023, and is estimated to reach $115.2 billion by 2033, growing at a CAGR of 6.2% from 2024 to 2033.
Download PDF Brochure: https://www.alliedmarketresearch.com/request-sample/A00104
Prime determinants of growth
The global wind turbine market is experiencing growth due to increase in adoption of wind energy as a clean, renewable source. However, the initial capital required for wind turbine installation is expected to limit the growth of the wind turbine market during the forecast period. Moreover, innovations in blade design, materials, and aerodynamics offer remunerative opportunities for the global wind turbine market.
Report coverage & details:
| Report Coverage | Details |
| Forecast Period | 2024–2033 |
| Base Year | 2023 |
| Market Size in 2023 | $63.4 billion |
| Market Size in 2033 | $115.2 billion |
| CAGR | 6.2% |
| No. of Pages in Report | 300 |
| Segments Covered | Axis Type, Installation, Component, Application, and Region. |
| Drivers | Adoption of wind energy as a clean, renewable source |
| Integration with smart grids and advancements in energy storage solutions | |
| Opportunities | Innovations in blade design, materials, and aerodynamics |
| Restraints | Variability and dependency of wind turbine on weather conditions |
The vertical segment is expected to remain the largest type throughout the forecast period
Vertical axis wind turbines (VAWTs) have garnered attention for their unique design and potential advantages in certain applications. Unlike traditional horizontal axis wind turbines (HAWTs), which have blades that rotate around a horizontal axis, VAWTs have blades that rotate around a vertical axis. VAWTs are also being explored for off-grid and hybrid energy systems. In remote locations where access to electricity is limited or unreliable, VAWTs can provide a sustainable source of power to meet basic energy needs. They can also be integrated with other renewable energy sources, such as solar panels or batteries, to create hybrid systems that improve overall reliability and efficiency.
Procure Complete Report (300 Pages PDF with Insights, Charts, Tables, and Figures) @ https://www.alliedmarketresearch.com/checkout-final/wind-turbine-market
The onshore segment is expected to lead throughout the forecast period
Onshore wind turbines are a vital component of renewable energy infrastructure, contributing significantly to global efforts to reduce reliance on fossil fuels and combat climate change. These turbines harness the power of wind to generate electricity, making use of vast expanses of land rather than offshore locations. Furthermore, onshore wind turbines often benefit from established infrastructure, such as roads and electrical grids, which can streamline the development process and reduce associated costs. Their proximity to populated areas can also minimize transmission losses, ensuring efficient delivery of electricity to consumers.
The rotator blade segment dominated the wind turbine market throughout the forecast period
The primary function of the rotator blade in wind turbine is to harness the kinetic energy present in the wind and transfer it into rotational motion. As the wind blows, it exerts force on the turbine blades, causing them to rotate around the shaft. This rotational motion is then transmitted through the shaft to the generator, where it is converted into electrical energy. Proper maintenance and monitoring of the rotator are critical to ensuring the continued performance and longevity of the wind turbine. This includes regular inspections to detect any signs of wear or damage, as well as lubrication of moving parts to reduce friction and prevent premature failure.
The utility segment is expected to lead throughout the forecast period.
One of the primary advantages of wind turbines in utility applications is their ability to produce electricity at scale without emitting greenhouse gases or other pollutants associated with conventional power plants. This makes them a crucial tool in combating climate change and reducing reliance on finite fossil fuel resources. Additionally, wind energy is abundant and inexhaustible, providing a reliable source of power that can help stabilize energy markets and enhance energy security.
For Purchase Inquiry: https://www.alliedmarketresearch.com/purchase-enquiry/A00104
Asia-Pacific to maintain its dominance by 2033
The Asia-Pacific region has been rapidly adopting wind energy as a significant component of its renewable energy. China leads the Asia-Pacific region in wind turbine usage, boasting the largest installed capacity in the world. The country’s aggressive investment in wind energy has been driven by both environmental concerns and a desire to reduce dependence on fossil fuels. China’s vast land area, particularly in regions such as Inner Mongolia and Xinjiang, provides ample space for large-scale wind farms, contributing significantly to its renewable energy goals.
India is another key player in the Asia-Pacific wind energy market. The country has made significant strides in recent years to harness its wind resources, particularly along its western coast and in states such as Tamil Nadu and Gujarat. India’s ambitious renewable energy targets, coupled with favorable government policies and incentives, have spurred growth in the wind energy sector, attracting both domestic and international investment.
Players: –
- ENERCON Global GmbH
- Siemens Gamesa Renewable Energy, S.A.U.
- GE VERNOVA
- Goldwind Americas
- Guodian United Power Technology Co., Ltd.
- Mingyang Smart Energy Group Co., Ltd.
- Sinovel Wind Group Co., Ltd.
- Senvion India Pvt. Ltd.
- Suzlon Energy Limited
- Vestas
The report provides a detailed analysis of these key players in the global wind turbine market. These players have adopted different strategies such as new product launches, collaborations, expansion, joint ventures, agreements, and others to increase their market share and maintain dominant shares in different regions. The report is valuable in highlighting business performance, operating segments, product portfolio, and strategic moves of market players to showcase the competitive scenario.
Trending Reports in Industry:
Wind Turbine Transformer Market Opportunity Analysis and Industry Forecast, 2023-2032
Offshore Wind Turbine Market Analysis and Industry Forecast, 2022-2031
Floating Wind Turbine Market Size, Share Analysis and Industry Forecast, 2023-2032
About us:
Allied Market Research (AMR) is a full-service market research and business-consulting wing of Allied Analytics LLP based in Wilmington, Delaware. Allied Market Research provides global enterprises as well as medium and small businesses with unmatched quality of “Market Research Reports” and “Business Intelligence Solutions.” AMR has a targeted view to provide business insights and consulting to assist its clients to make strategic business decisions and achieve sustainable growth in their respective market domain.
We are in professional corporate relations with various companies and this helps us in digging out market data that helps us generate accurate research data tables and confirms utmost accuracy in our market forecasting. Allied Market Research CEO Pawan Kumar is instrumental in inspiring and encouraging everyone associated with the company to maintain high quality of data and help clients in every way possible to achieve success. Each and every data presented in the reports published by us is extracted through primary interviews with top officials from leading companies of domain concerned. Our secondary data procurement methodology includes deep online and offline research and discussion with knowledgeable professionals and analysts in the industry.
Contact us:
David Correa
1209 Orange Street,
Corporation Trust Center,
Wilmington, New Castle,
Delaware 19801 USA.
Int’l: +1-503-894-6022
Toll Free: +1-8007925285
Fax: +1-800-792-5285
Blog: https://www.alliedmarketresearch.com/resource-center/trends-and-outlook/food-and-beverages
Follow Us on | Facebook | LinkedIn | YouTube

© 2024 Benzinga.com. Benzinga does not provide investment advice. All rights reserved.
Cracker Barrel to Report Q4 Earnings: Is a Beat in Store?
Cracker Barrel Old Country Store, Inc. CBRL is scheduled to report fourth-quarter fiscal 2024 results on Sept. 19. In the last reported quarter, CBRL registered an earnings surprise of 57.1%.
Trend in Estimate Revision
The Zacks Consensus Estimate for fiscal fourth-quarter earnings per share is pegged at $1.17, which indicates a deterioration of 34.6% from $1.79 reported in the year-ago quarter.
For revenues, the consensus mark is pegged at $898.8 million, which implies an increase of 7.4% from the year-ago quarter’s reported figure.
Let’s check out the factors that might have influenced CBRL’s performance in the quarter to be reported.
Factors at Play for CBRL
Cracker Barrel’s fiscal fourth-quarter top line is likely to have been aided by menu innovation, higher menu pricing, expansion and other sales-building efforts. Given the growing demand for its breakfast category, including Homestyle Chicken, French Toast, Barrel Bites and beverages, Cracker Barrel introduced its $5 take-home meals at the beginning of fiscal 2024, which is expected to have aided the company’s top line.
The company is also benefiting from growth in off-premise sales. It continues to focus on off-premise initiatives, such as curbside delivery, third-party delivery and family meal baskets. These efforts are likely to have aided the off-premise sales.
Our model predicts Restaurant and Retail revenues to be $715.9 million and $168.2 million, respectively, up 7.9% and 6.9% year over year. However, dismal traffic and same-store sales are expected to have negatively impacted the company’s results. Our model predicts retail same-store sales to decline 0.5% year over year. CBRL’s retail business faces challenges stemming from broader industry pressures, particularly in discretionary categories.
Strategic investments in advertising and labor are likely to have increased costs and exerted margin pressure in the to-be-reported quarter. For fourth-quarter fiscal 2024, our model predicts labor and other related expenses to rise 9% year over year to $332.6 million. We expect store-operating expenses to increase 8.4% year over year to $821.6 million. Our model predicts adjusted-operating income to decline 30.7% year over year to $27.6 million.
What Our Model Says
Our proven model predicts an earnings beat for Cracker Barrel this time around. The combination of a positive Earnings ESP and a Zacks Rank #1 (Strong Buy), 2 (Buy) or 3 (Hold) increases the odds of an earnings beat. This is exactly the case here.
Earnings ESP: Cracker Barrel currently has an Earnings ESP of +2.74%.
Zacks Rank: The company has a Zacks Rank #2 at present.
Other Stocks Poised to Beat on Earnings
Here are some other stocks worth considering from the Zacks Retail-Wholesale sector, as our model shows that these, too, have the right combination of elements to beat on earnings this reporting cycle.
Domino’s Pizza, Inc. DPZ currently has an Earnings ESP of +3.94% and a Zacks Rank #3. Shares of Domino’s have risen 6.4% in the past year. DPZ’s earnings beat the consensus mark in each of the trailing four quarters, delivering an average surprise of 11.2%.
Papa John’s International, Inc. PZZA has an Earnings ESP of +2.11% and a Zacks Rank #3 at present. Shares of Papa John’s have lost 32.9% in the past year. PZZA’s earnings beat the consensus mark in three of the trailing four quarters and missed on one occasion, delivering an average surprise of 13.6%.
Starbucks Corporation SBUX currently has an Earnings ESP of +2.61% and a Zacks Rank #3. Shares of Starbucks have lost 0.5% in the past year. SBUX’s earnings beat the consensus mark in two of the trailing four quarters and missed twice, delivering an average surprise of 1.7%.
Market News and Data brought to you by Benzinga APIs
© 2024 Benzinga.com. Benzinga does not provide investment advice. All rights reserved.
Cryptocurrency Aave Decreases More Than 3% Within 24 hours
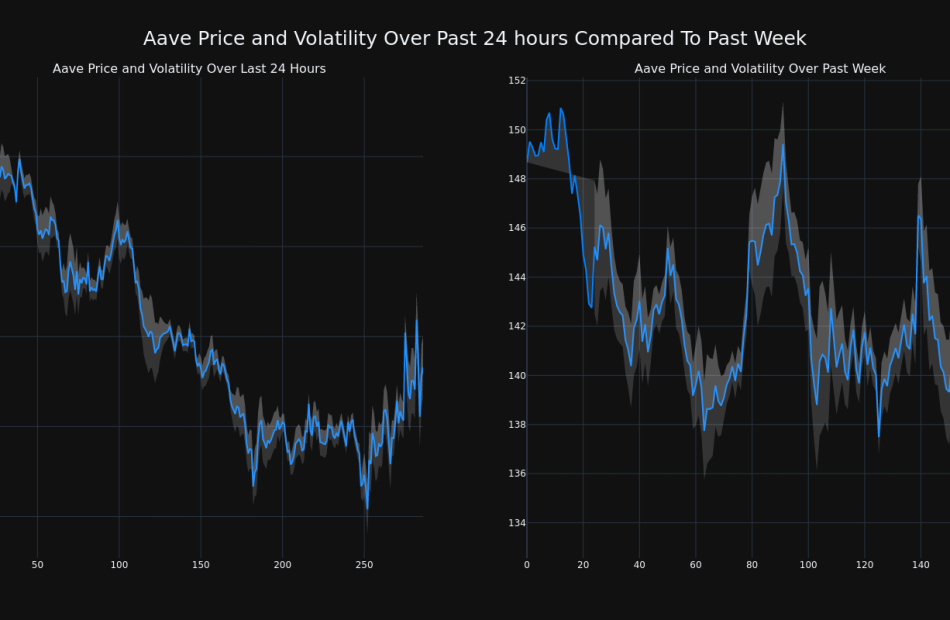
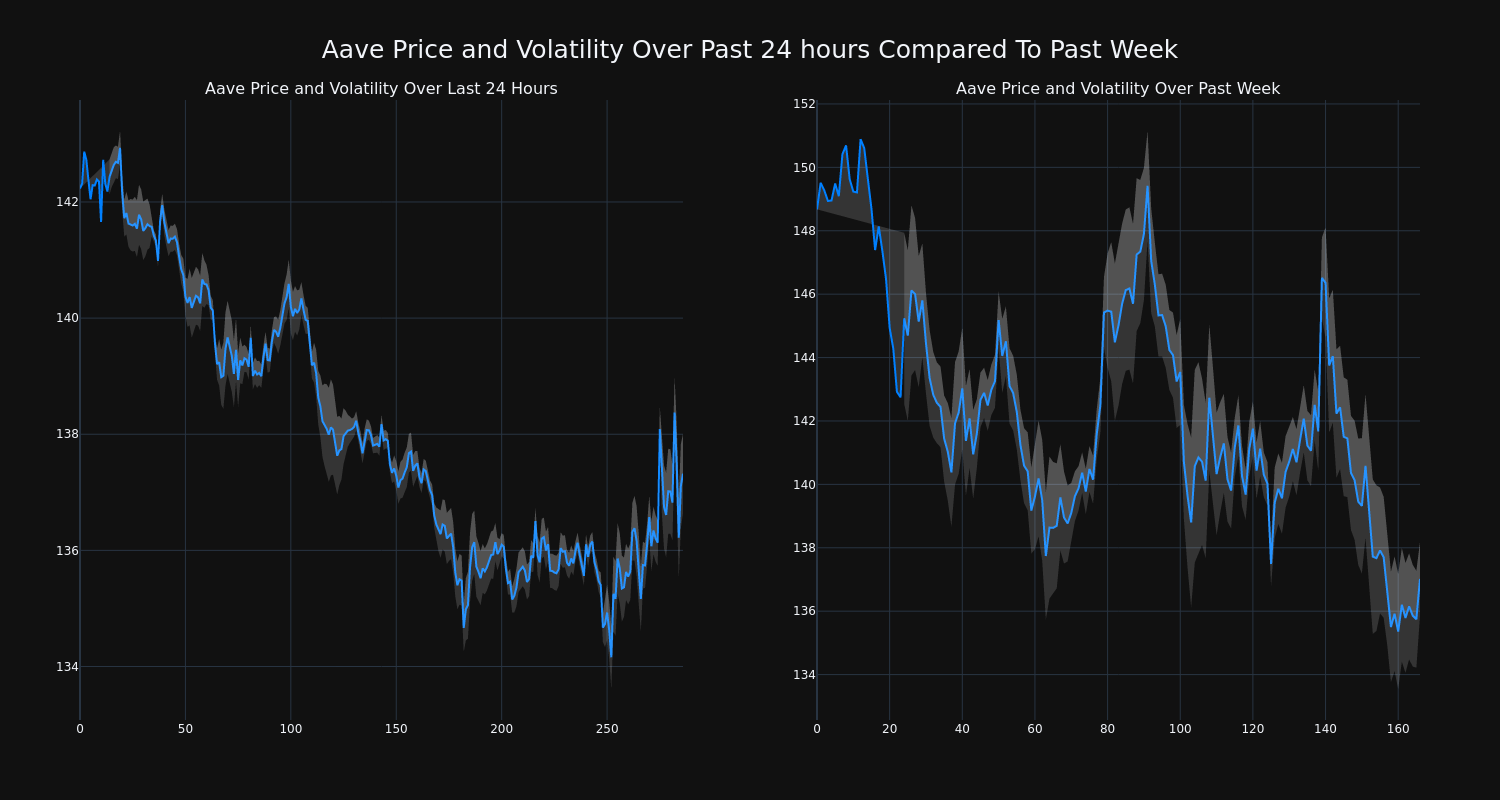
Aave’s AAVE/USD price has decreased 3.38% over the past 24 hours to $137.43, continuing its downward trend over the past week of -8.0%, moving from $148.68 to its current price.
The chart below compares the price movement and volatility for Aave over the past 24 hours (left) to its price movement over the past week (right). The gray bands are Bollinger Bands, measuring the volatility for both the daily and weekly price movements. The wider the bands are, or the larger the gray area is at any given moment, the larger the volatility.
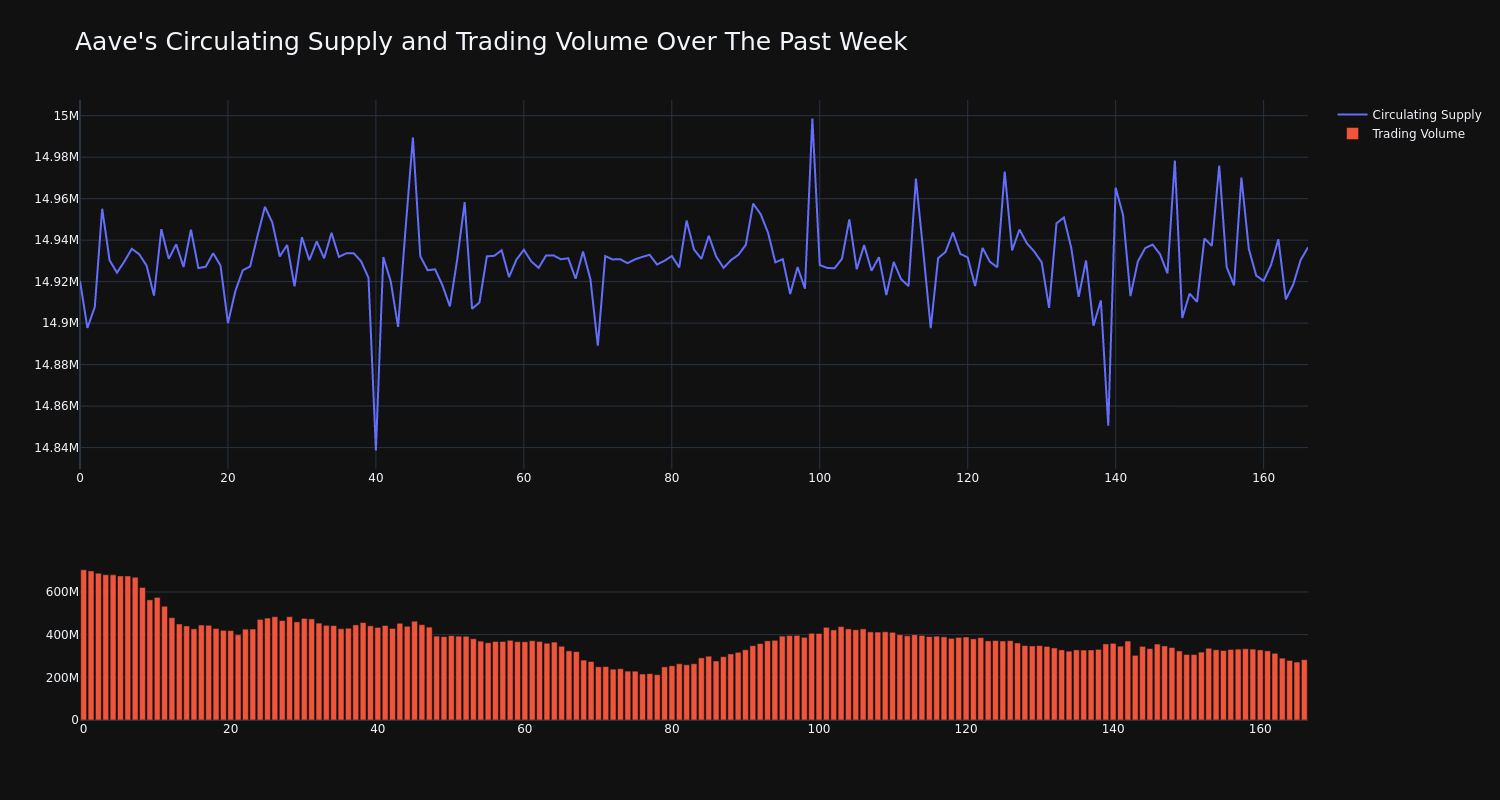
The trading volume for the coin has tumbled 60.0% over the past week while the circulating supply of the coin has risen 0.11%. This brings the circulating supply to 14.93 million, which makes up an estimated 93.33% of its max supply of 16.00 million. According to our data, the current market cap ranking for AAVE is #45 at $2.05 billion.
This article was generated by Benzinga’s automated content engine and reviewed by an editor.
Market News and Data brought to you by Benzinga APIs
© 2024 Benzinga.com. Benzinga does not provide investment advice. All rights reserved.
Bonsai Market to Reach $14.3 Billion, Globally, by 2033 at 10.5% CAGR: Allied Market Research
Wilmington, Delaware , Sept. 18, 2024 (GLOBE NEWSWIRE) — Allied Market Research published a report, titled, “Bonsai Market by Type (Stumps bonsai and Landscape bonsai), and Application (Wholesaler bonsai and Custom made bonsai): Global Opportunity Analysis and Industry Forecast, 2024-2033″. According to the report, the bonsai market was valued at $5.3 billion in 2023, and is estimated to reach $14.3 billion by 2033, growing at a CAGR of 10.5% from 2024 to 2033.
Download PDF Brochure: https://www.alliedmarketresearch.com/request-sample/A324333
Prime determinants of growth
Compact and visually beautiful indoor plants are in high demand among urban dwellers owing to limited space, as urbanization continues to grow. A wider audience is attracted to bonsai due to its increased accessibility due to technological developments in e-commerce and digital education. Bonsai is being promoted as an eco-friendly and sustainable hobby by growing environmental consciousness. The global popularity of bonsai is increased owing to culture and the international exchange of styles and techniques. Furthermore, bonsai cultivation’s therapeutic advantages such as stress relief and mindfulness are emphasized by the health and wellness movement. All these factors contribute to the bonsai market growth and diversity.
Report coverage & details:
| Report Coverage | Details |
| Forecast Period | 2024–2033 |
| Base Year | 2023 |
| Market Size in 2023 | $5.3 billion |
| Market Size in 2033 | $14.3 billion |
| CAGR | 10.5% |
| No. of Pages in Report | 250 |
| Segments Covered | Type, Application, and Region. |
| Drivers | Growing Interest in Gardening and Horticulture |
| Cultural Appreciation and Heritage | |
| Urbanization and Space Constraints | |
| Opportunities | Educational Programs and Workshops |
| Collaborations and Cultural Exchange | |
| Restraints | High Maintenance and Skill Requirement |
| Initial High Cost |
Segment Highlights
By type, the stumps bonsai segment dominated the market with the highest share in 2023. Yamadori bonsai, also known as stump bonsai, is the art of crafting naturally stunted trees from the wild. These trees are typically found in difficult locations where they have acquired distinctive shapes and personalities. The inherent beauty and traditional appearance of the trees make this practice extremely valuable. The authenticity and challenge stumps bonsai pose to cultivators make them highly valued in the bonsai market. However, since sustainable methods are essential to maintaining natural landscapes, ethical issues and legal restrictions surrounding the collection of wild trees are significant. Due to the natural history and artistic potential these trees offer, collectors and artists are driving an increasing demand for stumps bonsai.
Procure Complete Report (250 Pages PDF with Insights, Charts, Tables, and Figures) @ https://www.alliedmarketresearch.com/checkout-final/bonsai-market
By application, the wholesale bonsai segment dominated the market in 2023. The wholesale bonsai market offers a variety of bonsai plants, tools, and supplies in bulk to nurseries, garden centers, and specialized shops. Large-scale distribution is supported by this segment, guaranteeing a consistent supply of common and exotic bonsai species to satisfy a range of customer requirements. Retailers can sustain high-profit margins because wholesale suppliers frequently provide competitive pricing. Important participants in this sector include well-known nurseries with significant growing spaces and importers who procure premium bonsai from countries like as China and Japan. Direct access to wholesale bonsai products is made easier by the growth of e-commerce, which has also streamlined the supply chain and broadened the market. This market segment is essential to maintaining the bonsai market’s overall growth and accessibility.
Regional Outlook
Japan continues to be a global leader in the bonsai market due to its rich cultural heritage and superior handcrafted bonsai, which meet significant demand both domestically and internationally. Growing affluence and a resurgence of interest in traditional arts are driving market expansion in China. The Asia-Pacific region is home to a variety of bonsai traditions, with South Korea and Taiwan leading the way in an expanding sector influenced by regional flora and cultural norms. The growing interest in bonsai is evident in European countries, driven by the European Bonsai Association. Meanwhile, Australia and New Zealand are becoming more popular because of their active community involvement and educational programs.
Players: –
- The Bonsai Company
- Bonsai Design
- Loder Bonsai BV
- Bonsai Network Japan
- Bonsai Outlet
- Bonsai New Zealand
- Fern Valley Bonsai
The report provides a detailed analysis of these key players in the global bonsai market. These players have adopted different strategies such as new product launches, collaborations, expansion, joint ventures, agreements, and others to increase their market share and maintain dominant shares in different regions. The report is valuable in highlighting business performance, operating segments, product portfolio, and strategic moves of market players to showcase the competitive scenario.
For Purchase Inquiry: https://www.alliedmarketresearch.com/purchase-enquiry/A324333
Recent Development:
- In March 2023, the CARLISLE Bonsai Club expanded and brought in new members. After moving to the Harraby Community Centre in the early 1990s, the club is currently working to expand in global markets.
- In May 2023, the Department of Forest and Wildlife of Chandigarh brought together 74 plant species that are up to 35 years old to establish Bonsai World in the Botanical Garden of Sarangpur.
Trending Reports in Industry:
Indoor Foliage Plants Market Size, Share and Trend Analysis Report, 2023-2032
Plant based Diet Market Analysis and Industry Forecast, 2023-2032
Badaam Snack Market Size, Share Analysis and Industry Forecast, 2024-2033
Organic Rice Market Size, Share and Trend Analysis Report, 2023-2032
Bromacil Market Analysis and Industry Forecast Report, 2023 – 2033
About us:
Allied Market Research (AMR) is a full-service market research and business-consulting wing of Allied Analytics LLP based in Wilmington, Delaware. Allied Market Research provides global enterprises as well as medium and small businesses with unmatched quality of “Market Research Reports” and “Business Intelligence Solutions.” AMR has a targeted view to provide business insights and consulting to assist its clients to make strategic business decisions and achieve sustainable growth in their respective market domain.
We are in professional corporate relations with various companies and this helps us in digging out market data that helps us generate accurate research data tables and confirms utmost accuracy in our market forecasting. Allied Market Research CEO Pawan Kumar is instrumental in inspiring and encouraging everyone associated with the company to maintain high quality of data and help clients in every way possible to achieve success. Each and every data presented in the reports published by us is extracted through primary interviews with top officials from leading companies of domain concerned. Our secondary data procurement methodology includes deep online and offline research and discussion with knowledgeable professionals and analysts in the industry.
Contact us:
David Correa
1209 Orange Street,
Corporation Trust Center,
Wilmington, New Castle,
Delaware 19801 USA.
Int’l: +1-503-894-6022
Toll Free: +1-8007925285
Fax: +1-800-792-5285
Blog: https://www.alliedmarketresearch.com/resource-center/trends-and-outlook/food-and-beverages
Follow Us on | Facebook | LinkedIn | YouTube

© 2024 Benzinga.com. Benzinga does not provide investment advice. All rights reserved.


