Broadcom Insider Trades Send A Signal
Hock E Tan, President and CEO at Broadcom AVGO, executed a substantial insider sell on September 19, according to an SEC filing.
What Happened: Tan’s recent Form 4 filing with the U.S. Securities and Exchange Commission on Thursday unveiled the sale of 50,000 shares of Broadcom. The total transaction value is $8,168,550.
Broadcom shares are trading up 0.7% at $168.59 at the time of this writing on Friday morning.
All You Need to Know About Broadcom
Broadcom is the sixth-largest semiconductor company globally and has expanded into various software businesses, with over $30 billion in annual revenue. It sells 17 core semiconductor product lines across wireless, networking, broadband, storage, and industrial markets. It is primarily a fabless designer but holds some manufacturing in-house, like for its best-of-breed FBAR filters that sell into the Apple iPhone. In software, it sells virtualization, infrastructure, and security software to large enterprises, financial institutions, and governments.Broadcom is the product of consolidation. Its businesses are an amalgamation of former companies like legacy Broadcom and Avago Technologies in chips, as well as Brocade, CA Technologies, and Symantec in software.
Broadcom: A Financial Overview
Revenue Growth: Over the 3 months period, Broadcom showcased positive performance, achieving a revenue growth rate of 47.27% as of 31 July, 2024. This reflects a substantial increase in the company’s top-line earnings. As compared to competitors, the company surpassed expectations with a growth rate higher than the average among peers in the Information Technology sector.
Key Profitability Indicators:
-
Gross Margin: The company maintains a high gross margin of 63.92%, indicating strong cost management and profitability compared to its peers.
-
Earnings per Share (EPS): Broadcom’s EPS reflects a decline, falling below the industry average with a current EPS of -0.4.
Debt Management: The company faces challenges in debt management with a debt-to-equity ratio higher than the industry average. With a ratio of 1.07, caution is advised due to increased financial risk.
Understanding Financial Valuation:
-
Price to Earnings (P/E) Ratio: The current Price to Earnings ratio of 135.23 is higher than the industry average, indicating the stock is priced at a premium level according to the market sentiment.
-
Price to Sales (P/S) Ratio: With a higher-than-average P/S ratio of 16.58, Broadcom’s stock is perceived as being overvalued in the market, particularly in relation to sales performance.
-
EV/EBITDA Analysis (Enterprise Value to its Earnings Before Interest, Taxes, Depreciation & Amortization): Boasting an EV/EBITDA ratio of 38.46, Broadcom demonstrates a robust market valuation, outperforming industry benchmarks.
Market Capitalization Analysis: Above industry benchmarks, the company’s market capitalization emphasizes a noteworthy size, indicative of a strong market presence.
Now trade stocks online commission free with Charles Schwab, a trusted and complete investment firm.
Delving Into the Significance of Insider Transactions
Insider transactions should be considered alongside other factors when making investment decisions, as they can offer important insights.
From a legal standpoint, the term “insider” pertains to any officer, director, or beneficial owner holding more than ten percent of a company’s equity securities as outlined in Section 12 of the Securities Exchange Act of 1934. This encompasses executives in the c-suite and significant hedge funds. These insiders are mandated to inform the public of their transactions through a Form 4 filing, to be submitted within two business days of the transaction.
A company insider’s new purchase is a indicator of their positive anticipation for a rise in the stock.
While insider sells may not necessarily reflect a bearish view and can be motivated by various factors.
Deciphering Transaction Codes in Insider Filings
When it comes to transactions, investors tend to focus on those in the open market, detailed in Table I of the Form 4 filing. A P in Box 3 denotes a purchase, while S indicates a sale. Transaction code C signals the conversion of an option, and transaction code A denotes a grant, award, or other acquisition of securities from the company.
Check Out The Full List Of Broadcom’s Insider Trades.
Insider Buying Alert: Profit from C-Suite Moves
Benzinga Edge reveals every insider trade in real-time. Don’t miss the next big stock move driven by insider confidence. Unlock this ultimate sentiment indicator now. Click here for access.
This article was generated by Benzinga’s automated content engine and reviewed by an editor.
Market News and Data brought to you by Benzinga APIs
© 2024 Benzinga.com. Benzinga does not provide investment advice. All rights reserved.
Unpacking the Latest Options Trading Trends in Carvana
Financial giants have made a conspicuous bullish move on Carvana. Our analysis of options history for Carvana CVNA revealed 24 unusual trades.
Delving into the details, we found 62% of traders were bullish, while 25% showed bearish tendencies. Out of all the trades we spotted, 12 were puts, with a value of $609,015, and 12 were calls, valued at $2,048,631.
Expected Price Movements
Based on the trading activity, it appears that the significant investors are aiming for a price territory stretching from $70.0 to $250.0 for Carvana over the recent three months.
Volume & Open Interest Development
Looking at the volume and open interest is an insightful way to conduct due diligence on a stock.
This data can help you track the liquidity and interest for Carvana’s options for a given strike price.
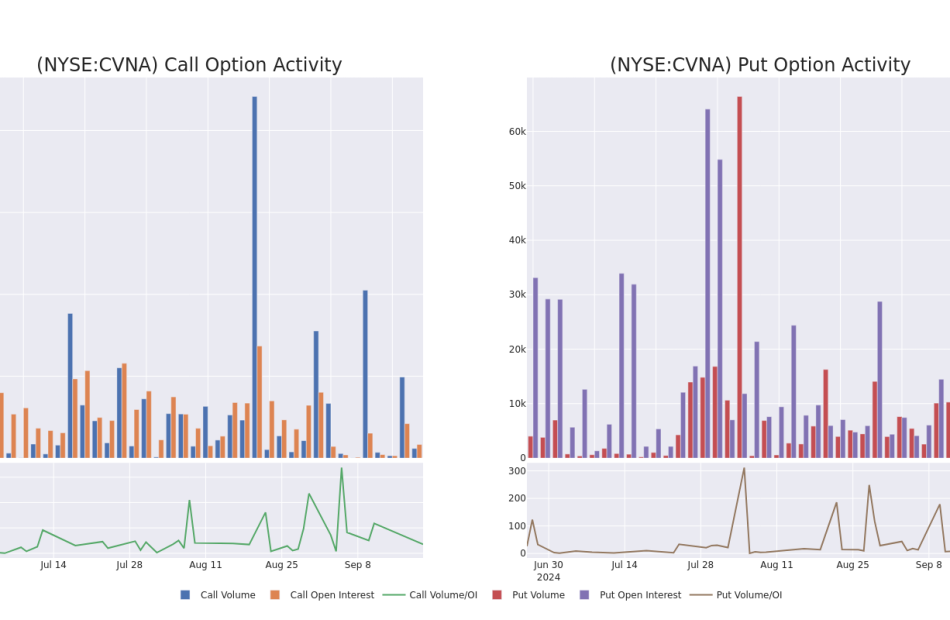
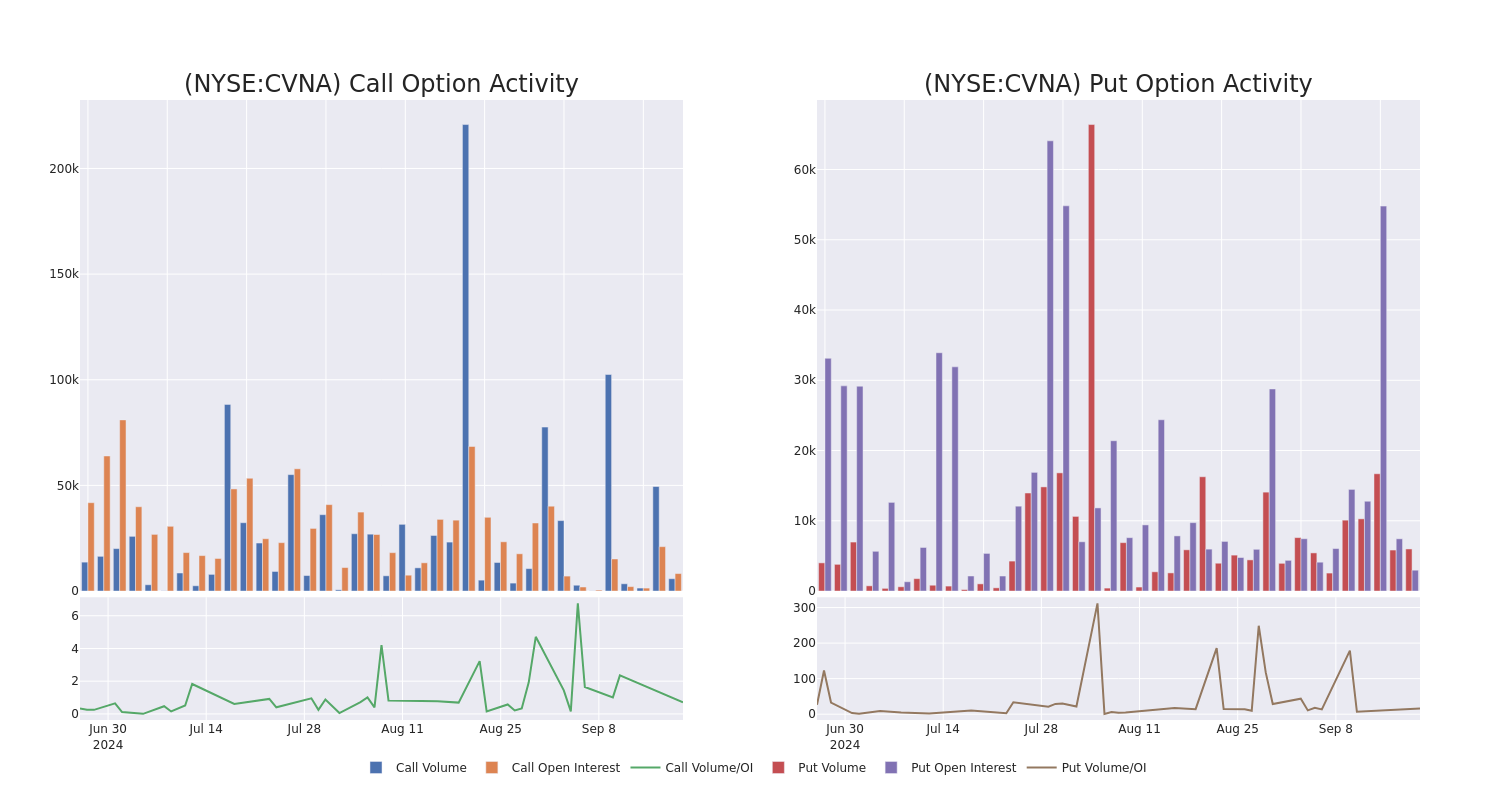
Below, we can observe the evolution of the volume and open interest of calls and puts, respectively, for all of Carvana’s whale activity within a strike price range from $70.0 to $250.0 in the last 30 days.
Carvana 30-Day Option Volume & Interest Snapshot
Largest Options Trades Observed:
| Symbol | PUT/CALL | Trade Type | Sentiment | Exp. Date | Ask | Bid | Price | Strike Price | Total Trade Price | Open Interest | Volume |
|---|---|---|---|---|---|---|---|---|---|---|---|
| CVNA | CALL | SWEEP | BULLISH | 09/27/24 | $26.9 | $24.35 | $26.67 | $146.00 | $1.3M | 3.8K | 3.0K |
| CVNA | CALL | SWEEP | BULLISH | 12/20/24 | $69.4 | $68.05 | $69.4 | $105.00 | $138.8K | 20 | 0 |
| CVNA | CALL | SWEEP | BEARISH | 09/27/24 | $2.24 | $2.03 | $2.04 | $180.00 | $102.5K | 619 | 1.6K |
| CVNA | CALL | SWEEP | BULLISH | 11/15/24 | $72.5 | $71.4 | $72.5 | $100.00 | $94.2K | 222 | 0 |
| CVNA | CALL | TRADE | NEUTRAL | 10/04/24 | $20.2 | $18.35 | $19.14 | $155.00 | $78.4K | 2.2K | 1.0K |
About Carvana
Carvana Co is an e-commerce platform for buying and selling used cars. The company derives revenue from used vehicle sales, wholesale vehicle sales and other sales and revenues. The other sales and revenues include sales of loans originated and sold in securitization transactions or to financing partners, commissions received on VSCs and sales of GAP waiver coverage. The foundation of the business is retail vehicle unit sales. This drives the majority of the revenue and allows the company to capture additional revenue streams associated with financing, VSCs, auto insurance and GAP waiver coverage, as well as trade-in vehicles.
Carvana’s Current Market Status
- With a volume of 5,365,127, the price of CVNA is up 1.65% at $173.56.
- RSI indicators hint that the underlying stock may be approaching overbought.
- Next earnings are expected to be released in 41 days.
What Analysts Are Saying About Carvana
Over the past month, 4 industry analysts have shared their insights on this stock, proposing an average target price of $183.0.
Turn $1000 into $1270 in just 20 days?
20-year pro options trader reveals his one-line chart technique that shows when to buy and sell. Copy his trades, which have had averaged a 27% profit every 20 days. Click here for access.
* In a cautious move, an analyst from B of A Securities downgraded its rating to Buy, setting a price target of $185.
* An analyst from Evercore ISI Group has decided to maintain their In-Line rating on Carvana, which currently sits at a price target of $157.
* An analyst from JMP Securities has revised its rating downward to Market Outperform, adjusting the price target to $200.
* An analyst from Stephens & Co. downgraded its action to Overweight with a price target of $190.
Options trading presents higher risks and potential rewards. Astute traders manage these risks by continually educating themselves, adapting their strategies, monitoring multiple indicators, and keeping a close eye on market movements. Stay informed about the latest Carvana options trades with real-time alerts from Benzinga Pro.
Market News and Data brought to you by Benzinga APIs
© 2024 Benzinga.com. Benzinga does not provide investment advice. All rights reserved.
Prediction: This $80 Billion Market Could Be the Next Big Growth Driver for Nvidia Stock
Graphics processing units (GPUs) have been Nvidia‘s (NASDAQ: NVDA) bread-and-butter business for a long, long time. The company initially made its name producing GPUs meant for deployment in personal computers (PCs) for gaming and content creation, before eventually striking gold with its data center GPUs that are now in red-hot demand thanks to artificial intelligence (AI).
As it turns out, data center compute chips now produce the majority of Nvidia’s revenue. The company sold $22.6 billion worth of data center GPUs in the second quarter of fiscal 2025 (which ended on July 28). The segment’s revenue shot up 162% year over year, accounting for 75% of the company’s top line. However, there is another niche within the data center business where Nvidia is now gaining impressive traction.
This particular business segment is now bigger than Nvidia’s gaming business, and it could turn out to be a key growth driver for the company in the long run. Here’s a closer look at this emerging business that could supercharge Nvidia’s growth.
Nvidia is making terrific progress in this $80 billion market
Nvidia sells two types of data center chips. The first are the GPUs, which are already generating several billion dollars in revenue for the company each quarter. The second type of Nvidia’s data center chips is its networking chips, which are also selling like hotcakes as the company’s latest quarterly results show.
Nvidia sold $3.7 billion worth of networking chips in the previous quarter, up 114% from the same quarter last year. The company’s networking revenue in the first half of the fiscal year stood at $6.8 billion, translating into an annual revenue run rate of nearly $14 billion. The global data center networking market is estimated to generate $37.6 billion in revenue this year. If Nvidia indeed ends fiscal 2025 with $14 billion in data center networking revenue, it would end up controlling 37% of this market.
What’s worth noting here is that Nvidia is reportedly growing at a faster pace than the data center networking space, which has received a major shot in the arm thanks to the advent of AI. According to market research firm Dell’Oro Group, the size of the data center switching market is likely to expand by 50% thanks to the growing need for switches deployed in back-end AI server networks.
The researcher sees spending on switches used in back-end AI servers hitting $80 billion over the next five years, which would be nearly double the size of the current data center switch market. We have already seen that Nvidia is enjoying a solid share of this market, and Dell’Oro points out the same. The research firm says that the InfiniBand networking platform is currently dominating the market for AI back-end networks, and it is worth noting that Nvidia offers networking products based on this networking communications standard.
Nvidia sells InfiniBand adapters, switches, data processing units (DPUs), routers, gateways, cables, and transceivers to customers. Dell’Oro, however, points out that the Ethernet-based networking standard could eventually overtake the InfiniBand standard in the next few years. The good news for Nvidia investors is that Nvidia has already set its sights on the Ethernet AI networking platform.
It claims that its Spectrum-X networking platform is the world’s first Ethernet networking platform for AI and is capable of accelerating AI networking performance by 1.6x when compared to traditional Ethernet. Nvidia management’s comments on the August earnings conference call suggest that Spectrum-X has gained terrific traction among customers. According to CFO Colette Kress: “Ethernet for AI revenue, which includes our Spectrum-X end-to-end Ethernet platform, doubled sequentially with hundreds of customers adopting our Ethernet offerings. Spectrum-X has broad market support from OEM and ODM partners and is being adopted by CSPs, GPU cloud providers, and enterprises, including xAI to connect the largest GPU compute cluster in the world.”
A new multibillion-dollar business in the making
Kress says that Spectrum-X is “well on track to begin a multibillion-dollar product line within a year.” So, it won’t be surprising to see Nvidia eventually cornering a sizable portion of the data center networking market. The rate of growth of Nvidia’s networking business means it is growing at a faster pace than the data center networking market right now, which is why it won’t be surprising to see it capture a bigger share of this space in the future.
But even if the company holds on to its current market share of nearly 40% after five years, its annual networking revenue could hit $32 billion (based on the $80 billion market size projected earlier). That would be a nice jump from the current annual revenue run rate of $14 billion in the networking business.
Throw in the rosy prospects of the overall AI chip market, which is expected to clock $311 billion in annual revenue in 2029, and it won’t be surprising to see Nvidia’s data center business becoming even bigger in the long run than it is right now. Not surprisingly, analysts are expecting Nvidia’s earnings to increase at an annual rate of over 52% for the next five years.
That’s why investors looking to add an AI stock to their portfolios should consider buying Nvidia right away as it is currently trading at 42 times forward earnings, a discount to the U.S. technology sector’s average price-to-earnings ratio of 45.
Should you invest $1,000 in Nvidia right now?
Before you buy stock in Nvidia, consider this:
The Motley Fool Stock Advisor analyst team just identified what they believe are the 10 best stocks for investors to buy now… and Nvidia wasn’t one of them. The 10 stocks that made the cut could produce monster returns in the coming years.
Consider when Nvidia made this list on April 15, 2005… if you invested $1,000 at the time of our recommendation, you’d have $722,320!*
Stock Advisor provides investors with an easy-to-follow blueprint for success, including guidance on building a portfolio, regular updates from analysts, and two new stock picks each month. The Stock Advisor service has more than quadrupled the return of S&P 500 since 2002*.
*Stock Advisor returns as of September 16, 2024
Harsh Chauhan has no position in any of the stocks mentioned. The Motley Fool has positions in and recommends Nvidia. The Motley Fool has a disclosure policy.
Prediction: This $80 Billion Market Could Be the Next Big Growth Driver for Nvidia Stock was originally published by The Motley Fool
Trump Media & Technology's Stock Can't Stop Falling
Hannah Beier / Bloomberg via Getty Images
Key Takeaways
-
Shares of Truth Social’s parent company, majority owned by former President Donald Trump, extended their retreat Friday.
-
Investors are digesting the possibility that Trump or other investors who were previously prohibited from selling shares could soon begin doing so.
-
Trump last week said, “I’m not going to sell my shares.”
The rough week for shares of Truth Social’s parent company continued Friday.
Shares of Trump Media & Technology (DJT), the company majority-owned by former President Donald Trump, were recently down more than 3%, trading around $14.25 per share after finishing last week near $18.
Lock-Up Agreements Expired
The stock is falling as investors digest the possibility that Trump or other company insiders and investors could begin selling shares following the expiration of lock-up agreements that prohibited them from doing so. Trump in an interview last week said, “I’m not going to sell my shares.”
Selling by major shareholders would likely exert further downward pressure on a stock that earlier this year changed hands at around $70, soaring shortly after Truth Social’s then-parent merged with a blank-check company.
The expiration of the lock-up agreements could also “facilitate increased short selling in the stock,” according to a Thursday note from S3 Partners.
Trump Media was as of Thursday the worst-performing stock in the Russell 1000 since Aug. 5, according to Bespoke Investment Group. The index, which represents the largest 1,000 U.S. companies by market capitalization, has broadly risen during that time.
Read the original article on Investopedia.
Lennar Q3 Earnings & Revenues Beat, Stock Down on Tepid Q4 View
Lennar Corporation LEN reported third-quarter fiscal 2024 results, wherein its earnings and revenues surpassed the Zacks Consensus Estimate.
On a year-over-year basis, revenues increased, given the company’s emphasis on maintaining a steady production rate to drive sales momentum. Lennar strategically utilized pricing, incentives, marketing expenditure and dynamic pricing insights to ensure steady sales volume despite fluctuations in interest rates.
However, earnings fell by a cent from the year-ago period. LEN’s stock plunged 2.4% in the after-hours trading session on Sept. 19. Investors’ sentiments might have been hurt by lower earnings and gross margin in the fiscal third quarter, as well as tepid fiscal fourth-quarter guidance.
Quarterly Numbers
LEN reported adjusted earnings per share (excluding mark-to-market gains on technology investments and one-time items in its Multifamily segment) of $3.90, which topped the Zacks Consensus Estimate of $3.62 by 7.7%. The metric, however, slipped 0.3% year over year from $3.91 per share.
Segment Details
Homebuilding: Revenues of the segment totaled $9.05 billion, up 8.7% from the prior-year quarter. Under the Homebuilding umbrella, home sales contributed $9.02 billion to total revenues, up 8.8% from a year ago.
Land sales accounted for $19.5 million, down from $20.4 million in the prior-year quarter. The Other homebuilding unit contributed $8.6 million to homebuilding revenues, down from $12.3 million a year ago.
Home deliveries for the reported quarter improved 16% from the year-ago level to 21,516 units. The reported figure was better than our projection of 20,598 units for the quarter. The average sales price of homes delivered was $422,000, down 5.8% from the year-ago figure due to pricing to market through an increased use of incentives and product mix. Our model had predicted ASP to be $432,910 for the fiscal third quarter.
New orders rose 5% from the year-ago quarter to 20,587 homes. However, the potential value of net orders fell 0.9% year over year to $8.56 billion.
Backlog at the fiscal third-quarter end declined 20.5% from the year-ago quarter to 16,944 homes. Potential housing revenues from backlog decreased 21.4% year over year to $7.75 billion.
The gross margin on home sales was 22.5% for the quarter, down 190 basis points (bps). Notably, the reported figure came below our projection of 23% for the quarter. The decline was mainly due to decreased revenues per square foot and increased land costs year over year.
SG&A expenses — as a percentage of home sales — decreased 30 bps to 6.7% due to a decrease in broker commissions and benefits of LEN’s technology efforts.
Financial Services: The segment’s revenues increased year over year to $273.3 million from $266.2 million for the reported quarter. Operating earnings for the quarter increased to $144.4 million from $149 million a year ago.
Lennar Multi-Family: Revenues of $93.4 million in the segment were down from $137.4 million in the prior-year quarter. The segment registered operating earnings of $78.9 million for the quarter against a loss of $8.7 million a year ago.
Lennar Other: The segment’s revenues totaled $3.6 million, significantly down from $7.4 million a year ago. Its operating earnings were $20.1 million for the quarter against a loss of $26.2 million a year ago.
Financials
At the fiscal third-quarter end, Lennar had homebuilding cash and cash equivalents of $4.04 billion, down from $6.27 billion at the end of fiscal 2023. LEN has no outstanding borrowings under the $2.2 billion revolving credit facility, thereby providing $6.2 billion of liquidity.
The total homebuilding debt was $2.26 billion as of the fiscal third-quarter end, down from $2.82 billion at the fiscal 2023-end. Homebuilding debt to capital at the fiscal third-quarter end was 7.6%, down from 9.6% at the fiscal 2023-end.
LEN repurchased 3.4 million shares for $519 million in the fiscal third quarter.
Guidance
For fourth-quarter fiscal 2024, the company expects deliveries within 22,500-23,000 homes, depicting a fall from 23,795 homes delivered in the year-ago period. The company expects the ASP of the delivered units to be nearly $425,000, down from an ASP of $441,000 reported a year ago.
The gross margin on home sales is expected to be flat year over year. SG&A expenses, as a percentage of home sales, are likely to be in the range of 6.7-6.8% for the quarter. In the prior year, gross margin was 24.2%, and SG&A was 6.6%.
New orders are likely to be within 19,000-19,300 units, up from 17,366 homes reported a year ago.
Financial Services operating earnings are expected to be around $140 million, down from $168 million a year ago.
LEN’s Zacks Rank & Stocks to Consider
Lennar currently carries a Zacks Rank #4 (Sell).
Some better-ranked stocks in the same space are M/I Homes, Inc. MHO, Meritage Homes Corporation MTH and PulteGroup, Inc. PHM. Each stock presently carries a Zacks Rank #2 (Buy).
M/I Homes is a Columbus, OH-based homebuilder that engages in the construction and sale of single-family residential homes.
MHO’s EPS estimates for 2024 have increased to $19.76 from $19.58 over the past 30 days. The company’s earnings surpassed the Zacks Consensus Estimate in three of the trailing four quarters and missed on one occasion, the average being 4.8%. MHO’s earnings are expected to rise 21.9% year over year in 2024.
Meritage Homes is a Scottsdale, AZ-based company that designs and builds single-family attached and detached homes.
MTH’s EPS estimates for 2024 have increased to $21.09 from $20.33 over the past 60 days. The company’s earnings surpassed the Zacks Consensus Estimate in all the trailing four quarters, the average being 21.5%. MTH’s earnings are expected to rise 5.8% year over year in 2024.
PulteGroup is an Atlanta, GA-based homebuilder engaged in homebuilding and financial services businesses.
PHM’s EPS estimates for 2024 have increased to $13.36 from $12.85 over the past 60 days. The company’s earnings surpassed the Zacks Consensus Estimate in all the trailing four quarters, the average being 10%. PHM’s earnings are expected to rise 14% year over year in 2024.
© 2024 Benzinga.com. Benzinga does not provide investment advice. All rights reserved.
Are Demographics Destiny For The Stock Market?
A recently released paper called The Wealth of Working Nations found that, after controlling for working-age population (i.e. those age 15-64), historical GDP growth is quite similar across most developed countries. But, this got me thinking, “How much do demographics impact the stock market?”
With the Baby Boomers continuing to retire in the U.S. and population growth slowing throughout most of the developed world, will this spell disaster for future stock returns? This isn’t a simple question to answer.
For years, researchers have debated the impact of population trends on economic growth and market performance. Some have argued that demographics are the hidden force behind long-term market trends. However, others believe that other factors such as productivity growth play a far larger role.
In this post, I will explore this relationship in more detail to see whether population really holds the key to economic growth and future stock returns. Let’s dig in.
Does Population Predict GDP Growth?
When it comes to population growth and GDP growth, there is some evidence that they are positively correlated, at least within developing countries. The Federal Reserve released a note in September 2016 which concluded that, “demographic changes account for a significant portion of growth slowdown in several of these [OECD] economies in recent years.”
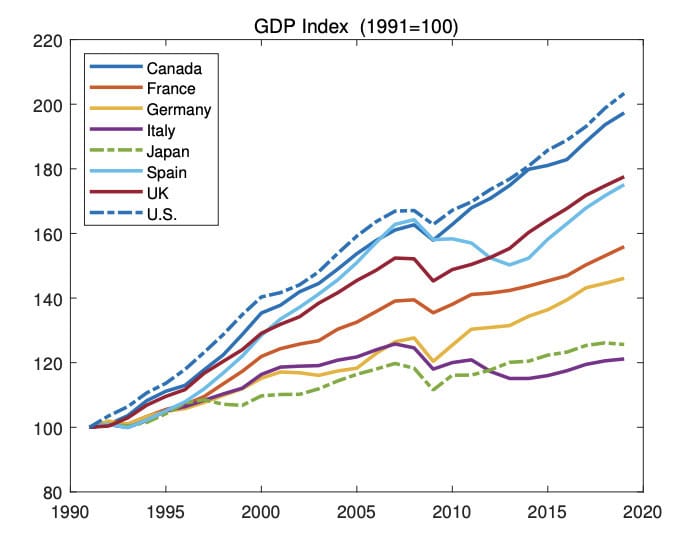
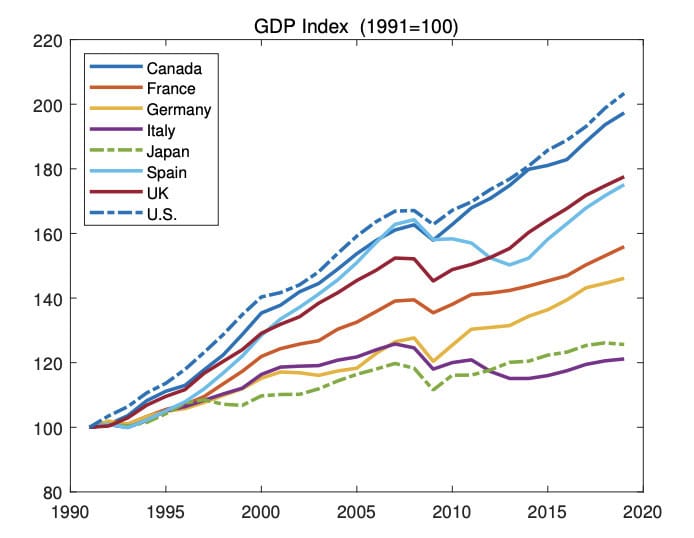
Looking at GDP growth and population changes over time makes this more apparent. For example, from The Wealth of Working Nations paper, you can see how GDP has changed in a handful of advanced economies since 1991:
What you may notice is that countries like Italy and Japan have had worse GDP growth than countries like the U.S. and Canada. This has occurred for a multitude of reasons, but one of them is related to changes in working-age population.
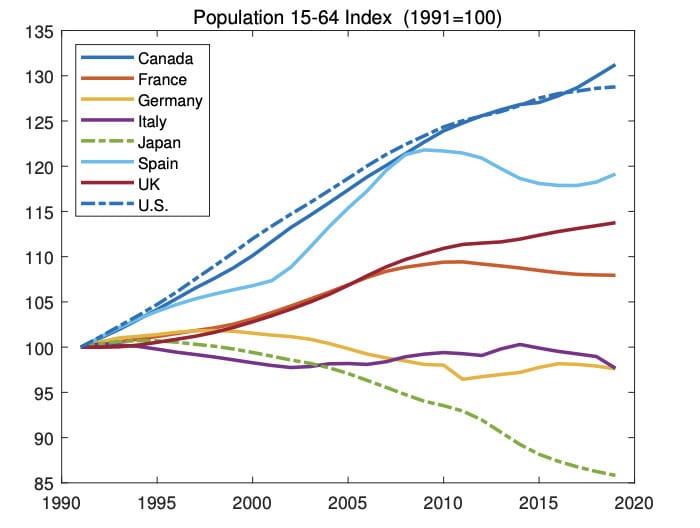
When we look at the changes in their working populations, there are many parallels:
As you can see, countries with the largest working-age population declines have also seen some of the worst GDP growth since 1991.
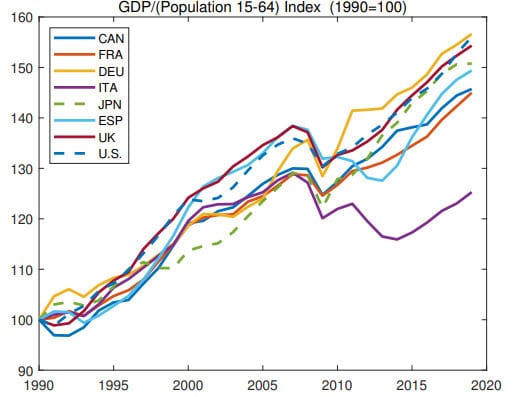
Putting it altogether, the authors divided GDP by the change in working-age population and found some remarkable convergence across countries:
After controlling for working-age population, basically every country besides Italy has had remarkably similar changes in their overall GDP. This isn’t GDP per capita because it doesn’t use total population, but working-age population. In other words, GDP per worker has grown roughly the same across these developed economies.
But if this relationship seems to be true for the economy, what about the stock market?
Does Population Predict Stock Returns?
When it comes to population changes and the stock market, one of the most comprehensive papers on this topic was released by Rob Arnott and Denis Chaves back in 2012. Their research examined 60 years of data to see how demographic changes impacted stock returns and found a somewhat positive relationship.
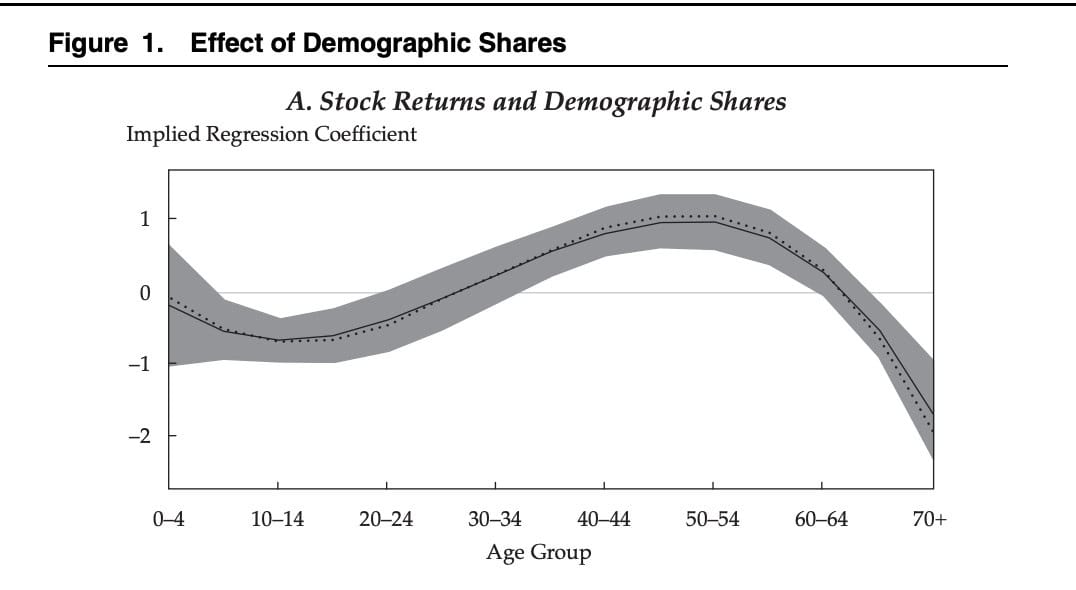
For example, after regressing the size of different population cohorts on future stock returns, they found that a roughly 1% increase in those aged 50-54 was associated with a 1% higher annual return for a country’s stock market. You can see this in the figure below:
Now compare this with the 70+ age cohort where every 1% increase in their share of population suggests 1.5% annual decline in future stock returns. In other words, countries with a higher share of workers have improved stock returns. Arnott and Chaves concluded as much in their paper:
Large populations of retirees (65+) seem to erode the performance of financial markets as well as economic growth. This finding makes perfect sense; retirees are disinvesting in order to buy goods and services that they no longer produce, and they are no longer contributing goods and services into the macroeconomy.
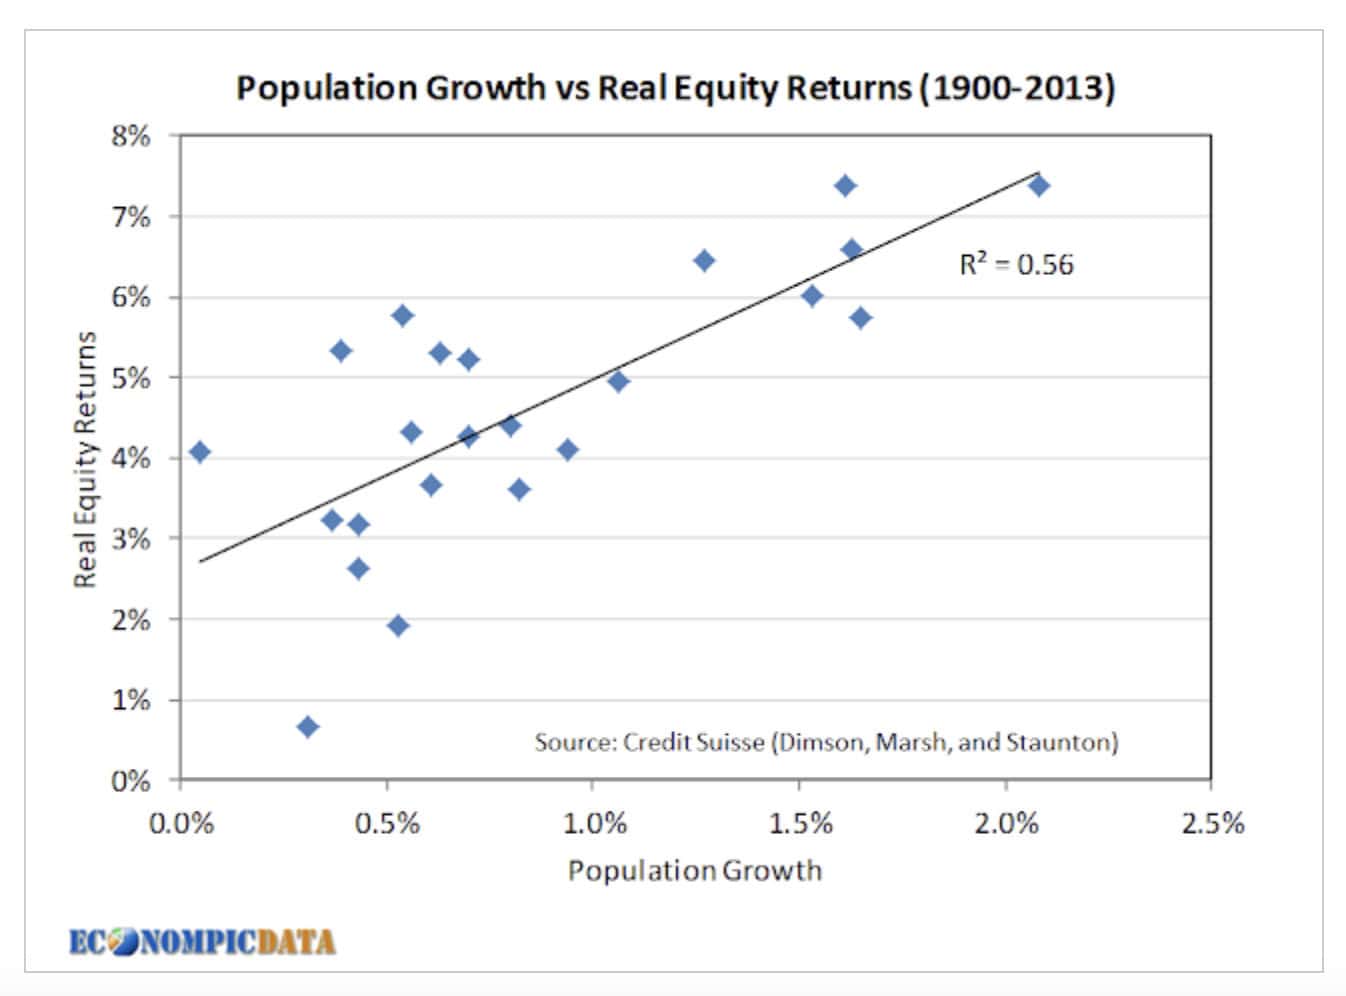
Arnott and Chaves aren’t the only researchers do to an analysis on demographics and stock returns. The blogger EconomPic had a post on the same topic back in 2017. He also found a positive relationship between population growth and real equity returns across countries from 1900-2013:
So, is this a closed case? If population growth is so important, why do we even bother making predictions about anything else related to stocks?
Because population growth isn’t the whole story. If we go back to Arnott and Chaves’ paper, they actually made some predictions on future stock returns by country based on their demographics. Here’s a map of their annualized stock market forecast by country for 2011-2020:
According to this, the U.S. should have had a 0%-4% annualized stock market return, Japan should’ve had less than a -2% return, and China should have had a greater than 9% return over this period. But what actually happened? None of those things.
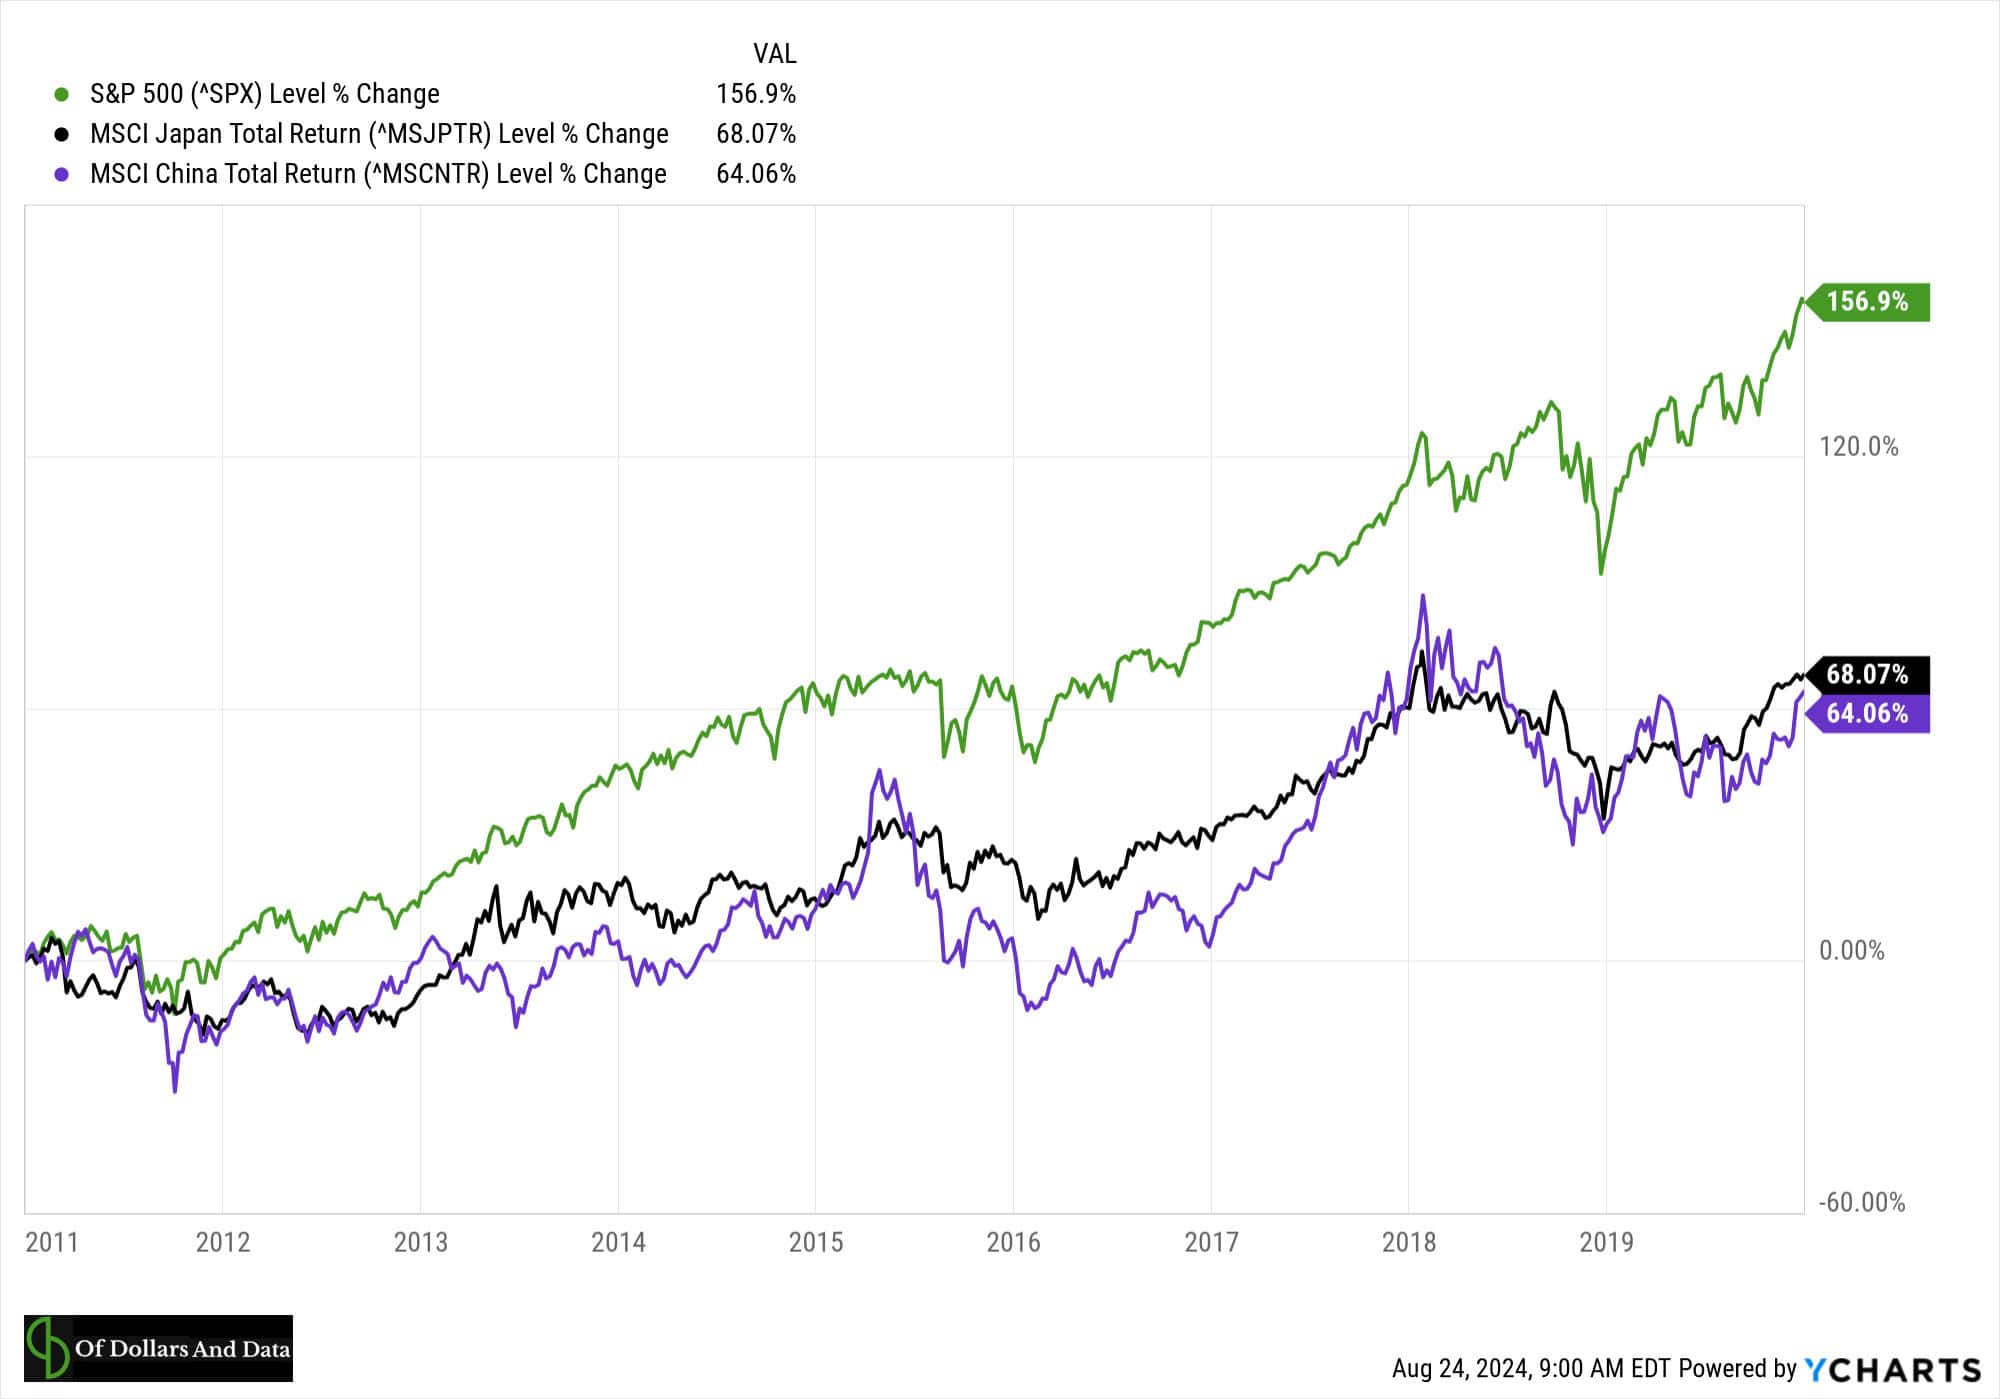
From 2011 to the end of 2019 (pre-COVID), the U.S. had the highest return with China and Japan performing roughly similar:
While this is only three countries from the many listed above, it illustrates the difficulty of predicting future stock returns based on demographics alone. Yes, population matters, but other factors such as technological change, productivity growth, and investor preferences can matter even more.
The Bottom Line
Demographics play a significant role in shaping economies and their underlying stock markets. The research I’ve highlighted shows a clear relationship between population trends, GDP growth, and stock returns. In general, countries with growing working-age populations tend to experience stronger economic growth, which often translates to better stock market performance.
However, demographics are not always destiny in the stock market. Technological advancements, productivity growth, policy decisions, and shifting investor preferences can all significantly impact stock returns, sometimes overshadowing demographic effects. Additionally, a country’s market performance isn’t solely determined by its own demographic profile, but can also be influenced by other global trends and capital flows.
While the retirement of Baby Boomers in the U.S. and similar trends in other countries will present future challenges to stock returns, this doesn’t necessarily spell doom for your portfolio. A changing demographic profile could spark innovations in productivity or reorient the global economy in a way that mitigates these negative demographic pressures.
Yes, work will need to get done for civilization to keep moving forward. But with the continued development of AI and LLMs, there’s nothing that says that these future workers must all be people.
Either way, what matters for you isn’t the demographics of any one country, but owning a diverse set of income-producing assets. That’s how you counteract a changing population and build wealth for the long-run.
Until then, happy investing and thank you for reading!
If you liked this post, consider signing up for my newsletter.
© 2024 Benzinga.com. Benzinga does not provide investment advice. All rights reserved.
Most People Expect To Retire at 67, But 56% Retire Sooner – Can You Guess the Actual Average Retirement Age?
Many plan to work well into their 60s or even 70s, thinking they can compensate for years of undersaving. But according to recent surveys, retirement may come earlier than expected for many Americans – whether they’re ready for it or not.
The average retirement age in the U.S. is about 62 years old, even though most workers expect to retire around 67. In fact, more than 56% of retirees left the workforce earlier than they planned, according to a Transamerica survey. So, what’s causing this gap between expectations and reality?
Don’ Miss:
Health is a big factor. Roughly 38% of early retirees say they had to stop working because of health issues or disabilities. This isn’t always part of the plan, but sudden medical conditions or ongoing health problems can change things quickly. This is a reality many don’t account for when imagining working into their late 60s or 70s.
Then there’s the job market itself. Fourteen percent of those who retired early did so after being laid off; for many, finding another job isn’t appealing or feasible.
Companies downsize, industries change and job security becomes less certain as people age, making retirement sometimes less of a choice and more of a necessity.
In addition to these reasons, life events – like family changes or unexpected financial shifts – can also force people to reconsider their plans. Some may find they’ve saved enough to retire early, but for most, it’s often a mix of circumstance and necessity that leads them there.
Trending: Founder of Personal Capital and ex-CEO of PayPal re-engineers traditional banking with this new high-yield account — start saving better today.
Financially, retiring earlier than planned can be a challenge. Many people end up dipping into their savings sooner than expected, which stretches their retirement funds thinner over a longer period. According to various reports, the average American retiree has around $269,078 saved for retirement, far below what’s typically recommended. Financial planners suggest a target of around $572,000 and that gap can mean tough choices down the road.
Additionally, if people claim Social Security benefits before they hit their full retirement age – 67 for many – they’ll see a permanent reduction in monthly benefits. Plus, if they retire before Medicare eligibility kicks in at 65, they may face higher health care costs or gaps in coverage.
Trending: Elon Musk and Jeff Bezos are bullish on one city that could dethrone New York and become the new financial capital of the US. Investing in its booming real estate market has never been more accessible.
So, what does this all mean? Planning to work longer might not be the foolproof strategy some hope it will be. Between health issues, layoffs and other unexpected life events, early retirement happens to more people than you might think. And without enough savings, the financial picture can get complicated fast.
While everyone’s situation is different, having a backup plan and saving more now might be the safest bet for those who want more control when they retire. It’s always smart to reassess your retirement plan and consulting with a financial advisor can give you a clearer picture of where you stand. They can help you adjust your savings strategy, review your investment options and ensure you’re prepared for any surprises that could force early retirement.
Read Next:
Up Next: Transform your trading with Benzinga Edge’s one-of-a-kind market trade ideas and tools. Click now to access unique insights that can set you ahead in today’s competitive market.
Get the latest stock analysis from Benzinga?
This article Most People Expect To Retire at 67, But 56% Retire Sooner – Can You Guess the Actual Average Retirement Age? originally appeared on Benzinga.com
© 2024 Benzinga.com. Benzinga does not provide investment advice. All rights reserved.
MFC Stock Near 52-Week High: Should You Buy or Wait for a Pullback?
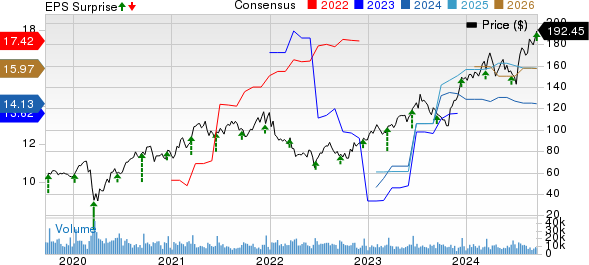
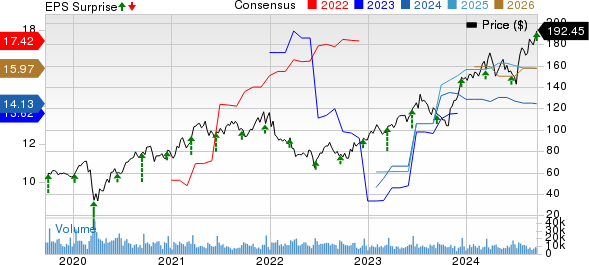
Shares of Manulife Financial Corporation MFC closed at $28.87 on Thursday, near its 52-week high of $28.89. A strong-performing Asia business, expanding Wealth and Asset Management business and a solid capital position are driving the stock price higher.
The company is one of the three dominant life insurers within its domestic Canadian market and possesses rapidly growing operations in the United States and several Asian countries. Earnings grew 4.9% in the last five years, better than the industry average of 4.6%.
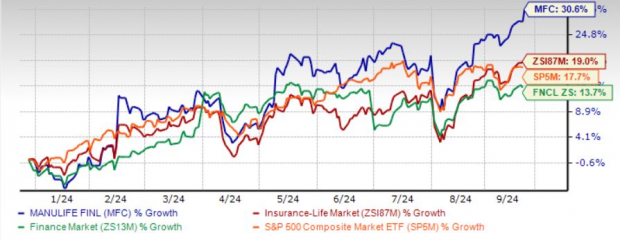
Shares have rallied 30.6% year to date, outperforming the industry’s increase of 19%, the Finance sector’s increase of 13.7% and the S&P 500 composite’s rise of 17.7%.
MFC Outperforms Industry, Sector, S&P 500 YTD

Image Source: Zacks Investment Research
MFC shares are trading well above the 50-day moving average, indicating a bullish trend.
MFC’s Return on Equity
Manulife’s return on equity (ROE) for the trailing 12 months is 16.2%, better than the industry average of 15.5%. This reflects Manulife’s efficiency in utilizing shareholders’ funds. It expects to generate a ROE of more than 18% by 2027.
Optimistic Growth Outlook
The Zacks Consensus Estimate for 2024 and 2025 earnings per share is pegged at $2.72 and $2.86, respectively, suggesting an increase of 5.8% and 5.2% year over year. The long-term earnings growth rate is currently pegged at 10%. Manulife expects core EPS growth of 10-12% over the medium term.
Factors Favoring MFC
Manulife’s Asia business continues to be a major contributor to earnings. Asia has been the fastest-growing insurance segment, supported by strong volume growth and attractive margins. This market appears attractive, given its changing demographics. MFC now expects core earnings from Asia to contribute 50% to overall earnings by 2027.
As part of its strategic priorities, Manulife is also investing in high ROE and growth segments in North America. The company’s highest potential businesses, including operations in Asia, Global WAM, Canada group benefits and behavioral insurance products, currently contribute two-thirds to core earnings. The insurer now looks to increase it to 75% and thus is expediting growth in these highest potential businesses.
In tandem with the wave of digitalization going on, MFC is digitalizing and automating workflows through GenAI and advanced analytics. Accelerated digitalization should help it achieve an expense efficiency ratio of less than 45% in the medium term.
Manulife has been strengthening its balance sheet by improving liquidity and leverage. It targets a leverage ratio of 25%. Notably, its free cash flow conversion has remained more than 100% over the last many quarters, reflecting its solid earnings.
The life insurer, banking on consistent cash flow, hiked dividends at a six-year CAGR of 10% and targets a 35-45% dividend payout over the medium term.
Concerns Regarding MFC
Despite the upside potential, there are a few factors that investors should keep an eye on.
Manulife targeted an expense efficiency ratio of less than 50% or $1 billion in cost savings and avoidance. It is on track to deliver an efficiency ratio of less than 45% in the future. However, its net margin has been contracting over the last six quarters.
Manulife draws a substantial portion of its earnings from the international market, which makes its profitability vulnerable to foreign exchange losses. In an attempt to lower its forex exposure, the company has started incurring hedging costs.
Though the leverage has been gradually improving, times interest earned has been declining.
The return on invested capital in the trailing 12 months was 0.66%, comparing unfavorably with the industry average of 0.68%, reflecting the insurer’s inefficiency in utilizing funds to generate income.
MFC Shares Expensive
MFC shares are trading at a price-to-earnings multiple of 10.23, higher than the industry average of 8.40.
Shares of other insurers like Sun Life Financial SLF and Aflac Incorporated AFL are trading at a multiple higher than the industry average.
Parting Thoughts
MFC’s focus on building a high-growth, high-return and high cash generation company, wealth distribution to shareholders and ROE expansion instills confidence in this Zacks Rank #3 (Hold) insurer.
However, given the stock’s premium valuation, it will be wise for new investors to wait for a better entry point.
Investors who already hold MFC stock should retain it, given its growth prospects.
© 2024 Benzinga.com. Benzinga does not provide investment advice. All rights reserved.
Acetal Copolymer Market to Reach $848.2 Million, Globally, by 2030 at 5.7% CAGR: Allied Market Research
Wilmington, Delaware , Sept. 20, 2024 (GLOBE NEWSWIRE) — Allied Market Research published a report, titled, “Acetal Copolymer Market by Product Type (Low Heat Resistant, Medium Heat Resistant and High Heat Resistant), Forming Method (Injection Molding, Extrusion, Rotational Molding, Blow Molding and Others), and End-Use Industry (Automotive, Electrical and Electronics, Building and Construction, Aerospace and Others): Global Opportunity Analysis and Industry Forecast, 2024-2030″. According to the report, the acetal copolymer market was valued at $576.5 million in 2023, and is estimated to reach $848.2 million by 2030, growing at a CAGR of 5.7% from 2024 to 2030.
Download Sample Pages of Research Overview: https://www.alliedmarketresearch.com/request-sample/A11573
Prime determinants of growth
The rising need for durable and lightweight materials in manufacturing is also propelling the acetal copolymer market. Industries such as electronics, consumer goods, healthcare, and industrial machinery are increasingly opting for materials that offer high strength-to-weight ratios, ease of fabrication, and long-term reliability. Acetal copolymers meet these requirements, making them a preferred choice for applications ranging from precision gears and bearings to intricate medical devices and consumer electronics components. The ability of acetal copolymers to maintain their properties over a wide temperature range and in various chemical environments further enhances their appeal across these sectors. As manufacturers seek to improve product performance while reducing costs and environmental impact, the demand for acetal copolymers is expected to rise significantly. However, high production costs of acetal copolymer may restrain the growth of the acetal copolymer market during the forecast period.
Report coverage & details:
| Report Coverage | Details |
| Forecast Period | 2024–2030 |
| Base Year | 2023 |
| Market Size in 2023 | $576.5 million |
| Market Size in 2030 | $848.2 million |
| CAGR | 5.7% |
| No. of Pages in Report | 350 |
| Segments covered | Product Type, Forming Method, End-Use Industry, and Region. |
| Drivers | Escalating demand from consumer goods sector Robust demand from automotive sector Growing demand from construction sector |
| Opportunities | Technological advancements |
| Restraints | High production costs |
The high heat resistant segment to maintain its lead position during the forecast period.
The demand for high heat-resistant acetal copolymer is increasing due to its essential role in advanced manufacturing sectors that require materials capable of withstanding elevated temperatures without degrading. Industries such as automotive, electronics, and industrial machinery are progressively seeking materials that offer high thermal stability, improved durability, and low friction. The shift towards electric vehicles, which generate more heat, and the miniaturization of electronic components necessitate materials that can perform reliably under higher temperatures. Additionally, high heat-resistant acetal copolymers provide enhanced performance in demanding applications, contributing to longer product lifespans and reduced maintenance costs, making them highly attractive for manufacturers aiming for efficiency and reliability.
The injection molding segment to maintain its lead position during the forecast period.
The demand for injection molded acetal copolymer is increasing due to its exceptional mechanical properties, precision, and efficiency in mass production. This material offers high strength, low friction, and excellent dimensional stability, making it ideal for complex and high-performance components in industries such as automotive, electronics, and consumer goods. Injection molding allows for the rapid production of intricate parts with consistent quality, reducing manufacturing costs and time. Additionally, the versatility of acetal copolymers in being easily colored and modified enhances their appeal for various applications. As industries seek cost-effective, reliable, and high-quality materials for large-scale production, the use of injection molded acetal copolymer continues to rise.
Procure Complete Report (350 Pages PDF with Insights, Charts, Tables, and Figures) @ https://www.alliedmarketresearch.com/checkout-final/acetal-copolymer-market
The automotive segment to maintain its lead position during the forecast period.
The demand for acetal copolymer in the automotive sector is increasing due to its superior mechanical properties, low friction, and excellent wear resistance. These characteristics make it ideal for producing durable and lightweight components such as gears, bearings, and fuel system parts. With the automotive industry’s shift towards electric vehicles (EVs) and advanced driver-assistance systems (ADAS), there is a growing need for materials that can perform reliably under high stress and varying temperatures. Acetal copolymers help improve fuel efficiency and reduce emissions by enabling the production of lighter components without compromising strength. This makes them highly valuable in the pursuit of enhancing vehicle performance and sustainability.
North America to maintain its dominance by 2030
The demand for acetal copolymer is increasing in the Asia-Pacific region due to several key factors. Firstly, the region’s robust automotive industry, particularly in countries like China, Japan, and India, is driving the need for high-performance materials like acetal copolymers, which are essential for manufacturing durable and lightweight automotive components. Secondly, the rapid growth in electronics and consumer goods manufacturing in the region necessitates materials that offer excellent mechanical properties, dimensional stability, and ease of processing, which acetal copolymers provide. Additionally, the industrial machinery sector in Asia-Pacific is expanding, with increasing investments in infrastructure and manufacturing capabilities, further boosting the demand for acetal copolymers. Lastly, the rising focus on sustainable materials and the adoption of advanced manufacturing techniques in the region are contributing to the increased utilization of acetal copolymers.
Leading Market Players: –
- Boedeker Plastics, Inc
- Emco Industrial Plastics
- Radici Partecipazioni SpA
- Mitsubishi Chemical Group of companies
- thyssenkrupp Materials NA, Inc
Want to Access the Statistical Data and Graphs, Key Players’ Strategies: https://www.alliedmarketresearch.com/acetal-copolymer-market/purchase-options
The report provides a detailed analysis of these key players in the global acetal copolymer market. These players have adopted different strategies such as new product launches, collaborations, expansion, joint ventures, agreements, and others to increase their market share and maintain dominant shares in different regions. The report is valuable in highlighting business performance, operating segments, product portfolio, and strategic moves of market players to showcase the competitive scenario.
About Us
Allied Market Research (AMR) is a full-service market research and business-consulting wing of Allied Analytics LLP based in Portland, Oregon. Allied Market Research provides global enterprises as well as medium and small businesses with unmatched quality of “Market Research Reports” and “Business Intelligence Solutions.” AMR has a targeted view to provide business insights and consulting to assist its clients to make strategic business decisions and achieve sustainable growth in their respective market domain.
Pawan Kumar, the CEO of Allied Market Research, is leading the organization toward providing high-quality data and insights. We are in professional corporate relations with various companies and this helps us in digging out market data that helps us generate accurate research data tables and confirms utmost accuracy in our market forecasting. Each and every data presented in the reports published by us is extracted through primary interviews with top officials from leading companies of domain concerned. Our secondary data procurement methodology includes deep online and offline research and discussion with knowledgeable professionals and analysts in the industry.
Contact:
David Correa
United States
1209 Orange Street,
Corporation Trust Center,
Wilmington, New Castle,
Delaware 19801 USA.
Int’l: +1-503-894-6022
Toll Free: +1-800-792-5285
Fax: +1-800-792-5285
help@alliedmarketresearch.com
Web: www.alliedmarketresearch.com
Allied Market Research Blog: https://blog.alliedmarketresearch.com
Blog: https://www.newsguards.com/
Follow Us on | Facebook | LinkedIn | YouTube |

© 2024 Benzinga.com. Benzinga does not provide investment advice. All rights reserved.
Suze Orman Says Keep Your Car For '15 Years Or Longer' Instead Of Leasing A New One Every 3 Years Just To Impress Strangers
Suze Orman, the well-known financial guru, has long advocated buying cars and keeping them for extended periods, a strategy that aligns with current automotive trends. In a recent interview with Go Banking Rates, Orman emphasized the financial wisdom of long-term car ownership.
Don’t Miss:
“When I buy a car, I keep it for at least 10 to 12 to 15 years or longer,” Orman said. “Right now, I am going on the 12th year that I have owned my car and I have no plans of getting rid of that car for years to come.”
Orman’s approach mirrors the evolving behavior of American car owners. According to S&P Global Mobility, the average age of cars and light trucks in the U.S. reached a record high of 12.6 years in 2024, up from 12.5 years in 2023. This trend represents a significant increase from two decades ago when the average vehicle age was just 9.7 years.
Trending: Founder of Personal Capital and ex-CEO of PayPal re-engineers traditional banking with this new high-yield account — start saving better today.
She also criticizes the practice of frequent car upgrades, particularly leasing. “I don’t buy a car every three years like most of you do,” she said. “I don’t lease a car every three years like many of you do, simply to drive a car to impress people you don’t even know at a stop sign with money you probably don’t even have.”
While Orman’s advice may seem conservative, it’s increasingly relevant given the current automotive market and rising car payments. According to Experian, the average monthly car payment for new vehicles was $735 in the first quarter of 2024, a 0.4% increase from the previous year. Used car payments also rose by 0.4%, reaching $523 per month.
Trending: Elon Musk and Jeff Bezos are bullish on one city that could dethrone New York and become the new financial capital of the US. Investing in its booming real estate market has never been more accessible.
These high payments are largely due to the increasing costs of vehicles. According to Kelley Blue Book, the average price of a new car reached $48,247 in late 2023. Even used cars averaged $26,091, highlighting the significant financial commitment involved in vehicle purchases.
The financial implications of buying versus leasing are substantial. A 2024 analysis by MST found that over 39 months, leasing resulted in a total cash outlay of $16,622.19 compared to $18,910.09 for purchasing. However, purchasing builds equity, with the vehicle retaining a value of $11,512.48 at the end of this period.
Trending: During market downturns, investors are learning that unlike equities, these high-yield real estate notes that pay 7.5% – 9% are protected by resilient assets, buffering against losses.
Despite these high prices and payments, car ownership remains prevalent in the U.S. A Forbes Advisor report indicates that 91.7% of U.S. households had at least one vehicle in 2022, with 22.1% owning three or more.
As vehicle costs continue to rise and economic uncertainties persist, Orman’s approach to car ownership may become increasingly appealing to consumers looking to maximize their automotive investments while minimizing long-term expenses. By avoiding the cycle of frequent upgrades and high monthly payments, consumers can potentially save thousands of dollars over the life of their vehicles.
Read Next:
Up Next: Transform your trading with Benzinga Edge’s one-of-a-kind market trade ideas and tools. Click now to access unique insights that can set you ahead in today’s competitive market.
Get the latest stock analysis from Benzinga?
This article Suze Orman Says Keep Your Car For ’15 Years Or Longer’ Instead Of Leasing A New One Every 3 Years Just To Impress Strangers originally appeared on Benzinga.com
© 2024 Benzinga.com. Benzinga does not provide investment advice. All rights reserved.


