Time to Buy the Dip on This 8.1% Hyper-Yield Dividend King?
Most investors who buy Altria Group (NYSE: MO) stock aren’t doing it in hopes of enjoying explosive share price gains. The stock has underperformed the S&P 500 for years. But the dividend? That’s another story. Altria is a world-class dividend stock with a massive yield and a track record of payout hikes spanning more than five decades.
The Dividend King has shown some life this year. This month, the stock climbed above $56 to its highest price since early 2022 before retreating to around $50.
That pullback could make this a perfect buying opportunity for dividend-hungry investors looking for double-digit percentage annual investment returns.
Slow. Steady. Reliable.
Many investors view tobacco companies as the old guard of the stock market. U.S. smoking rates have declined for decades, and it’s widely known how terrible tobacco use of any kind is for one’s health. Altria, which sells cigarettes, chewing tobacco, and smokeless nicotine products in the United States, still gets the vast majority of its revenue and earnings from selling cigarettes. Marlboro is Altria’s flagship brand.
But even today, people seemingly underestimate how resilient the tobacco industry is. The addictive nature of nicotine and high regulatory barriers to new industry entrants has allowed Altria to steadily raise its prices per pack, more than offsetting the fact that Altria sells fewer cigarettes each year.
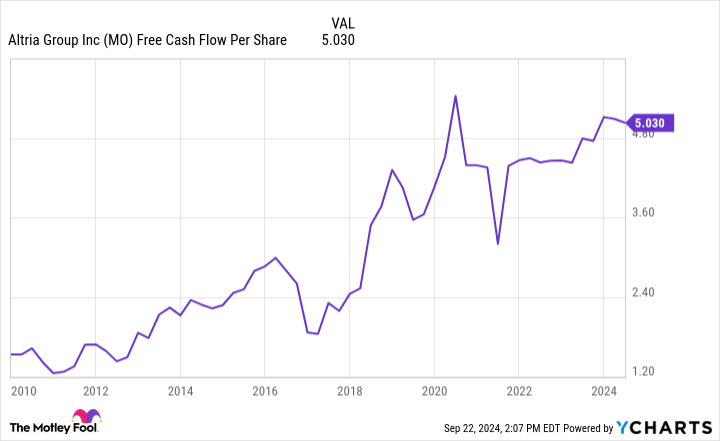
The combination of those price increases and the company’s share repurchases has been enough to generally increase Altria’s free cash flow per share.
Nobody will mistake Altria for a high-growth business. Its earnings grow at low-single-digit percentage rates. The bottom line is that it continues to deliver slow and steady growth. Will that continue forever? Nobody can know for sure. However, there are no signs that it will stop soon. Analysts estimate Altria will grow earnings by just over 3% annually for the next three to five years.
This is no yield trap
A company’s management team may be able to choose how much it pays in dividends, but it can’t entirely control its dividend yield, because that depends on the stock price too. Sometimes, high yields can tempt investors — they can look like easy money. However, a stock’s dividend yield could be high because the market believes the company can’t afford to maintain its payout at previous levels, or because other red flags drive down the share price.
In that context, high-yield stocks can prove to be bad investments, especially if the company cuts its dividend. Such low-quality stocks with high yields that are headed for payout cuts are sometimes called yield traps.
Altria’s dividend yield is high because its earnings grow slowly. The market knows that most of the returns on the stock will come from dividends, and the share price reflects that. Yet Altria is no yield trap because its payout is safe. The company routinely spends about 80% of its earnings on dividends.
That’s a higher dividend payout ratio than most companies, but Altria’s business requires little investment. It can’t even advertise due to tobacco laws. That unique business model allows Altria to comfortably distribute more of its profits as dividends than most companies.
Market-beating investment returns are possible
Altria has been around for generations and is one of the greatest-performing stocks ever. However, it has underperformed the S&P 500 for years now. Yet it could become a market-beating stock again.
Thanks largely to the artificial intelligence trend, the S&P 500 has enjoyed a stellar 31% rally over the past year and trades at a price-to-earnings (P/E) ratio of 24, well above its historical average. While attempting to time the market tends to be a losing strategy, there could be more volatility in the future, and if a U.S. recession occurs, that could trigger a market downturn.
Meanwhile, Altria has a pretty straightforward path to double-digit annualized investment returns. Based on its current 8.1% dividend yield and the expectation for 3% to 4% annualized earnings growth, it could generate a return of between 11% and 12% annually. With a P/E ratio under 9, Altria’s valuation is reasonable enough that investors are less likely to see a further dramatic decrease in the stock’s valuation. Now that the Federal Reserve has begun cutting interest rates, the market may even support higher valuations for high-yield stocks like Altria.
Altria stock can offer reliable dividends and even surprise investors with its total return potential. Its slow growth means investors shouldn’t overpay for the stock, so its recent dip offers a perfect opportunity to add shares while the stock price still makes sense.
Should you invest $1,000 in Altria Group right now?
Before you buy stock in Altria Group, consider this:
The Motley Fool Stock Advisor analyst team just identified what they believe are the 10 best stocks for investors to buy now… and Altria Group wasn’t one of them. The 10 stocks that made the cut could produce monster returns in the coming years.
Consider when Nvidia made this list on April 15, 2005… if you invested $1,000 at the time of our recommendation, you’d have $712,454!*
Stock Advisor provides investors with an easy-to-follow blueprint for success, including guidance on building a portfolio, regular updates from analysts, and two new stock picks each month. The Stock Advisor service has more than quadrupled the return of S&P 500 since 2002*.
*Stock Advisor returns as of September 23, 2024
Justin Pope has no position in any of the stocks mentioned. The Motley Fool has no position in any of the stocks mentioned. The Motley Fool has a disclosure policy.
Time to Buy the Dip on This 8.1% Hyper-Yield Dividend King? was originally published by The Motley Fool
Strategic Sale: Amy C Becker Decides To Exercise Options Worth $498K At Donaldson
Highlighted on September 23, it was unveiled in an SEC filing that Becker, Chief Legal Officer at Donaldson DCI, executed a significant transaction involving the exercise of company stock options.
What Happened: In an insider options sale disclosed in a Form 4 filing on Monday with the U.S. Securities and Exchange Commission, Becker, Chief Legal Officer at Donaldson, exercised stock options for 14,500 shares of DCI. The transaction value amounted to $498,074.
Donaldson shares are trading up 0.67% at $73.13 at the time of this writing on Tuesday morning. Since the current price is $73.13, this makes Becker’s 14,500 shares worth $498,074.
About Donaldson
Donaldson is a leading manufacturer of filtration systems and replacement parts (including air filtration systems, liquid filtration systems, and dust, fume, and mist collectors). The company serves a diverse range of end markets, including construction, mining, agriculture, truck, and industrial. Its business is organized into three segments: mobile solutions, industrial solutions, and life sciences. Donaldson generated approximately $3.6 billion in revenue and $544 million in operating income in its fiscal 2024.
Donaldson: Delving into Financials
Revenue Growth: Donaldson’s remarkable performance in 3 months is evident. As of 31 July, 2024, the company achieved an impressive revenue growth rate of 0.81%. This signifies a substantial increase in the company’s top-line earnings. In comparison to its industry peers, the company trails behind with a growth rate lower than the average among peers in the Industrials sector.
Analyzing Profitability Metrics:
-
Gross Margin: The company issues a cost efficiency warning with a low gross margin of 35.79%, indicating potential difficulties in maintaining profitability compared to its peers.
-
Earnings per Share (EPS): Donaldson’s EPS is below the industry average. The company faced challenges with a current EPS of 0.91. This suggests a potential decline in earnings.
Debt Management: With a below-average debt-to-equity ratio of 0.36, Donaldson adopts a prudent financial strategy, indicating a balanced approach to debt management.
Assessing Valuation Metrics:
-
Price to Earnings (P/E) Ratio: Donaldson’s P/E ratio of 21.49 is below the industry average, suggesting the stock may be undervalued.
-
Price to Sales (P/S) Ratio: With a P/S ratio of 2.48 below industry standards, the stock shows potential undervaluation, making it an appealing investment option for those focusing on sales performance.
-
EV/EBITDA Analysis (Enterprise Value to its Earnings Before Interest, Taxes, Depreciation & Amortization): The company’s EV/EBITDA ratio 13.81 is below the industry average, indicating that it may be relatively undervalued compared to peers.
Market Capitalization Analysis: Positioned below industry benchmarks, the company’s market capitalization faces constraints in size. This could be influenced by factors such as growth expectations or operational capacity.
Now trade stocks online commission free with Charles Schwab, a trusted and complete investment firm.
Why Insider Activity Matters in Finance
Insider transactions, although significant, should be considered within the larger context of market analysis and trends.
In the realm of legality, an “insider” is defined as any officer, director, or beneficial owner holding more than ten percent of a company’s equity securities under Section 12 of the Securities Exchange Act of 1934. This includes executives in the c-suite and major hedge funds. These insiders are required to disclose their transactions through a Form 4 filing, to be submitted within two business days of the transaction.
Notably, when a company insider makes a new purchase, it is considered an indicator of their positive expectations for the stock.
Conversely, insider sells may not necessarily signal a bearish stance on the stock and can be motivated by various factors.
Unlocking the Meaning of Transaction Codes
Examining transactions, investors often concentrate on those unfolding in the open market, meticulously detailed in Table I of the Form 4 filing. A P in Box 3 denotes a purchase, while S signifies a sale. Transaction code C indicates the conversion of an option, and transaction code A denotes a grant, award, or other acquisition of securities from the company.
Check Out The Full List Of Donaldson’s Insider Trades.
Insider Buying Alert: Profit from C-Suite Moves
Benzinga Edge reveals every insider trade in real-time. Don’t miss the next big stock move driven by insider confidence. Unlock this ultimate sentiment indicator now. Click here for access.
This article was generated by Benzinga’s automated content engine and reviewed by an editor.
© 2024 Benzinga.com. Benzinga does not provide investment advice. All rights reserved.
THOR & Harbinger Introduce World's First Hybrid Class A Motorhome
THOR Industries, Inc. THO has solidified its leadership in recreational vehicle (RV) innovation by introducing the THOR Test Vehicle, the world’s first hybrid Class A motorhome. Built on an electric vehicle platform developed in collaboration with EV manufacturer Harbinger, the vehicle features a low-emissions gasoline range extender capable of recharging the battery system, with an estimated range of 500 miles.
The hybrid RVs will be available in 2025 through the THOR family of companies and are expected to meet Near-Zero Emission Vehicle standards under Advanced Clean Truck legislation adopted by the California Air Resources Board. Per Bob Martin, president and CEO of THOR Industries, the innovative hybrid platform and the ongoing partnership with Harbinger underscore THOR’s leadership and introduce significant product differentiation.
The THOR Test Vehicle is uniquely designed for RV range requirements, exclusively for THOR. This is the first electrified chassis specifically tailored for Class A motorhomes. This platform aims to reduce range anxiety while enhancing travel freedom and sustainability. The hybrid chassis is powered by a 140-kWh battery pack, supplemented by a gasoline range extender and solar rooftop. Its 800-volt electrical system enables fast charging at DC Fast Charger stations, which aids extended travel. Charging can also occur at campsites, through the range extender, or via solar energy to provide flexibility for both on-road and off-grid use.
The hybrid platform can serve as a backup power source for homes and may eventually allow users to sell excess energy back to the grid. The electric powertrain delivers exceptional acceleration and torque, providing up to twice the torque of a diesel engine, ensuring strong highway performance on mountain roads and tough terrain. Harbinger’s chassis design includes all the core systems of an EV, such as the drivetrain, high-voltage battery system, steering and brakes. With a double-wishbone front suspension, a steer-by-wire system and an advanced driver assistance system, the chassis ensures a smooth and safe ride, even for large vehicles.
The THOR Test Vehicle is available for test drives by RV dealers on the THOR RV Experience Track at the Elkhart Dealer Open House, the largest dealer event in North America, from Monday, Sept. 23, 2024, in Elkhart, IN. Dealers will get to experience this future-forward RV and contribute to its market launch.
THO’s Zacks Rank & Key Picks
THO currently carries a Zacks Rank #3 (Hold).
Some better-ranked stocks in the auto space are Dorman Products, Inc. DORM, Blue Bird Corporation BLBD and Douglas Dynamics, Inc. PLOW, each sporting a Zacks Rank #1 (Strong Buy) at present.
The consensus estimate for DORM’s 2024 sales and earnings suggests year-over-year growth of 3.71% and 35.46%, respectively. EPS estimates for 2024 and 2025 have improved 51 cents and 37 cents, respectively, in the past 60 days.
The Zacks Consensus Estimate for BLBD’s 2024 sales and earnings suggests year-over-year growth of 17.58% and 215.89%, respectively. EPS estimates for 2024 and 2025 have improved 65 cents and 80 cents, respectively, in the past 60 days.
The Zacks Consensus Estimate for PLOW’s 2024 earnings suggests year-over-year growth of 60.4%. EPS estimates for 2024 have improved 15 cents in the past 60 days.
Market News and Data brought to you by Benzinga APIs
© 2024 Benzinga.com. Benzinga does not provide investment advice. All rights reserved.
Behind the Scenes of Celsius Holdings's Latest Options Trends
Financial giants have made a conspicuous bullish move on Celsius Holdings. Our analysis of options history for Celsius Holdings CELH revealed 18 unusual trades.
Delving into the details, we found 55% of traders were bullish, while 38% showed bearish tendencies. Out of all the trades we spotted, 13 were puts, with a value of $875,933, and 5 were calls, valued at $231,010.
What’s The Price Target?
Analyzing the Volume and Open Interest in these contracts, it seems that the big players have been eyeing a price window from $22.5 to $50.0 for Celsius Holdings during the past quarter.
Volume & Open Interest Development
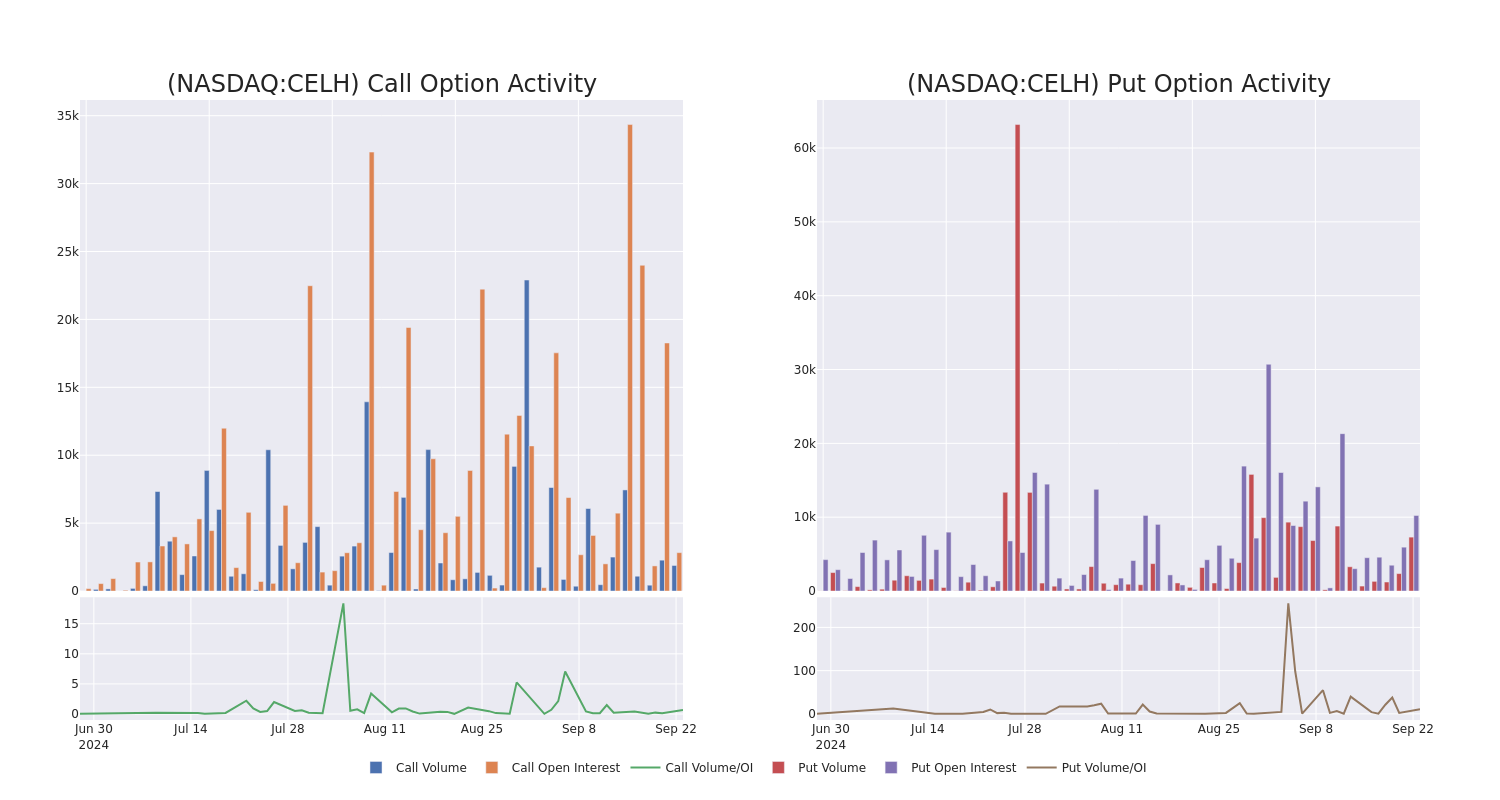
Looking at the volume and open interest is a powerful move while trading options. This data can help you track the liquidity and interest for Celsius Holdings’s options for a given strike price. Below, we can observe the evolution of the volume and open interest of calls and puts, respectively, for all of Celsius Holdings’s whale trades within a strike price range from $22.5 to $50.0 in the last 30 days.
Celsius Holdings Option Volume And Open Interest Over Last 30 Days
Largest Options Trades Observed:
| Symbol | PUT/CALL | Trade Type | Sentiment | Exp. Date | Ask | Bid | Price | Strike Price | Total Trade Price | Open Interest | Volume |
|---|---|---|---|---|---|---|---|---|---|---|---|
| CELH | PUT | SWEEP | BULLISH | 10/18/24 | $1.98 | $1.95 | $1.95 | $32.00 | $97.5K | 13 | 43 |
| CELH | PUT | SWEEP | BULLISH | 03/21/25 | $4.7 | $4.55 | $4.6 | $30.00 | $92.4K | 3.0K | 964 |
| CELH | PUT | SWEEP | BULLISH | 11/15/24 | $0.43 | $0.42 | $0.43 | $22.50 | $89.7K | 16.0K | 4.6K |
| CELH | PUT | SWEEP | BULLISH | 03/21/25 | $7.45 | $7.4 | $7.4 | $35.00 | $83.6K | 1.4K | 140 |
| CELH | PUT | SWEEP | BEARISH | 03/21/25 | $4.55 | $4.5 | $4.55 | $30.00 | $75.9K | 3.0K | 374 |
About Celsius Holdings
Celsius Holdings plays in the energy drink subsegment of the global nonalcoholic beverage market, with 96% of revenue concentrated in North America. Celsius’ products contain natural ingredients and a metabolism-enhancing formulation, appealing to fitness and active lifestyle enthusiasts. The firm’s portfolio includes its namesake Celsius Originals beverages (including those that are naturally caffeinated with stevia), Celsius Essentials line (containing aminos), and Celsius On-the-Go powder packets. Celsius dedicates its efforts to branding and innovation, while it utilizes third parties for the manufacturing, packaging, and distribution of its products. In 2022, Celsius forged a 20-year distribution agreement with PepsiCo, which holds an 8.5% stake in the business.
Following our analysis of the options activities associated with Celsius Holdings, we pivot to a closer look at the company’s own performance.
Current Position of Celsius Holdings
- With a trading volume of 7,693,574, the price of CELH is down by -3.35%, reaching $31.7.
- Current RSI values indicate that the stock is may be oversold.
- Next earnings report is scheduled for 42 days from now.
Expert Opinions on Celsius Holdings
5 market experts have recently issued ratings for this stock, with a consensus target price of $40.4.
Unusual Options Activity Detected: Smart Money on the Move
Benzinga Edge’s Unusual Options board spots potential market movers before they happen. See what positions big money is taking on your favorite stocks. Click here for access.
* An analyst from Stifel persists with their Buy rating on Celsius Holdings, maintaining a target price of $51.
* Maintaining their stance, an analyst from Maxim Group continues to hold a Buy rating for Celsius Holdings, targeting a price of $50.
* An analyst from Roth MKM persists with their Buy rating on Celsius Holdings, maintaining a target price of $45.
* An analyst from Truist Securities has decided to maintain their Hold rating on Celsius Holdings, which currently sits at a price target of $30.
* An analyst from B of A Securities has decided to maintain their Underperform rating on Celsius Holdings, which currently sits at a price target of $26.
Trading options involves greater risks but also offers the potential for higher profits. Savvy traders mitigate these risks through ongoing education, strategic trade adjustments, utilizing various indicators, and staying attuned to market dynamics. Keep up with the latest options trades for Celsius Holdings with Benzinga Pro for real-time alerts.
Market News and Data brought to you by Benzinga APIs
© 2024 Benzinga.com. Benzinga does not provide investment advice. All rights reserved.
Fluorspar Market Size on Track for USD 2.4 Billion by 2034 with a 2.5% CAGR, Boosted by Growth in Electric Vehicles and Battery Production| Analysis by Transparency Market Research, Inc.
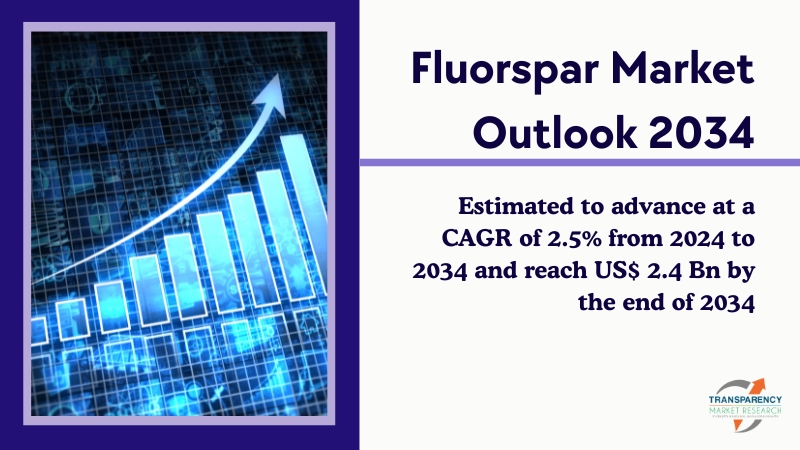
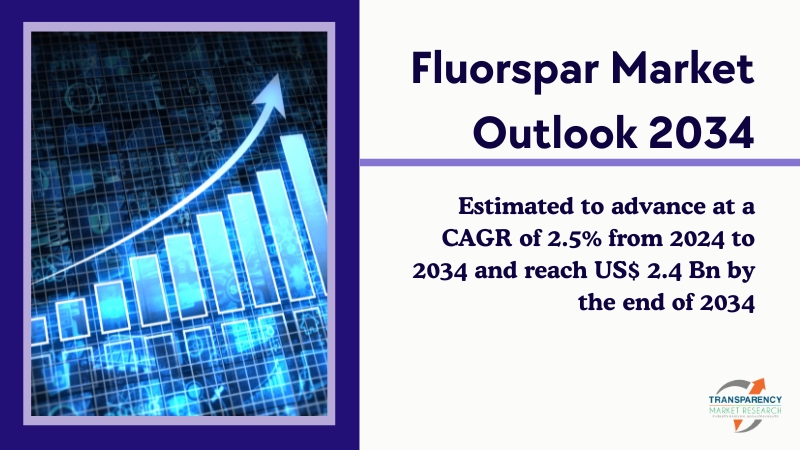
Wilmington, Delaware, United States, Transparency Market Research, Inc. , Sept. 24, 2024 (GLOBE NEWSWIRE) — The global fluorspar market (سوق الفلورسبار) is estimated to surge at a CAGR of 2.5% from 2024 to 2034. Transparency Market Research projects that the overall sales revenue for fluorspar is estimated to reach US$ 2.4 billion by the end of 2034.
The burgeoning demand for fluorspar in the pharmaceutical and healthcare industries is gaining momentum. Fluorspar derivatives play a crucial role in manufacturing pharmaceuticals, fluorinated drugs, and diagnostic agents, driving market growth in this sector. The increasing application of fluorspar in the production of lithium-ion batteries is a notable trend. With the rise of electric vehicles and renewable energy storage solutions, fluorspar-based materials are utilized in battery electrolytes and electrodes, creating new avenues for market expansion.
The growing utilization of fluorspar in the glass and ceramics industry is a significant driver. Fluorspar enhances the optical properties and durability of glass products, making it indispensable in architectural glass, fiberglass, and specialty ceramics production. The emergence of fluorspar as a fluxing agent in the metallurgical industry is contributing to market growth. It aids in the removal of impurities and improves the efficiency of metal smelting processes, particularly in steel and aluminum production.
Geopolitical factors and trade policies affecting fluorspar supply chains are increasingly influencing market dynamics, emphasizing the need for diversification and strategic planning among industry stakeholders. These evolving trends underscore the multifaceted nature of the fluorspar market and the importance of adapting to emerging opportunities and challenges.
Unlock Growth Potential in Your Industry! Download PDF Brochure: https://www.transparencymarketresearch.com/fluorspar-market.html
Key Findings of the Market Report
- Acidspar leads the fluorspar market due to its predominant use in the production of hydrofluoric acid, a vital component in various industries.
- Aluminum production emerges as the leading application segment in the fluorspar market due to its extensive use in smelting processes.
- Asia Pacific emerges as the leading region segment in the fluorspar market, driven by robust industrial growth and expanding applications.
Fluorspar Market Growth Drivers & Trends
- Increasing demand for fluorspar in the production of aluminum, steel, and hydrofluoric acid drives market growth.
- Growth in the construction and automotive industries amplifies the need for fluorspar-based products.
- Technological advancements enhance fluorspar mining and processing efficiencies, boosting market expansion.
- Rising adoption of fluoropolymers in electronics and automotive sectors contributes to market growth.
- Exploration of new fluorspar deposits and sustainable mining practices foster market development and resilience.
Global Fluorspar Market: Regional Profile
- In North America, the United States stands as a major consumer and producer of fluorspar, driven primarily by the demand from the chemical, steel, and aluminum industries. The region benefits from robust infrastructure and technological advancements, supporting efficient extraction and processing operations.
- Europe, on the other hand, showcases a balanced market with significant consumption in industries like metallurgy, ceramics, and chemicals. Countries like Germany and the UK lead in fluorspar consumption, supported by stringent environmental regulations that prioritize sustainable mining practices.
- In Asia Pacific, China emerges as a dominant force, both in terms of production and consumption of fluorspar. The region’s burgeoning industrial sector, particularly in steel, aluminum, and cement production, fuels substantial demand for fluorspar. Countries like India and Japan contribute significantly to the market dynamics, driven by rapid urbanization and infrastructure development projects.
Email Directly Here with Detail Information: sales@transparencymarketresearch.com
Fluorspar Market: Competitive Landscape
In the competitive landscape of the fluorspar market, key players such as Mexichem, China Kings Resources Group Co., Ltd., and British Fluorspar Ltd. dominate with their extensive mining operations and global distribution networks. These companies compete on factors such as product quality, pricing, and geographical reach to maintain their market share.
Emerging players like Masan Group and Mongolrostsvetmet LLC are gaining traction by focusing on sustainable mining practices and product innovation. Strategic collaborations, mergers, and acquisitions are common tactics employed by industry leaders to strengthen their foothold in the competitive fluorspar market and capitalize on emerging opportunities. Some prominent players are as follows:
- Orbia
- MINERSA GROUP
- Kenta Fluorspar Company Ltd.
- Centralfluor Industries Group Inc.
- Zhejiang Wuyi Shenlong Floataion Co Ltd.
- Seaforth Mineral & Ore Co. Inc.
- China Kings Resources Group Co. Ltd.
- British Fluorspar Ltd.
- Mongolrostsvetmet LLC
- Masan Group
Product Portfolio
- British Fluorspar Ltd. specializes in the extraction and processing of high-quality fluorspar. With a focus on sustainability and innovation, they deliver premium-grade fluorspar products to diverse industries worldwide, ensuring superior performance and reliability in applications ranging from metallurgy to pharmaceuticals.
- Mongolrostsvetmet LLC is a leading producer and exporter of Mongolian fluorspar. Committed to excellence and sustainability, they provide top-quality fluorspar products to global markets. With state-of-the-art facilities and stringent quality control measures, they meet the stringent requirements of various industries, ensuring customer satisfaction.
- Masan Group is a prominent supplier of fluorspar and other minerals, offering a wide range of high-quality products to meet diverse industrial needs. With a focus on technological innovation and customer satisfaction, Masan Group continues to be a trusted partner for fluorspar and mineral solutions worldwide.
Buy this Premium Research Report: https://www.transparencymarketresearch.com/checkout.php?rep_id=1858<ype=S
Fluorspar Market: Key Segments
By Product
- Acidspar
- Metspar
- Ceramic
- Others (include Optical and Lapidary Grade)
By Application
- Aluminum Production
- Steel Production
- Hydrofluoric Acid
- Others (include Concrete Additives, Lithium-ion Batteries, etc.)
By Region
- North America
- Europe
- Asia Pacific
- Latin America
- Middle East & Africa
More Trending Reports by Transparency Market Research –
- Propanol Market – The global propanol market (سوق البروبانول) is projected to advance at a CAGR of 2.6% from 2024 to 2034.
- Ethanol Market – The global ethanol market (سوق الإيثانول) is projected to expand at a CAGR of 5.3% during the forecast period from 2024 to 2034.
- Enzymes Market – The global enzymes market (سوق الانزيمات) is estimated to grow at a CAGR of 7.5% from 2024 to 2034.
- Phosphates Market– The global phosphates market (سوق الفوسفات) is expected to grow at a CAGR of 3.2% from 2024 to 2034.
About Transparency Market Research
Transparency Market Research, a global market research company registered at Wilmington, Delaware, United States, provides custom research and consulting services. Our exclusive blend of quantitative forecasting and trends analysis provides forward-looking insights for thousands of decision makers. Our experienced team of Analysts, Researchers, and Consultants use proprietary data sources and various tools & techniques to gather and analyses information.
Our data repository is continuously updated and revised by a team of research experts, so that it always reflects the latest trends and information. With a broad research and analysis capability, Transparency Market Research employs rigorous primary and secondary research techniques in developing distinctive data sets and research material for business reports.
Contact:
Transparency Market Research Inc.
CORPORATE HEADQUARTER DOWNTOWN,
1000 N. West Street,
Suite 1200, Wilmington, Delaware 19801 USA
Tel: +1-518-618-1030
USA – Canada Toll Free: 866-552-3453
Website: https://www.transparencymarketresearch.com
Email: sales@transparencymarketresearch.com
Follow Us: LinkedIn| Twitter| Blog | YouTube

Market News and Data brought to you by Benzinga APIs
© 2024 Benzinga.com. Benzinga does not provide investment advice. All rights reserved.

