Smart Energy Storage Market Size to Surpass USD 425.8 Billion by 2034, Growing at 9.0% CAGR as Digital Technologies Transform Energy Infrastructure| Analysis by Transparency Market Research Inc.
Wilmington, Delaware, United States, Transparency Market Research Inc. , Sept. 25, 2024 (GLOBE NEWSWIRE) — The global smart energy storage market (Markt für intelligente Energiespeicher) was projected to attain US$ 165 billion in 2023. It is likely to garner a 9.0% CAGR from 2024 to 2034, and by 2034, the market is expected to attain US$ 425.8 billion.
The integration of energy-efficient energy management systems, renewable energy sources, smart grids, and Internet of Things (IoT) enabled devices is revolutionizing the production, distribution, and consumption of energy. Additionally, this is spurring the rise of smart energy storage globally.
The introduction of smart energy technology has caused a major change in the energy landscape worldwide. The goal of the smart energy industry is to combine traditional energy infrastructure with state-of-the-art digital technologies to create a more responsive, sustainable, and efficient energy environment.
Flywheels, supercapacitors, batteries, and other sophisticated control and management systems are combined with a range of technologies in smart grids, advanced metering infrastructure (AMI), demand response systems, energy management systems (EMS), and Internet of Things (IoT) devices.
Get a Recently Updated Report of the Market as a Sample PDF Copy! https://www.transparencymarketresearch.com/smart-energy-storage-market.html

Key Findings of the Market Report
- Globally, the use of smart power storage systems has expanded as a result of lithium-ion battery prices falling.
- Energy storage projects are becoming more financially viable as a result of these cost reductions, which is driving up installation in a variety of applications such as microgrid solutions, grid stability, and the integration of renewable energy sources.
- IHS Markit, which subsequently merged with S&P Global, predicted in 2020 that, during the next three years, the average cost of a lithium-ion (Li-ion) battery cell will drop to $100 per kilowatt hour (kWh). By 2030, it is anticipated that the average cost of a li-ion cell will have further decreased to as low as US$ 73/kWh.
- As a result, smart energy storage applications for homes and businesses that are linked to renewable energy sources like solar, wind, or hydro are using more and more lithium-ion batteries.
Market Trends for Smart Energy Storage
- The governments of several nations are concentrating on making the transition to low-carbon energy systems in order to fight global warming and cut greenhouse gas emissions.
- By increasing grid stability, utilizing more renewable energy sources, and lowering dependency on fossil fuels, smart energy storage devices are essential to this energy shift.
- In order to lower carbon emissions and fight climate change, governments are progressively implementing policies, including renewable energy goals, carbon pricing schemes, and clean energy subsidies.
- A Memorandum of Understanding (MOU) was signed in May 2023 between EVE Energy Malaysia Sdn. Bhd. (EVE) and Pemaju Kelang Lama Sdn. Bhd. about the development of EVE’s advanced manufacturing plant in Malaysia.
Global Market for Smart Energy Storage: Regional Outlook
- In 2023, Europe held the highest share of the global market for smart energy storage, according to the most recent market data.
- Europe’s market dynamics are being driven by the growing demand for sustainable and resilient energy infrastructure, significant investments in smart grid technology, and the implementation of clean energy legislation.
- Germany’s government has set new targets for reducing its carbon impact. By 2030, 2040, and 2045, the nation hopes to reach net carbon emission reductions of 65%, 88%, and almost 0%, respectively. Along these lines, the government is taking action to decarbonize the electrical industry in order to meet its medium- and long-term climate goals.
- According to the most recent research of the smart energy storage market, North America is expected to have significant industry growth throughout the projected period.
- North America’s market share for smart energy storage is being increased by strong government backing, broad adoption of cutting-edge technology, and a greater emphasis on system modernization.
Global Smart Energy Storage Market: Competitive Landscape
Companies in the global market for smart energy storage are spending money on advanced lithium-ion smart energy storage technology research and development.
To increase system efficiency, a few major vendors are also releasing intelligent energy storage management software. The following companies are well-known participants in the global smart energy storage market:
- BYD
- Samsung
- Panasonic Holdings Corporation
- General Electric
- Siemens AG
- ABB
- Beacon
- Toshiba Corporation
Key developments by the players in this market are:
- Itron Inc. announced in May 2022 that it will be expanding its long-term partnership with Microsoft in order to hasten the adoption of cloud computing and the next generation of grid-edge and consumer solutions for the utility and smart city industries.
- The first solution GE Digital revealed in March 2022 to fuel the energy transition came from its acquisition of Opus One Solutions. In order to support utilities on their journey toward Distributed Energy Resources (DERs) and maintain a safe, secure, and resilient grid while promoting energy affordability alongside customer participation in power generation/contribution, Opus One DERMS is intended to be an end-to-end modular DERMS.
Elevate Your Business Strategy! Purchase the Report for Market-Driven Insights: https://www.transparencymarketresearch.com/checkout.php?rep_id=86007<ype=S
Global Smart Energy Storage Market Segmentation
Type
- Lead Acid
- Nickel Cadmium
- Nickel-Metal Hydride
- Lithium-ion
- Others
End Use
- Consumer Electronics
- Renewable Energy
- Automotive
- Industrial
- Defense
- Others
Region
- North America
- Latin America
- Europe
- Asia Pacific
- Middle East & Africa
Explore Transparency Market Research Inc. Extensive Coverage On Energy and Natural Resources Domain:
- Algae Fuel Market – The algae fuel industry (Algenbrennstoffindustrie) was valued at US$ 2.7 million in 2022. A CAGR of 8.8% is projected from 2023 to 2031, and the market is expected to reach US$ 5.7 million.
- Floating Power Plant Market – The global floating power plants market (Markt für schwimmende Kraftwerke) generated US$ 343.9 billion in 2022. TMR estimates the floating power plant market to reach US$603.1 billion by 2031. A CAGR of 6.2% is predicted for the market through 2031.
- U.S. Residential Generators Market – The united states residential generators market is estimated to grow at a CAGR of 4.5% from 2024 to 2034.
- Metal-air Battery Market – The global metal-air battery market (Markt für Metall-Luft-Batterien) is estimated to advance at a CAGR of 12.4% from 2024 to 2034.
About Transparency Market Research
Transparency Market Research, a global market research company registered at Wilmington, Delaware, United States, provides custom research and consulting services. Our exclusive blend of quantitative forecasting and trends analysis provides forward-looking insights for thousands of decision makers. Our experienced team of Analysts, Researchers, and Consultants use proprietary data sources and various tools & techniques to gather and analyses information.
Our data repository is continuously updated and revised by a team of research experts, so that it always reflects the latest trends and information. With a broad research and analysis capability, Transparency Market Research employs rigorous primary and secondary research techniques in developing distinctive data sets and research material for business reports.
Contact:
Transparency Market Research Inc.
CORPORATE HEADQUARTER DOWNTOWN,
1000 N. West Street,
Suite 1200, Wilmington, Delaware 19801 USA
Tel: +1-518-618-1030
USA – Canada Toll Free: 866-552-3453
Website: https://www.transparencymarketresearch.com
Email: sales@transparencymarketresearch.com
Follow Us: LinkedIn| Twitter| Blog | YouTube

Market News and Data brought to you by Benzinga APIs
© 2024 Benzinga.com. Benzinga does not provide investment advice. All rights reserved.
Drake-Related Meme Coin WYNN: From $85M Market Cap To $1.5M—The Dogecoin And Shiba Inu Dreams Are Over
Few tokens have experienced the meteoric rise and fall as quickly as WYNN WYNN/USD, a meme coin launched in January this year.
Initially, WYNN surged to an all-time high (ATH) market cap of $85 million, driven in part by social media buzz and a reported indirect endorsement from artist Drake.
However, as of now, WYNN’s market cap has plummeted to $1.5 million, according to data from DexScreener.
How It Started: The Rise Of WYNN
Back in January, the meme coin caught the attention of the crypto community, fueled by a sudden spike in mentions across social platforms.
WYNN climbed from under $1 million to $5 million in just two days, reaching an ATH of $85 million soon after.
The token’s rapid ascent was linked to Drake-related memes and a viral tweet from a prominent crypto influencer.
The surge in popularity led to speculation that WYNN could rival other meme coins like Dogecoin DOGE/USD and Shiba Inu SHIB/USD, bolstered by several social media accounts actively discussing its rise.
How It’s Going: A Sharp Decline
Fast forward to today, and the situation has changed dramatically. With a current market cap of $1.5 million, WYNN’s significant drop underscores the volatility typical of meme coins.

Also Read: Anthony Scaramucci Says SEC Chair Gary Gensler Should ‘Resign For The Sake Of The Country’
The question remains whether WYNN will regain its former glory or fade into obscurity, but it continues to compete with other meme tokens on the Solana SOL/USD blockchain, including newer entrants like Bonk BONK/USD and Myro MYRO/USD.
A Trend To Watch: Celebrity Influence In Crypto
The rise and fall of WYNN highlights the power of celebrity influence in the cryptocurrency market, but also the risks involved.
Drake’s indirect involvement helped WYNN gain traction, but without sustained institutional or retail interest, the token’s momentum waned.
Nonetheless, WYNN may not be the last meme coin to see a surge driven by celebrity endorsements.
As the conversation around digital assets continues to evolve, topics like meme coin volatility and celebrity influence will be a focal point at Benzinga’s Future of Digital Assets event on Nov. 19, where industry leaders and policymakers will discuss the role of cryptocurrencies in finance and politics.
Read Next:
Market News and Data brought to you by Benzinga APIs
© 2024 Benzinga.com. Benzinga does not provide investment advice. All rights reserved.
Insider Move: Matthew E Korenberg Exercises Options, Realizing $704K At Ligand Pharmaceuticals
A large exercise of company stock options by Matthew E Korenberg, President & COO at Ligand Pharmaceuticals LGND was disclosed in a new SEC filing on September 24, as part of an insider exercise.
What Happened: Korenberg, President & COO at Ligand Pharmaceuticals, exercised stock options for 14,754 shares of LGND stock. This information was disclosed in a Form 4 filing with the U.S. Securities and Exchange Commission on Tuesday. The exercise price of the options was $51.8 per share.
Ligand Pharmaceuticals shares are trading down 0.73% at $98.81 at the time of this writing on Wednesday morning. Since the current price is $98.81, this makes Korenberg’s 14,754 shares worth $704,336.
Get to Know Ligand Pharmaceuticals Better
Ligand Pharmaceuticals Inc is a biopharmaceutical company focused on developing and acquiring technologies that aid in creating medicine. The company has partnerships and license agreements with various pharmaceutical and biotechnology companies. Ligand’s business model is based on drug discovery, early-stage drug development, product reformulation, and partnerships. The company’s revenue consists of three primary elements: royalties from commercialized products, license and milestone payments, and sale of its trademarked Captisol material.
Financial Insights: Ligand Pharmaceuticals
Revenue Growth: Ligand Pharmaceuticals’s revenue growth over a period of 3 months has been noteworthy. As of 30 June, 2024, the company achieved a revenue growth rate of approximately 57.52%. This indicates a substantial increase in the company’s top-line earnings. When compared to others in the Health Care sector, the company excelled with a growth rate higher than the average among peers.
Key Profitability Indicators:
-
Gross Margin: The company maintains a high gross margin of 93.0%, indicating strong cost management and profitability compared to its peers.
-
Earnings per Share (EPS): Ligand Pharmaceuticals’s EPS lags behind the industry average, indicating concerns and potential challenges with a current EPS of -2.88.
Debt Management: Ligand Pharmaceuticals’s debt-to-equity ratio is below the industry average. With a ratio of 0.01, the company relies less on debt financing, maintaining a healthier balance between debt and equity, which can be viewed positively by investors.
Valuation Overview:
-
Price to Earnings (P/E) Ratio: With a lower-than-average P/E ratio of 42.68, the stock indicates an attractive valuation, potentially presenting a buying opportunity.
-
Price to Sales (P/S) Ratio: With a relatively high Price to Sales ratio of 13.39 as compared to the industry average, the stock might be considered overvalued based on sales performance.
-
EV/EBITDA Analysis (Enterprise Value to its Earnings Before Interest, Taxes, Depreciation & Amortization): At 17.99, the company’s EV/EBITDA ratio outperforms industry norms, reflecting positive market perception. This positioning indicates optimistic expectations for the company’s future performance.
Market Capitalization Analysis: Falling below industry benchmarks, the company’s market capitalization reflects a reduced size compared to peers. This positioning may be influenced by factors such as growth expectations or operational capacity.
Now trade stocks online commission free with Charles Schwab, a trusted and complete investment firm.
Unmasking the Significance of Insider Transactions
It’s important to note that insider transactions alone should not dictate investment decisions, but they can provide valuable insights.
From a legal standpoint, the term “insider” pertains to any officer, director, or beneficial owner holding more than ten percent of a company’s equity securities as outlined in Section 12 of the Securities Exchange Act of 1934. This encompasses executives in the c-suite and significant hedge funds. These insiders are mandated to inform the public of their transactions through a Form 4 filing, to be submitted within two business days of the transaction.
A company insider’s new purchase is a indicator of their positive anticipation for a rise in the stock.
While insider sells may not necessarily reflect a bearish view and can be motivated by various factors.
Transaction Codes Worth Your Attention
Digging into the details of stock transactions, investors frequently turn their attention to those taking place in the open market, as outlined in Table I of the Form 4 filing. A P in Box 3 indicates a purchase, while S signifies a sale. Transaction code C signals the conversion of an option, and transaction code A denotes a grant, award, or other acquisition of securities from the company.
Check Out The Full List Of Ligand Pharmaceuticals’s Insider Trades.
Insider Buying Alert: Profit from C-Suite Moves
Benzinga Edge reveals every insider trade in real-time. Don’t miss the next big stock move driven by insider confidence. Unlock this ultimate sentiment indicator now. Click here for access.
This article was generated by Benzinga’s automated content engine and reviewed by an editor.
Market News and Data brought to you by Benzinga APIs
© 2024 Benzinga.com. Benzinga does not provide investment advice. All rights reserved.
Automatic Boarding Gates Market to Reach $132.8 Million, Globally, by 2032 at 5.1% CAGR: Allied Market Research
Wilmington, Delaware, Sept. 25, 2024 (GLOBE NEWSWIRE) — Allied Market Research published a report, titled, “Automatic Boarding Gates Market by Type (Single Unit Gates and Multiple Unit Gates), Technology (Biometrics, Bar Code Reader, Electronic Ticketing, Computer Vision, RFID, Others) and End User (Airports, Railways, Bus Terminals and Sports Stadiums): Global Opportunity Analysis and Industry Forecast, 2024-2032″. According to the report, the automatic boarding gates market was valued at $85.1 million in 2023, and is estimated to reach $132.8 million by 2032, growing at a CAGR of 5.1% from 2024 to 2032.
Prime determinants of growth
The automatic boarding gates market’s growth is primarily driven by rising air passenger traffic, technological advancements in biometrics and RFID, and heightened security demands. In addition, the need for efficiency and reduced wait times at airports has also increased the adoption. The push for contactless solutions due to health concerns, alongside significant investments in airport infrastructure modernization, further fuels this market. These factors collectively enhance the boarding experience, streamline operations, and meet evolving passenger expectations, propelling market expansion.
Download PDF Sample Copy: https://www.alliedmarketresearch.com/request-sample/A37158
Report coverage & details:
| Report Coverage | Details |
| Forecast Period | 2024–2032 |
| Base Year | 2023 |
| Market Size in 2023 | $85.1 million |
| Market Size in 2032 | $132.8 million |
| CAGR | 5.1% |
| No. of Pages in Report | 220 |
| Segments Covered | Type, Technology, End User, and Region. |
| Drivers | Increasing passenger traffic Heightened focus on airport security Increase in demand for streamlined boarding processes |
| Opportunities | Expansion in developing regions with growing air travel infrastructure Advanced biometric technologies offering |
| Restraint | High Initial Investment |
The multiple unit gates segment is expected to exhibit fastest growth throughout the forecast period
By type, the multiple unit gates segment is anticipated to experience faster growth in the automatic boarding gates machines market, due to its ability to handle higher passenger throughput, enhanced security features, and integration of advanced biometric technologies. This segment supports airport modernization efforts by offering flexibility and scalability, essential for accommodating increasing passenger volumes. Additionally, the demand for efficient, contactless boarding processes drives adoption, making multiple unit gates a preferred choice for improving operational efficiency and passenger experience at airports.
Buy This Research Report (220 Pages PDF with Insights, Charts, Tables, Figures): https://bit.ly/4gBeMc1
The biometrics segment is expected to grow faster throughout the forecast period
By technology, the biometrics segment is anticipated to experience faster growth in the automatic boarding gates market. This growth is driven by its ability to enhance security, streamline passenger processing, and meet the growing demand for contactless solutions. Advancements in biometric technologies, such as facial recognition and fingerprint scanning, improve accuracy and efficiency. Additionally, regulatory support and increasing adoption by airports aiming to modernize and enhance passenger experience drive the rapid growth of the biometrics segment in the near future.
The airports segment is expected to grow faster throughout the forecast period
By end user, the airport segment is anticipated to experience faster growth in the automatic boarding gates market. This growth is driven by increasing global passenger traffic, the need for enhanced security measures, and the demand for efficient, streamlined boarding processes. Airports are investing heavily in infrastructure modernization and advanced technologies, including biometrics and contactless solutions, to improve passenger experience and operational efficiency. Additionally, regulatory requirements for stringent security and the push for innovation in passenger handling further propel the rapid growth of this segment.
Asia-Pacific is expected to grow faster throughout the forecast period
By region, Europe accounted for the highest market share in 2023. However, Asia-Pacific is anticipated to grow faster in the forecast period due to rapid urbanization, increasing air passenger traffic, and substantial investments in airport infrastructure and technology. Governments in countries like China, India, and Southeast Asia are prioritizing the modernization of transportation hubs, driving the adoption of advanced boarding gate technologies such as biometrics and RFID. These efforts aim to enhance operational efficiency, security measures, and overall passenger experience amidst the region’s economic expansion and rising middle-class travel demands.
Inquire Before Buying: https://www.alliedmarketresearch.com/purchase-enquiry/A37158
Players: –
- Collins Aerospace (Raytheon Technologies Corporation)
- Kaba (Dormakaba Holding AG)
Trending Reports in Related Industry
About Us:
Allied Market Research (AMR) is a full-service market research and business-consulting wing of Allied Analytics LLP based in Wilmington, Delaware. Allied Market Research provides global enterprises as well as medium and small businesses with unmatched quality of “Market Research Reports” and “Business Intelligence Solutions.” Allied Market Research has a targeted view to provide business insights and consulting to assist its clients to make strategic business decisions and achieve sustainable growth in their respective market domain.
We are in professional corporate relations with various companies, and this helps us in digging out market data that helps us generate accurate research data tables and confirms utmost accuracy in our market forecasting. Allied Market Research CEO Pawan Kumar is instrumental in inspiring and encouraging everyone associated with the company to maintain high quality of data and help clients in every way possible to achieve success. Each and every data presented in the reports published by us is extracted through primary interviews with top officials from leading companies of domain concerned. Our secondary data procurement methodology includes deep online and offline research and discussion with knowledgeable professionals and analysts in the industry.
Contact us:
United States
1209 Orange Street,
Corporation Trust Center,
Wilmington, New Castle,
Delaware 19801 USA.
Int’l: +1-503-894-6022
Toll Free: +1-800-792-5285
Fax: +1-800-792-5285
help@alliedmarketresearch.com

© 2024 Benzinga.com. Benzinga does not provide investment advice. All rights reserved.
The New Shark Tank Star Replacing Mark Cuban Once Made A $220 Million Blunder That Grew His Startup Into A $5 Billion Powerhouse
Daniel Lubetzky, the founder of KIND Snacks, is joining the panel of regular sharks on “Shark Tank” replacing Mark Cuban. But before becoming a business mogul, Lubetzky made a risky $220 million move that almost cost him his company. It turned out to be the best decision he ever made.
Back in 2008, KIND was still a small player in the snack industry. Lubetzky had just taken a $16 million investment from a private equity firm, VMG Partners. The deal was that he had to sell the company within five years. It seemed like a solid plan then but things turned unexpectedly.
Don’t Miss:
“Four years into the deal, I was realizing that Kind could become so much bigger,” he recalled to CNBC. Sales were up and Lubetzky felt the company had much more potential. But his investors were eager to cash out, pressuring him to sell. Instead of giving in, Lubetzky decided to buy back their shares. The problem was, he needed $220 million to do it.
The Gamble of a Lifetime
This was no small feat. Lubetzky had to scrape together company cash and take on millions in bank loans to make it happen. “Because I hadn’t pre-negotiated the terms for buying them out, it turned out to be very, very expensive – and very risky. It was a very painful negotiation,” he said.
Trending: Unlock the hidden potential of commercial real estate — This platform allows individuals to invest in commercial real estate offering a 12% target yield with a bonus 1% return boost today!
He could have lost everything if KIND’s sales had dropped even slightly. He had sleepless nights knowing that any misstep could result in losing the company he’d built from scratch.
But Lubetzky believed in KIND and decided to leap. “I felt like we were just getting started,” he said. He was right. The company’s annual sales nearly doubled that year, setting the stage for what would come next.
Lubetzky transformed his $220 million gamble into a tremendous win. By the time he decided to sell KIND to Mars in 2020, the firm had amassed an astounding $5 billion valuation. He attributes KIND’s success to his decision to purchase back his company.
Trending: This investment company boasts a 35.14% internal rate of return (IRR) for its realized projects, allowing accredited investors to earn passive returns and avoid the headaches of being a landlord.
“If we had sold back in 2013, KIND might have gotten lost inside a big corporation,” he explained. Instead, he kept the company independent and, as a result, it grew into one of the world’s most recognized healthy snack brands.
He wishes he knew back then that when you negotiate with a private equity firm, it’s not “their way or the highway.” When you bring investors into your company, it’s no longer completely yours. “You need to remember that it’s now a company that you and others own,” Lubetzky shares.
As the new regular on “Shark Tank,” Lubetzky will bring this same boldness and entrepreneurial spirit to the show.
See Also: Founder of Personal Capital and ex-CEO of PayPal re-engineers traditional banking with this new high-yield account — start saving better today.
Why Mark Cuban Left
After more than 10 years as a regular on the program, Mark Cuban decided to leave “Shark Tank” in order to spend more time with his family. Having balanced business endeavors and TV appearances for years, he now desired to devote himself to spending more time with his wife and three kids before they left to pursue their own lives.
Read Next:
Up Next: Transform your trading with Benzinga Edge’s one-of-a-kind market trade ideas and tools. Click now to access unique insights that can set you ahead in today’s competitive market.
Get the latest stock analysis from Benzinga?
This article The New Shark Tank Star Replacing Mark Cuban Once Made A $220 Million Blunder That Grew His Startup Into A $5 Billion Powerhouse originally appeared on Benzinga.com
© 2024 Benzinga.com. Benzinga does not provide investment advice. All rights reserved.
Agency REITs For A Bull Steepener
By Michael Lebowitz
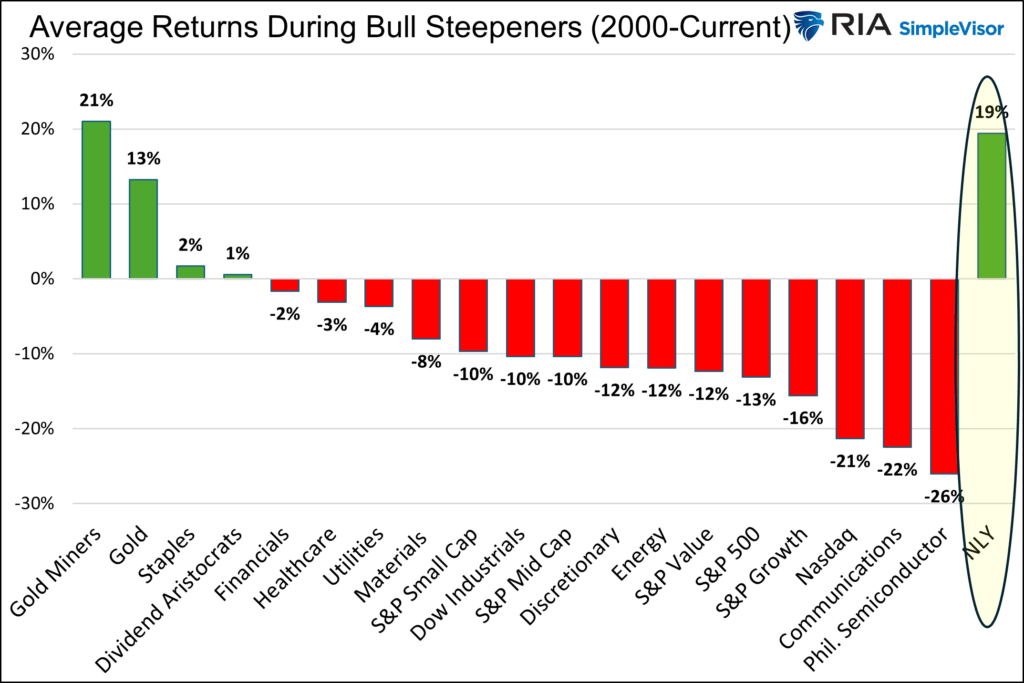
In our recent two-part series on the yield curve (Part One, Part Two) we discussed the four predominant yield curve shifts and what they imply about economic activity and monetary policy. Additionally, given the current bullish steepening trend of the yield curve, we provided data on how prior bull steepening environments impacted various stock indexes, sectors, and factors. Missing from our analysis was a discussion of a specific type of REIT whose valuations are well correlated with the shape of the yield curve. If you are buying this bull steepener, agency REITs are worth your consideration.
What Is An Agency Mortgage REIT?
REITs own, manage, or hold the debt on income-producing properties. REITs must pay out at least 90% of their taxable profits to shareholders annually. This unique legal structure makes investment analysis of REITs different than most companies. REIT investors must analyze how changing economic, financial market, and monetary policy conditions affect the interplay between their underlying assets and liabilities.
Within the REIT category are a subclass investors call agency REITs. These companies own mortgages on residential real estate. Furthermore, as connotated by the word “agency,” most of the mortgages are secured and guaranteed against default by government agencies such as Fannie Mae, Freddie Mac, and Ginnie Mae. These securities are called Mortgage-Backed Securities (MBS). Because the U.S. government owns the agencies, MBS is essentially free of credit risk.
How Agency REITs Make Money
Agency REIT earnings primarily come from three sources: the spread between the assets and liabilities (mortgage yield and debt), hedging costs, and the amount of leverage employed.
Hypothetically, let’s start a new agency REIT to help you appreciate how they operate.
- We solicit $1 billion from equity investors.
- A significant portion of the $1 billion is used to buy mortgage-backed securities (MBS).
- We then borrow $4 billion from a bank using the $1 billion of MBS as collateral.
- The proceeds from the $4 billion loan also purchase MBS.
- Our new REIT has about $5 billion of MBS against $1 billion of equity and $4 billion of debt.
- As a result, the REIT has 5x leverage.
Assuming our mortgages pay 6% and our debt costs 4%, we can make $140 million a year, equating to a 14% return for our equity holders. That handily surpasses the 6% return if leverage wasn’t employed.
The math is relatively simple. On the $1 billion of MBS funded with equity, the REIT will make 6% or $60 million. On the $4 billion of MBS funded with debt, the REIT will earn the 2% difference between the MBS and the debt, or $80 million. The total earnings of $140 million divided by the $1 billion equity stake equals 14%.
Unfortunately, managing an agency REIT is not nearly as simple as we illustrate.
The Complexities Of Agency REIT Portfolio Management
MBS are a unique type of bond. The mortgagors, homeowners, can partially or fully pay down their mortgages whenever they want. As a result of the unique prepay option, the duration of MBS varies significantly with mortgage rates. At the same time, the duration of a REIT’s liabilities are much more stable. Accordingly, the portfolio managers take on duration mismatch risk.
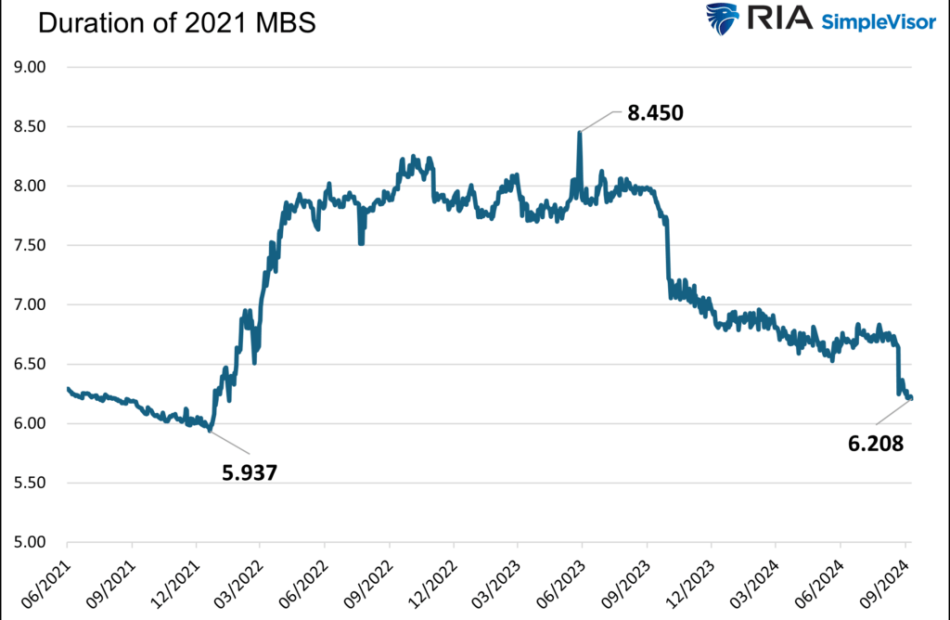
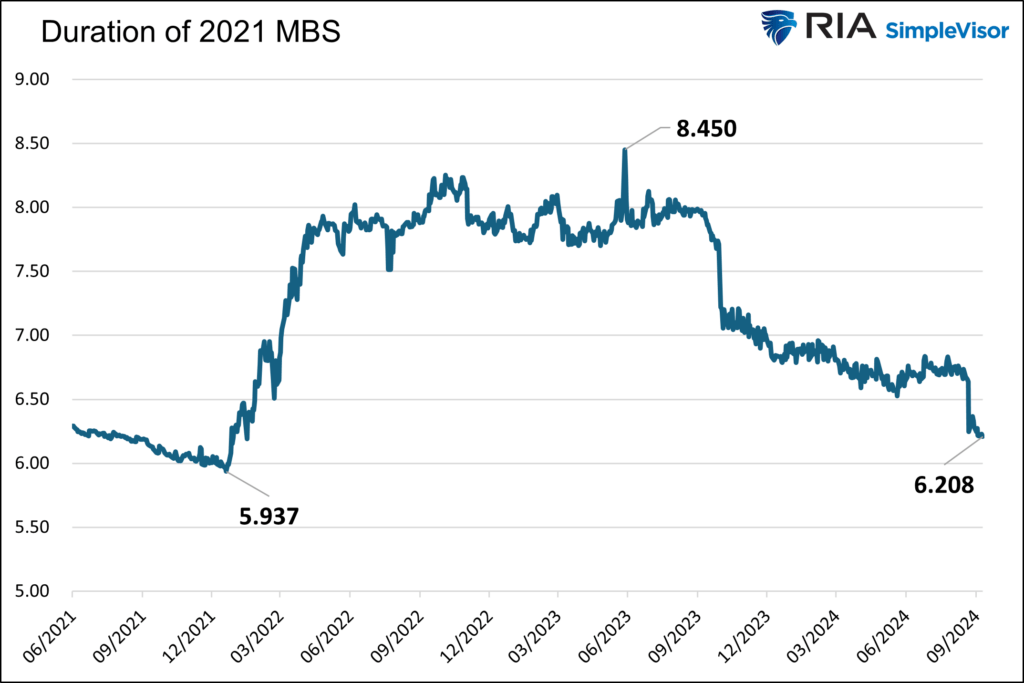
The following chart shows the duration of a Fannie Mae MBS originated in 2021. The weighted average mortgage rates of the underlying loans in the MBS are 3.36%. When rates started rising rapidly in 2022, the mortgagors had no incentive to prepay their loans. As a result, the duration of this MBS rose by 2.50 years. Since then, the duration has fallen with mortgage rates, as the odds of prepayments have increased. A duration change of 2.50 years may not seem like a lot, but when leverage is used, such a change can result in a relatively large duration mismatch and significant gains or losses.
Because the duration of our MBS varies and our liabilities are relatively constant, agency REITs are constantly hedging duration risk. Furthermore, the yield spread between MBS and Treasuries introduces spread risk. The more a REIT hedges to minimize potential duration mismatches or spread risk, the less risk they take. But the hedging costs eat into profits. Lesser hedging can produce more profits but poses more significant risks.
A Steeper Yield Curve Should Help REITs
Like banks, most agency REITs borrow for shorter terms than the duration of their assets. Creating such a mismatch in a positively sloped yield curve can result in additional profits as borrowing costs are less than asset yields.
If the bull steepener yield curve trend continues, agency REIT MBS should gain value. However, the duration of the MBS will shrink due to prepayments. New MBS replacements will have lower yields. However, funding costs should decline. There are many moving parts to consider. While the environment is conducive for profits, as we noted earlier, the performance of agency REITs comes down to hedging accumen.
Several agency REITs are worth exploring, but for demonstration purposes, we focus on the oldest and largest public agency REIT, Annaly Capital Management (NLY). RIA
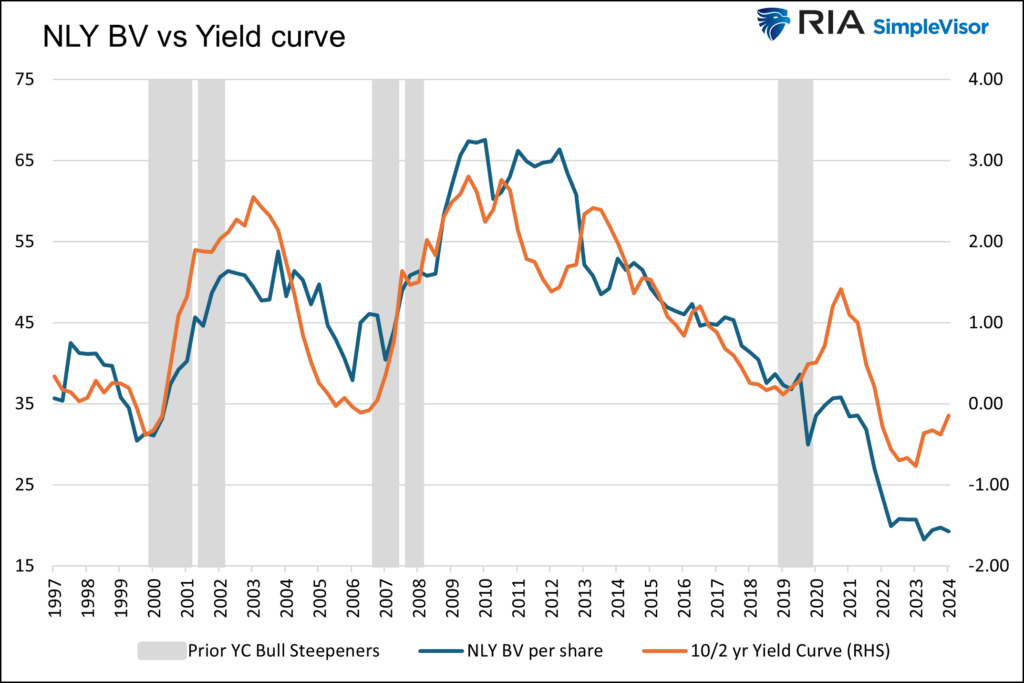
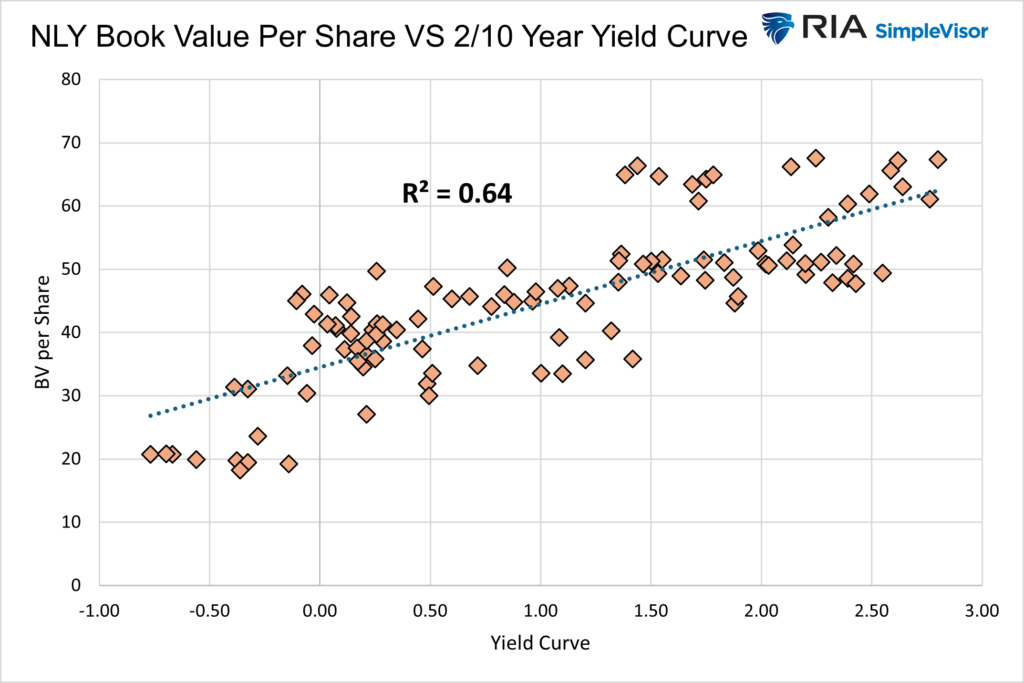
The graph below compares NLY’s book value per share with the 10/2-year yield curve. The gray bars highlight the last five persistent bull steepener periods. Its book value and the yield curve track each other closely. The high correlation is shown in the second graph.
NLY’s BV per share has risen during bull steepeners, except for 2020.
NLY has averaged a 19% return during the five latest bull steepeners. That beats every other equity asset in the graph below, except for gold miners.
No Guarantees
While NLY has done well during bull steepeners on average, it did lose 30% during the pandemic. As such, we shouldn’t take the yield curve environment for granted. However, the rare nature of the pandemic resulted in hedging difficulties due to volatile bond markets and irregular mortgagor behaviors. A repeat of similar conditions is unlikely.
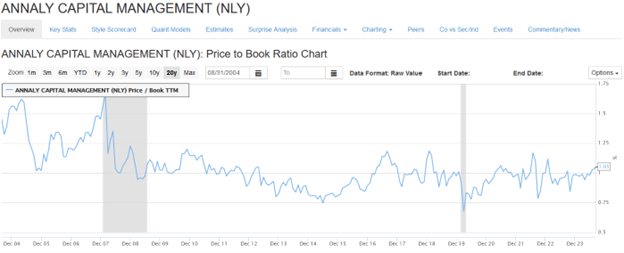
Investors should be aware of market valuations in addition to the fundamental valuation of REIT portfolios. The other reason for NLY’s steep decline in 2020 was fearful equity investors. As shown below, courtesy of Zacks, NLY’s price-to-book value fell from nearly 1.00 before the pandemic to 0.68 at the end of March 2020. Investors were fearful and discounted the stock by over 30% from its book value.
There are additional risks as follows:
- The current bull steepener ends as bond yields increase and the yield curve re-inverts. In such a scenario, book value would likely fall.
- Leverage is easy to maintain when markets are liquid; however, in 2008, REITs were forced to sell assets and reduce leverage, negatively affecting earnings and dividends.
- Management does not adequately hedge the portfolio.
Summary
Despite double-digit dividend yields in many cases and the cushion such high dividends provide, buying agency REITs is not a guaranteed home run in a bull steepener. That said, these firms offer investors a way to benefit from a steepening yield curve while avoiding an earnings slowdown that may hamper many stocks in an economic downturn.
Michael Lebowitz, CFA is an Investment Analyst and Portfolio Manager for RIA Advisors. specializing in macroeconomic research, valuations, asset allocation, and risk management. RIA Contributing Editor and Research Director. CFA is an Investment Analyst and Portfolio Manager; Co-founder of 720 Global Research.
© 2024 Benzinga.com. Benzinga does not provide investment advice. All rights reserved.
Tesla's Massive October Starts Next Week With Third-Quarter Deliveries
Tesla (TSLA) has a big October, with both its robotaxi reveal and third-quarter earnings on the calendar. However, the EV giant’s first hurdle will be when it reports global Q3 vehicle deliveries next week, with analysts projecting the third-best total ever. TSLA shares advanced Wednesday.
If it sticks to its previous third-quarter delivery report schedule, Tesla should announce the data on Wednesday, Oct. 2.
Analyst consensus has Tesla global Q3 deliveries totaling 462,000 units, up 6% vs. Q3 2023, according to FactSet. This total would represent the third-best quarterly delivery total ever for Tesla, behind Q2 2023’s 466,140 and Q4 2023’s record-setting 484,507 deliveries. Analysts project Tesla matching its record total in the fourth quarter, meaning unit sales would be flat compared to a year ago.
↑
X
Tesla’s Robotaxi Is Delayed. Will It Make A Difference For Tesla Stock?
Vehicle deliveries in the second quarter topped analyst expectations but arguably the bigger story was the quarterly performance of Tesla’s energy business.
Tesla stock jumped more than 1% to 257.02 during market action on Wednesday after gaining 1.7% to 254.27 on Tuesday — climbing further above its 50-day moving average to within around 6% of its July high.
Tesla Delivery Estimate Revisions
It is common for delivery estimates to change in the days prior to the announcement.
RBC Capital analyst Tom Narayan this week has increased his Tesla Q3 delivery view to 460,000, up from his previous 455,000 estimate. RBC Capital has an outperform rating and a 224 price target on Tesla stock.
Tesla Stock Rebounds As The Robotaxi Approaches; But What About Waymo
Meanwhile, Piper Sandler analyst Alexander Potter on Tuesday raised the firm’s price target on Tesla to 310, from 300, while increasing the Q3 delivery estimate to 459,000 units and 1.75 million vehicles in 2024.
On Monday, Barclays wrote that it expects Q3 deliveries totaling 470,000 vehicles, which is well above the consensus estimate. The firm said that Q3 volume strength will be driven almost entirely by China while Europe has been a weak spot for Tesla.
Guggenheim Securities analyst Ron Jewsikow on Sept. 20 forecast third-quarter deliveries of 456,000, slightly below the consensus view but well above the analyst’s previous estimate of 435,000.
GLJ Research analyst Gordon Johnson on Wednesday projected that Tesla’s Q3 deliveries will come in at 456,600, up from its previous forecast of 449,000. Johnson added that the buy-side “whisper” estimate is for Q3 deliveries to come in above 470,000.
Strong Quarterly Performance In China
With just one week left in the third quarter, Tesla registrations in China, a rough gauge for deliveries, are up 20% compared to last quarter and have increased more than 18% vs. a year ago.
Tesla’s China vehicle registrations in Q3 are now about 1% above its previous best quarterly performance in China, during Q4 2023.
Tesla’s year-to-date China registrations have also turned positive in recent weeks. So far in 2024, Tesla registrations in China are up 2% compared to the same time frame in 2023.
Tesla China is benefiting from continued five-year, zero-interest loans to buyers, as well as increased government subsidies for EVs. These are currently running through the end of September.
However as of Sept. 11, Tesla vehicle deliveries in Europe are down more than 16% so far this year, according to Troy Teslike, whose delivery estimates and Tesla data tracking are highly respected among retail Tesla investors.
Teslike has also posted to X in recent weeks that “Tesla is balancing out weaker U.S. sales with stronger sales in China.”
Tesla Stock Performance
TSLA shares rose 3.5% to 238.25 last week, clearing an aggressive entry of 235. TSLA stock has an official 271 buy point from a cup base, according to MarketSurge.
On Sept. 5, shares popped above their 50-day moving average, buoyed by robust China sales and the EV giant’s full self-driving rollout plans.
TSLA shares are up 20% in September after declining 7.7% in August. Tesla stock has battled back in 2024 and is now up 2% on the year, after rebounding more than 80% from a late-April low.
Tesla has a busy October ahead, with third-quarter deliveries, the robotaxi event on Oct. 10, and Q3 earnings expected to be on Oct. 16.
Tesla stock ranks third in the 35-member IBD Auto Manufacturers industry group. The stock has a 71 Composite Rating out of a best-possible 99. Shares also have an 85 Relative Strength Rating and a 57 EPS Rating.
Please follow Kit Norton on X @KitNorton for more coverage.
YOU MAY ALSO LIKE:
Is Tesla Stock A Buy Or A Sell?
Get Full Access To IBD Stock Lists And Ratings
Learning How To Pick Great Stocks? Read Investor’s Corner
AI Is Fueling A ‘Nuclear Renaissance.’ Bill Gates And Jeff Bezos Are In The Mix.
Futures: Micron Soars After Nvidia Extends Gain As Market Pauses
Fed's Favorite Inflation Data Friday Could Sway November Interest Rate Cut Odds
Market expectations for the Federal Reserve’s next interest rate move could gain more clarity as early as this Friday, when a U.S. government agency releases a key inflation metric closely monitored by policymakers.
The Personal Consumption Expenditure (PCE) price index report, scheduled for release on Friday, Sept. 27, at 8:30 a.m. ET, will provide critical insights into August’s inflation trends.
As the Fed’s preferred inflation gauge, the PCE is seen as a crucial indicator that could influence decisions on whether another rate cut will occur at the next Federal Open Market Committee (FOMC) meeting on Nov. 7.
Currently, market-implied probabilities suggest a 60% chance that the Fed will enact a back-to-back 50-basis-point rate cut in November. The remaining odds are favoring a more modest reduction of 25 basis points, as per the CME FedWatch tool. However, this outlook could shift dramatically depending on how the upcoming PCE data performs.
Fed’s Confidence In Inflation Trajectory
“I estimate that the August PCE report will be very low,” Federal Reserve Governor Christopher Waller recently said. Earlier in the month, Waller reflected on July’s PCE data, noting that the 6- and 3-month annualized rates stood at 2.6% and 1.7%, respectively.
“These numbers are good news and suggest that our restrictive policy stance has put us on the right path to attain our 2% inflation target,” he added.
These comments, alongside the Fed’s focus on achieving its inflation goal, imply that another softer inflation reading could increase the likelihood of a back-to-back 50-basis-point rate cut in November.
August PCE Report: What Do Economists Expect?
- Economist consensus, as tracked by TradingEconomics, predicts that annual headline PCE inflation will fall from 2.5% in July to 2.3% in August, marking the lowest inflation rate since February 2021.
- On a month-over-month basis, the headline figure is expected to rise by just 0.1%, a slowdown from July’s 0.2% increase.
- When excluding volatile food and energy prices, core PCE inflation is forecast to rise slightly, from 2.6% year-over-year in July to 2.7% in August.
- On a monthly basis, core PCE inflation is projected to maintain its 0.2% growth rate, consistent with the previous month.
Market Reaction: A Look Back at Previous PCE Reports
In the last two PCE reports, the U.S. stock market responded positively as the data indicated easing inflation.
When the July PCE report, released on Aug. 30, came in below expectations, it sparked a stock rally. The S&P 500, as tracked by the SPDR S&P 500 ETF Trust SPY, surged 1%, closing at a record high. Meanwhile, tech stocks, represented by the Invesco QQQ Trust QQQ, outperformed, gaining 1.2%.
The June PCE report, released on July 26, met expectations, which helped boost investor confidence in the disinflation narrative. The S&P 500 rose 1.1%, while the SPDR Dow Jones Industrial Average ETF DIA jumped 1.6%.
Read Next:
Image created using artificial intelligence via Midjourney.
Market News and Data brought to you by Benzinga APIs
© 2024 Benzinga.com. Benzinga does not provide investment advice. All rights reserved.
If You Invested $1,000 In Bitcoin When Jamie Dimon Said He Would Fire Employees 'In A Second' For Holding BTC, Here's How Much You'd Have Today
JPMorgan & Chase (NYSE:JPM) CEO Jamie Dimon is among the finance executives who have vocally opposed the cryptocurrency sector over the years.
While Dimon’s stance has changed slightly with JPMorgan now owning Bitcoin through ETFs, his comments about the death of the cryptocurrency sector live on.
Don’t Miss:
What Happened: Dimon likely made some enemies in the cryptocurrency sector with his statements seven years ago.
While speaking at the Barclays Global Financial Services Conference on Sept. 17, 2017, Dimon didn’t hold back with his criticism of Bitcoin (CRYPTO: BTC) and the cryptocurrency sector.
Dimon referred to Bitcoin as being “stupid” and “dangerous” and went as far to label the leading cryptocurrency as fraud. The JPMorgan executive also said that if he caught any of his company’s employees buying or selling Bitcoin, he would “fire them in a second.”
Trending: Groundbreaking trading app with a ‘Buy-Now-Pay-Later’ feature for stocks tackles the $644 billion margin lending market – here’s how to get equity in it with just $500
“It’s against our rules, and they’re stupid. And both are dangerous,” Dimon said at the time, as reported by Bloomberg.
During his speech, Dimon predicted that Bitcoin would collapse, comparing the rising valuations to the Tulipmania in the Netherlands in the 1600s, when the price of bulbs reached new highs and then collapsed.
“You can’t have a business where people can invent a currency out of thin air and think the people buying it are really smart. It’s worse than tulip bulbs.”
Dimon predicted at the time that it wouldn’t end well for investors.
Trending: During market downturns, investors are learning that unlike equities, these high-yield real estate notes that pay 7.5% – 9% are protected by resilient assets, buffering against losses.
“It will blow up, China’s just kicked them out, someone’s going to lose money somewhere else – don’t ask me to short it, it could be at $20,000 before this happens, but it’ll eventually blow up.”
Dimon was right about Bitcoin hitting $20,000, but so far has been wrong about the leading cryptocurrency blowing up.
Bitcoin traded as high as $4,344.65 on Sept. 12, 2017, the day of Dimon’s comments. An investor could have purchased 0.2302 BTC that day with $1,000.
Fast-forward to today, and the $1,000 investment in what Dimon said was a fraud and something that would become worthless is worth $14,574.14. This represents a hypothetical return of +1,357.41% over the last seven years.
Trending: Amid the ongoing EV revolution, previously overlooked low-income communities now harbor a huge investment opportunity at just $500.
For comparison, the same $1,000 invested in the SPDR S&P 500 ETF Trust (SPY), which tracks the S&P 500 Index, would be worth $2,278.68. This represents a return of +127.9% over the last seven years.
Why It’s Important: Dimon remained critical of Bitcoin and cryptocurrency for many years, as he also called for the sector to be shut down in 2023.
The JPMorgan executive has recently softened his stance on Bitcoin, as it has been reported that the bank he runs is exposed to Bitcoin via Bitcoin ETFs.
Trending: Oprah, Madonna and DiCaprio have turned to the alternative asset that is outperforming the S&P 500. Discover the potential of this market before other investors.
Many have been wrong to date when it comes to predicting the death of Bitcoin and the cryptocurrency sector.
While there could be a risk with cryptocurrency and investments in the sector, the same could likely be said for the stock market and other sectors.
BTC Price Action: Bitcoin trades at $63,310.79 at the time of writing versus a 52-week trading range of $26,011.47 to $73,750.07.
Check This Out:
Image via Flickr/ Fortune Live Media
Up Next: Transform your trading with Benzinga Edge’s one-of-a-kind market trade ideas and tools. Click now to access unique insights that can set you ahead in today’s competitive market.
Get the latest stock analysis from Benzinga?
This article If You Invested $1,000 In Bitcoin When Jamie Dimon Said He Would Fire Employees ‘In A Second’ For Holding BTC, Here’s How Much You’d Have Today originally appeared on Benzinga.com
© 2024 Benzinga.com. Benzinga does not provide investment advice. All rights reserved.


