Micron Technology (MU) Reports Earnings Tomorrow: What To Expect
Memory chips maker Micron (NYSE:MU) will be reporting earnings tomorrow afternoon. Here’s what to expect.
Micron Technology beat analysts’ revenue expectations by 2% last quarter, reporting revenues of $6.81 billion, up 81.5% year on year. It was an exceptional quarter for the company, with a significant improvement in its gross margin and an impressive beat of analysts’ EPS estimates.
Is Micron Technology a buy or sell going into earnings? Read our full analysis here, it’s free.
This quarter, analysts are expecting Micron Technology’s revenue to grow 90.5% year on year to $7.64 billion, a reversal from the 39.6% decrease it recorded in the same quarter last year. Adjusted earnings are expected to come in at $1.11 per share.
The majority of analysts covering the company have reconfirmed their estimates over the last 30 days, suggesting they anticipate the business to stay the course heading into earnings. Micron Technology has missed Wall Street’s revenue estimates three times over the last two years.
With Micron Technology being the first among its peers to report earnings this season, we don’t have anywhere else to look to get a hint at how this quarter will unravel for semiconductors stocks. However, investors in the segment have had fairly steady hands going into earnings, with share prices down 1.3% on average over the last month. Micron Technology is down 4.9% during the same time and is heading into earnings with an average analyst price target of $147.37 (compared to the current share price of $94.05).
Today’s young investors likely haven’t read the timeless lessons in Gorilla Game: Picking Winners In High Technology because it was written more than 20 years ago when Microsoft and Apple were first establishing their supremacy. But if we apply the same principles, then enterprise software stocks leveraging their own generative AI capabilities may well be the Gorillas of the future. So, in that spirit, we are excited to present our Special Free Report on a profitable, fast-growing enterprise software stock that is already riding the automation wave and looking to catch the generative AI next.
Cintas, Micron Technology And 3 Stocks To Watch Heading Into Wednesday
With U.S. stock futures trading lower this morning on Wednesday, some of the stocks that may grab investor focus today are as follows:
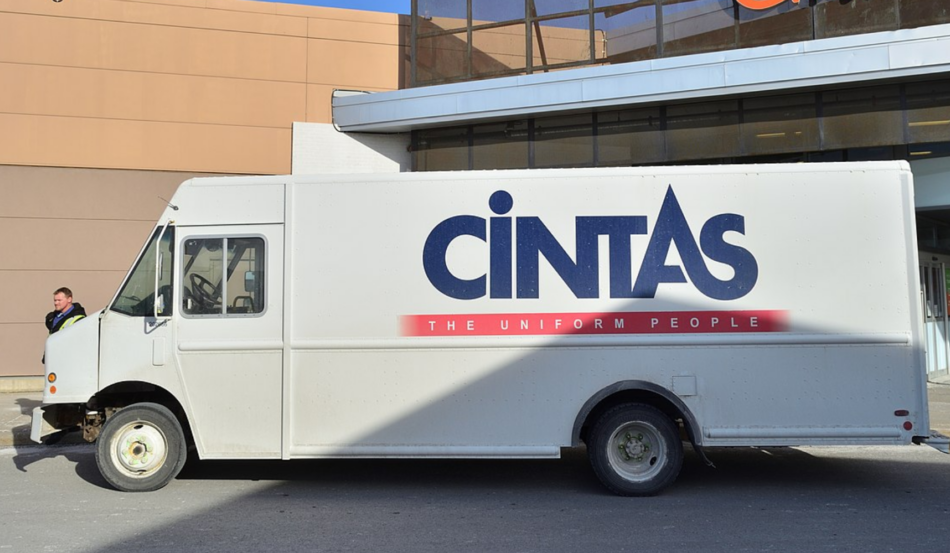
- Wall Street expects Cintas Corporation CTAS to report quarterly earnings at 95 cents per share on revenue of $2.5 billion before the opening bell, according to data from Benzinga Pro. Cintas shares rose 0.5% to $205.93 in after-hours trading.
- Progress Software Corporation PRGS reported better-than-expected third-quarter financial results and raised its FY24 outlook. The company said it now sees full-year adjusted revenue in the range of $745 million to $755 million, up from a prior forecast of $725 million to $735 million. The company also raised its full-year earnings outlook to a range of $4.75 to $4.85 per share, up from a prior outlook of $4.70 to $4.80 per share. Progress Software shares gained 5.2% to $60.11 in the after-hours trading session.
- Analysts expect Micron Technology, Inc. MU to post quarterly earnings at $1.13 per share on revenue of $7.64 million after the closing bell. Micron shares gained 0.8% to $94.77 in the after-hours trading session.
Check out our premarket coverage here
- Worthington Enterprises, Inc. WOR reported weaker-than-expected financial results for the first quarter. Worthington shares fell 4% to $43.47 in the after-hours trading session.
- Analysts are expecting Jefferies Financial Group Inc. JEF to post quarterly earnings at 78 cents per share on revenue of $1.71 billion. The company will release earnings after the closing bell. Jefferies Financial shares gained 0.7% to $62.90 in after-hours trading.
Check This Out:
Photo courtesy: Wikimedia
Market News and Data brought to you by Benzinga APIs
© 2024 Benzinga.com. Benzinga does not provide investment advice. All rights reserved.
Mortgage Demand Soars As Fed Interest Rate Cut Fuels Housing Market Revival: 'Next Spring Could See A Real Rebound'
American homeowners and prospective buyers had been biding their time, waiting for a decisive move from the Federal Reserve to reignite the mortgage market.
That moment came on Sept. 18, when the Fed’s large and unexpected 50-basis-point rate cut—bringing the target range to 4.75%-5%—opened the floodgates for mortgage refinancing and home purchases.
According to the Mortgage Bankers Association (MBA), applications jumped 11% in the week ending Sept. 20, building on the previous week’s 14.2% surge and pushing activity to its highest level since June 2022.
The spike in demand has closely followed the broader trend in benchmark mortgage rates. The average rate on a 30-year fixed — often the go-to option for American homebuyers — fell to a two-year low of 6.13%.
Refinancing Boom: Time To Seize Mortgage Moment
The surge of activity was particularly elevated in refinancing, which had been dormant amid years of high borrowing costs.
Refinancing applications soared by 20% last week, as homeowners moved quickly to lock in lower rates and cut their monthly mortgage payments.
The refinance application index has rallied to levels last seen in late March 2022. Lower mortgage rates can directly translate into lower monthly payments for millions of Americans, making refinancing an appealing option. For example, a homeowner with a $300,000 loan at a 7% rate could save around $300 per month if they refinance into a 6% loan.
Historically, periods of falling interest rates have coincided with stronger home-buying activity, and this time appears to be no different.
“Mortgage rates likely had this cut — and this expected rate path — priced in, and lower mortgage rates, now close to 6%, have resulted in much more refinance and some additional purchase activity in recent weeks,” said Mike Fratantoni, MBA’s senior vice president and chief economist.
“If mortgage rates remain near these levels, it will support a stronger-than-typical fall housing market, and next spring could see a real rebound in activity,” he added.
The Vanguard Real Estate ETF VNQ, which tracks the broader real estate sector, was flat in premarket trading following the news. Similarly, the iShares Residential and Multisector Real Estate ETF REZ, which has more direct exposure to the housing market, held steady.
Meanwhile, the VanEck Mortgage REIT Income ETF MORT saw a slight uptick of 0.5%.
Read Now:
Image: Shutterstock
Market News and Data brought to you by Benzinga APIs
© 2024 Benzinga.com. Benzinga does not provide investment advice. All rights reserved.
The American Red Cross Awards Nearly $1.4 Million to Money Management International for Hawaii Wildfire Recovery Efforts
STAFFORD, Texas, Sept. 25, 2024 (GLOBE NEWSWIRE) — The American Red Cross has awarded a nearly $1.4 million grant to nonprofits Money Management International (MMI) and its Hawaii-based partners, Council for Native Hawaiian Advancement (CNHA) and Maui Economic Opportunity, Inc. (MEO), to support those impacted by the devastating 2023 wildfires.
The grant, which runs to July 2025, will provide comprehensive financial counseling, education, and technical assistance to residents impacted by the Maui wildfires, focusing on promoting long-term financial resilience. It will also increase the capacity of CNHA and MEO to deliver services through MMI’s housing counselor training, additional staffing, and technology enhancements. Additionally, funding will support MMI’s outreach efforts and engagement with Honolulu-based Ward Research to gain local insights.
“MMI is uniquely positioned to deliver our award-winning solutions anywhere in the United States and its territories,” said Michelle Jones, Chief External Affairs Officer at MMI. “We are grateful to the Red Cross for their generous support in helping us reach those impacted by the Hawaii wildfires and assist them in their recovery. Our goal is to provide critical resources that will not only assist with immediate needs but also lay the foundation for long-term economic growth and strength.”
The Red Cross, with support from the American public, has been providing emergency relief and long-term recovery support in response to the wildfires. The partnership with MMI marks a continued effort to aid those in need through financial education and housing counseling, ensuring that survivors have the tools they need to recover and rebuild.
“The Red Cross is committed to supporting communities affected by the devastation of the Hawaii wildfires,” added Amanda Ree, Red Cross Director of Wildfire Long-Term Recovery Programs. “Through this collaboration, we are proud to partner with Money Management International to provide essential financial counseling and education to help wildfire survivors build financial stability and seek long-term sustainable housing solutions. Together, we aim to empower impacted households with the tools and resources they need to work towards a more resilient future.”
About The American Red Cross
The American Red Cross shelters, feeds and provides comfort to victims of disasters; supplies about 40% of the nation’s blood; teaches skills that save lives; distributes international humanitarian aid; and supports veterans, military members and their families. The Red Cross is a nonprofit organization that depends on volunteers and the generosity of the American public to deliver its mission. For more information, please visit redcross.org or CruzRojaAmericana.org, or follow us on social media.
About MMI
Money Management International (MMI) has been at the forefront of financial health solutions for over 65 years. As a leading nonprofit organization, MMI is dedicated to changing how America overcomes financial challenges by offering timely and expert guidance. Recognized by major financial organizations and media outlets, MMI’s programs help individuals reach their financial goals and foster a life of financial wellness. Learn more at MoneyManagement.org.
For reporters looking to interview real people for stories, MMI has created a group of nearly 500 clients from across the country who are willing to share their experiences with the media in the hopes of helping others experiencing financial challenges. Our peer advocates have paid off over $19 million of debt and now serve as MMI ambassadors. Hear from them on MMI’s podcast, Long Story $hort.
To schedule an interview with Michelle Jones or an MMI client, please contact:
Thomas Nitzsche, 404.490.2227, Thomas.Nitzsche@MoneyManagement.org
Lori Geary, 404.551.2151, lgeary@lexiconstrategies.com

Thomas Nitzsche
Money Management International
404.490.2227
Thomas.Nitzsche@MoneyManagement.org

Lori Geary
Lexicon Strategies
404.551.2151
lgeary@lexiconstrategies.com
Market News and Data brought to you by Benzinga APIs
© 2024 Benzinga.com. Benzinga does not provide investment advice. All rights reserved.
Absorbent Mats Market Size Projected to Exceed USD 4.1 Billion by 2031 with 5.5% CAGR, Enhancing Accessibility Through Streamlined Supply Chains: Transparency Market Research Inc.
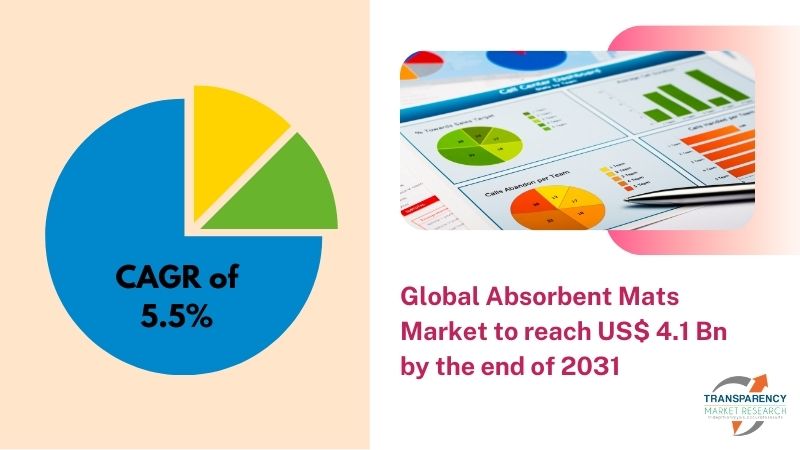
Wilmington, Delaware, United States, Transparency Market Research, Inc. , Sept. 25, 2024 (GLOBE NEWSWIRE) — The global absorbent mats market is estimated to flourish at a CAGR of 5.5% from 2023 to 2031. Transparency Market Research projects that the overall sales revenue for absorbent mats is estimated to reach US$ 4.1 billion by the end of 2031.
The emergence of online platforms and e-commerce solutions tailored to industrial procurement has revolutionized how absorbent mats are sourced and distributed. Streamlined supply chains and direct-to-customer models enhance accessibility and efficiency.
Increasingly, companies opt for rental or leasing arrangements for absorbent mats, reducing upfront costs and ensuring hassle-free maintenance. This trend offers flexibility and cost-effectiveness, particularly for businesses with fluctuating demand or limited storage space.
With growing environmental concerns, there’s a rising emphasis on sustainable disposal and recycling of used absorbent mats. Companies exploring innovative recycling technologies and closed-loop systems aim to minimize waste and maximize resource efficiency.
The integration of Internet of Things (IoT) sensors and smart technologies into absorbent mats enables real-time monitoring of fluid levels, enhancing proactive spill management and reducing downtime. This tech-driven approach improves operational efficiency and risk mitigation strategies.
In light of health and safety concerns, there’s a surge in demand for absorbent mats infused with antimicrobial properties. Especially in hygiene-sensitive environments like healthcare facilities and food processing plants, these mats offer added protection against harmful pathogens, bolstering workplace safety protocols.
Download Sample Copy of the Report: https://www.transparencymarketresearch.com/absorbent-mats-market.html
Absorbent Mats Market: Competitive Landscape
In the dynamic realm of the absorbent mats market, competition is fierce and diverse, with key players vying for market share and innovation. Established industry giants such as ABC Corporation and XYZ Enterprises dominate with extensive product portfolios and global distribution networks.
Emerging players like InnovateTech and EcoSorb disrupt the market with eco-friendly and technologically advanced solutions. Regional players also contribute significantly, catering to niche markets and offering localized expertise. As demands evolve towards sustainability and efficiency, competition intensifies, driving companies to continuously enhance product quality, expand market reach, and adapt to ever-changing consumer preferences.
Some prominent players are as follows:
- NoTrax Justrite Safety Group
- Liquid Safety Solutions (Spilfyter)
- New Pig Corporation
- Little Rapids Corporation (Graham Medical)
- Safetec of America, Inc.
- McAllister Mills, Inc.
- COBA Europe Ltd
- Can-Ross Environmental Services Ltd
- Brady Corporation
- PONZI Srl
Product Portfolio:
- Safetec of America, Inc. offers cutting-edge safety solutions with a range of personal protective equipment (PPE), including gloves, masks, and disinfectants. Committed to workplace safety, they provide innovative products trusted by industries worldwide.
- McAllister Mills, Inc. specializes in high-performance thermal insulation solutions. From custom-engineered blankets to gaskets, their products meet rigorous industry standards, ensuring superior performance and reliability in diverse applications.
Key Findings of the Market Report
- Polypropylene dominates the absorbent mats market, prized for its excellent absorbency, durability, and cost-effectiveness, making it the material of choice.
- Universal absorbent mats lead the market due to their versatility in absorbing various liquids, catering to a wide range of industries and applications.
- The oil & gas sector leads the absorbent mats market due to its high demand for spill containment and safety solutions.
Absorbent Mats Market Growth Drivers & Trends
- Stringent workplace safety regulations drive demand for absorbent mats, particularly in industries subject to spill hazards, ensuring compliance and risk mitigation.
- Growing environmental awareness fuels demand for eco-friendly absorbent mats made from recycled materials, aligning with corporate sustainability goals.
- Innovations in material science and manufacturing processes enhance absorbent mat performance, durability, and absorbency capacities, catering to evolving industry needs.
- Rapid industrialization in emerging economies drives increased adoption of absorbent mats across diverse sectors such as manufacturing, oil & gas, and healthcare.
- Rising demand for specialized absorbent mats tailored to specific applications, such as oil-only or chemical-resistant variants, spurs market growth and product diversification.
Global Absorbent Mats Market: Regional Profile
- North America, as a mature market, boasts robust demand for absorbent mats driven by stringent workplace safety regulations and a focus on environmental sustainability. Major players such as Safetec of America, Inc. and EcoSorb dominate, offering a wide range of high-quality products tailored to diverse industrial applications.
- Europe, characterized by stringent environmental regulations and a growing emphasis on sustainability, witnesses a surge in demand for eco-friendly absorbent mats. McAllister Mills, Inc. and COBA Europe Ltd lead the market with innovative solutions designed to meet stringent European Union standards while providing superior performance and durability.
- Asia Pacific emerges as a lucrative market propelled by rapid industrialization, particularly in countries like China and India. The region experiences increasing adoption of absorbent mats across various industries, driven by rising awareness of workplace safety and hygiene. Local players, alongside global giants, capitalize on this burgeoning demand, offering cost-effective solutions tailored to the region’s diverse industrial landscape.
Buy this Premium Research Report: https://www.transparencymarketresearch.com/checkout.php?rep_id=85530<ype=S
Absorbent Mats Market: Key Segments
-
- Polypropylene
- PVC
- Nitrile
- Rubber
- Others
-
- Grease & Oil Absorbing Mats
- Chemical Absorbent Mats
- Universal Absorbent Mats
-
- Food & Beverages
- Automotive
- Chemicals
- Oil & Gas
- Pharmaceuticals
- Others
-
- Direct Sales
- Indirect Sales
- North America
- Europe
- Asia Pacific
- Middle East & Africa
- South America
Explore More Trending Report by Transparency Market Research:
- Personal Care Appliances Market – The global personal care appliances market size to Surpass USD 27.2 billion by 2031 | Exclusive Research Transparency Market Research Inc.
- Hair Care Products Market – The global hair care products market Revenue to Cross USD 72 billion by 2031, Developing at a 5.1% CAGR: TMR Report.
- Medicine Cabinets Market – The global medicine cabinets market is estimated to grow at a CAGR of 4.8% from 2024 to 2034 and reach US$ 15.7 Billion by the end of 2034.
- Soundbars Market – The global soundbars market is estimated to grow at a CAGR of 8.3% from 2024 to 2034 and reach US$ 15.4 Billion by the end of 2034.
About Transparency Market Research
Transparency Market Research, a global market research company registered at Wilmington, Delaware, United States, provides custom research and consulting services. Our exclusive blend of quantitative forecasting and trends analysis provides forward-looking insights for thousands of decision makers. Our experienced team of Analysts, Researchers, and Consultants use proprietary data sources and various tools & techniques to gather and analyses information.
Our data repository is continuously updated and revised by a team of research experts, so that it always reflects the latest trends and information. With a broad research and analysis capability, Transparency Market Research employs rigorous primary and secondary research techniques in developing distinctive data sets and research material for business reports.
Contact:
Transparency Market Research Inc.
CORPORATE HEADQUARTER DOWNTOWN,
1000 N. West Street,
Suite 1200, Wilmington, Delaware 19801 USA
Tel: +1-518-618-1030
USA – Canada Toll Free: 866-552-3453
Website: https://www.transparencymarketresearch.com
Email: sales@transparencymarketresearch.com
Follow Us: LinkedIn| Twitter| Blog | YouTube

© 2024 Benzinga.com. Benzinga does not provide investment advice. All rights reserved.
The Rise of AI Image Generator Market: A $60.8 billion Industry Dominated by Google (US), Microsoft (US), OpenAI (US) | MarketsandMarkets™
Delray Beach, FL, Sept. 25, 2024 (GLOBE NEWSWIRE) — The AI image generator market is projected to grow from USD 8.7 billion in 2024 to USD 60.8 billion in 2030, at a CAGR of 38.2% during the forecast period, according to a new report by MarketsandMarkets™. With sophisticated machine learning models, generative AI is best at producing visually stunning video and image content. It can apply style transfer to combine different artistic styles create completely new images with GANs (Generative Adversarial Networks) in paint areas that are missing and use super-resolution techniques to improve resolution. It also allows deepfake technology to modify video generate new content based on text descriptions and transfer motion patterns to produce realistic animations in videos.
Browse in-depth TOC on “AI Image Generator Market”
401 – Tables
73 – Figures
440 – Pages
Download Report Brochure @ https://www.marketsandmarkets.com/pdfdownloadNew.asp?id=235119833
AI Image Generator Market Dynamics:
Drivers:
- Increased productivity
- Enhanced creativity
- Improved artist performance
- Importance of human input
Restraints:
- Content Authenticity
- Industry Impact
- Ethical Implications
- Regulatory Challenges
Opportunities:
- Enhanced Image Synthesis
- Advanced Image-to-Image Translation
- Diverse Industry Applications
List of Key Players in AI Image Generator Market:
- Google (US)
- Microsoft (US)
- AWS (US)
- Adobe (US)
- Nvidia (US)
- OpenAI (US)
- Meta (US)
- Anthropic (US)
- Databricks (US)
- Synthesia (UK)
Request Sample Pages: https://www.marketsandmarkets.com/requestsampleNew.asp?id=235119833
Based on offering, the AI image generator market has been segmented into software and services. Based on software by type, the market is divided into Generative Adversarial Networks, Transformer Models, Convolutional Neural Networks, Variational Autoencoders, and others (Autoregressive Models, and Diffusion Models). Generative Adversarial Networks are bifurcated into Conditional GANs, Style GANs, and Cycle GANs. Whereas Convolutional Neural Networks is bifurcated into image-generating CNNs and Video-Generating CNNs. Further based on software by deployment mode, the market is segmented into cloud and on-premises. Services are segmented into professional services and managed services. Professional services encompass training & consulting services, system integration & implementation services, and support and maintenance services.
Based on image application the AI image generator market is divided into image generation, semantic image-to-photo translation, image-to-image conversion, image resolution increase, 3D shape generation, and other image-based applications (image manipulation, and image captioning).
Inquire Before Buying: https://www.marketsandmarkets.com/Enquiry_Before_BuyingNew.asp?id=235119833
Also based on the video application, the AI image generator market is further divided into video generation, video prediction, video editing & enhancement, video compression & transmission, creative storytelling, video annotation, video synthesis & content creation, and other video-based applications (video dubbing, and video style transfer).
The vertical segment is divided into media & entertainment, BFSI, healthcare & life sciences, manufacturing, retail & e-commerce, transportation & logistics, construction & real estate, energy & utilities, government & defense, IT/ITeS, telecommunications and other verticals (education, and travel & hospitality). Various verticals across industries are significantly influenced by the role of generative AI in video and image modalities, shaping its growth trajectory and adoption patterns. This technology impacts various sectors: in media & entertainment, it enhances visual effects and content creation; in healthcare & life sciences, it aids in medical imaging and diagnostics; in education, it creates interactive and immersive learning materials; and in retail & ecommerce, it assists in virtual try-ons and personalized catalog generation.
The market for AI image generator has been divided into five regions: North America, Europe, Asia Pacific, Middle East & Africa, and Latin America. In 2024, North America is projected to have the largest share of the AI image generator market, with Europe following closely behind. The region has rapidly embraced AI image generators due to its strong technological foundation, substantial funding in AI studies, and a tradition of creativity. The quick advancement and implementation of generative AI technology is fueled by the region’s sophisticated computing resources and extensive tech sector.
Get access to the latest updates on AI Image Generator Companies and AI Image Generator Industry

About MarketsandMarkets™

MarketsandMarkets™ has been recognized as one of America's best management consulting firms by Forbes, as per their recent report.

MarketsandMarkets™ is a blue ocean alternative in growth consulting and program management, leveraging a man-machine offering to drive supernormal growth for progressive organizations in the B2B space. We have the widest lens on emerging technologies, making us proficient in co-creating supernormal growth for clients.

Earlier this year, we made a formal transformation into one of America's best management consulting firms as per a survey conducted by Forbes.

The B2B economy is witnessing the emergence of $25 trillion of new revenue streams that are substituting existing revenue streams in this decade alone. We work with clients on growth programs, helping them monetize this $25 trillion opportunity through our service lines - TAM Expansion, Go-to-Market (GTM) Strategy to Execution, Market Share Gain, Account Enablement, and Thought Leadership Marketing.

Built on the 'GIVE Growth' principle, we work with several Forbes Global 2000 B2B companies - helping them stay relevant in a disruptive ecosystem. Our insights and strategies are molded by our industry experts, cutting-edge AI-powered Market Intelligence Cloud, and years of research. The KnowledgeStore™ (our Market Intelligence Cloud) integrates our research, facilitates an analysis of interconnections through a set of applications, helping clients look at the entire ecosystem and understand the revenue shifts happening in their industry.

To find out more, visit www.MarketsandMarkets™.com or follow us on Twitter, LinkedIn and Facebook.

Contact:
Mr. Rohan Salgarkar
MarketsandMarkets™ INC.
1615 South Congress Ave.Suite 430
Suite 103, Delray Beach, FL 33445
USA: +1-888-600-6441
Email: sales@marketsandmarkets.com
Visit Our Website: https://www.marketsandmarkets.com
© 2024 Benzinga.com. Benzinga does not provide investment advice. All rights reserved.
Riot Platforms Stock Plummets 53% YTD: Right Time to Buy?
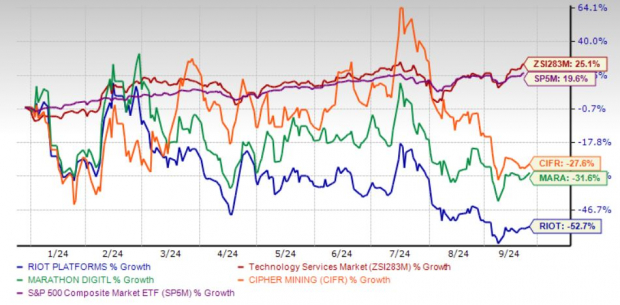
Riot Platforms, Inc. RIOT has experienced a 52.7% decline in its stock year to date, a sharp contrast to the 25.1% growth seen in its industry and the 19.6% increase in the Zacks S&P 500 composite.
This downturn mirrors the performance of other cryptocurrency-focused stocks, such as Cipher Mining CIFR, down 27.6%, and Marathon Digital MARA, which has fallen 31.6% during the same period.
Year-to-Date Price Performance

Image Source: Zacks Investment Research
The stock recently closed at $7.33, hovering near its 52-week low of $6.36, and is trading below its 50-day moving average, reflecting bearish investor sentiment.
With RIOT shares continuing to show weakness, investors may be considering whether now is the right time to buy. Let’s explore further.
RIOT’s Post-Halving Obstacles and Financial Difficulties
One of the primary reasons for RIOT’s downward trajectory is the Bitcoin BTC/USD halving event, which has significantly increased operational challenges for miners, including Riot. The halving means that each ASIC miner now needs to work double as hard to mine the same amount of Bitcoin, but the anticipated price increase for Bitcoin has not occurred to balance this increased difficulty. Riot’s Bitcoin production decreased 13% sequentially in August 2024, highlighting the operational inefficiencies and increased challenges the company faces due to the halving.
The drop in production underscores the broader issues Riot is grappling with in its mining operations. In the second quarter of 2024, the company mined 844 Bitcoins, a 52% decrease year over year. This decline is primarily attributed to a significant increase in the Bitcoin network difficulty since January 2023. These operational challenges have put the company in a risky financial position, potentially leading to further share dilution as it seeks funding, which would result in additional losses for shareholders.
RIOT’s Declining Estimates
Four estimates for 2024 moved south over the past 60 days versus no northward revisions. Over the same period, the Zacks Consensus Estimate for 2024 earnings has declined 75.9%. This indicates a lack of confidence among analysts in the company’s ability to improve its financial performance soon.
Entry Into the Stock Seems Risky
While some investors may be tempted to buy at these low levels, the company’s current operational struggles, coupled with analysts’ downward revisions for 2024 earnings estimates, signal uncertainty.
Given RIOT’s steep decline year to date and its significant challenges following the Bitcoin halving, a “Hold” recommendation seems appropriate at this time. The post-halving environment has made mining more difficult, and RIOT’s Bitcoin production dropped in August 2024, further reflecting operational inefficiencies. Additionally, with a sharp decrease in Bitcoin mined in the second quarter of 2024 and a notable rise in Bitcoin network difficulty, the company faces heightened financial risks.
Investors should adopt a wait-and-watch approach to assess whether Riot can overcome its post-halving challenges before making further investment decisions.
RIOT currently carries a Zacks Rank #3 (Hold).
Market News and Data brought to you by Benzinga APIs
© 2024 Benzinga.com. Benzinga does not provide investment advice. All rights reserved.
VanEck Launches CLOB ETF: Focusing on AA-BB CLOs for Higher Yield Opportunity
The actively managed CLOB, sub-advised by PineBridge Investments, seeks attractive opportunities in mezzanine CLOs and enhances access to growing $1.5 trillion global CLO market, building on the previously launched VanEck CLO ETF, which provides investment grade CLO exposure.
CLOB aims to provide higher yield potential through a risk-managed approach to mezzanine CLO investing and comes as investors face uncertainty in the markets and the cusp of an interest rate regime change.
NEW YORK, Sept. 25, 2024 /PRNewswire/ — VanEck today announced the launch of the VanEck AA-BB CLO ETF (CLOB), an actively managed investment strategy sub-advised by PineBridge Investments, a leader in collateralized loan obligation (CLO) investing. CLOB invests primarily in AA to BB rated tranches of CLOs of any maturity.
CLOB actively allocates to the most attractive opportunities in mezzanine CLOs, according to PineBridge, to access potentially higher return potential compared to investment-grade CLOs. CLOs offer an attractive yield pickup compared to similarly rated corporate bonds and loans, along with structural built-in protection against credit loss. Along with floating rate coupons that insulate investors from interest rate driven volatility, this combination of higher yields and higher quality has been compelling to income investors facing uncertain markets ahead.
CLOB expands VanEck’s leadership in delivering income-focused investment solutions, including the VanEck CLO ETF (CLOI), also sub-advised by PineBridge. CLOI focuses on investment grade CLOs and has stood out for its risk-adjusted performance since launching in June 2022. PineBridge, a $170 billion private global asset manager, has extensive experience in CLOs and possesses a unique vantage point both as a CLO originator and investor in third-party CLOs. Since 1999, PineBridge has issued 39 CLOs in the US and Europe, with a par value of approximately $16 billion and reissued, reset, or refinanced 22 transactions worth $10.2 billion, as of December 31, 2023.
“The launch of CLO-focused ETFs has been an important development in the CLO market, which is now approaching $1.5 trillion globally, and also for ETF investors that were not able to access this market before,” said William Sokol, Senior ETF Product Manager at VanEck. “As ETF investors become more familiar with the CLO market and increasingly look for opportunities outside of AAA CLOs, we believe a risk-managed approach that actively captures market opportunities is the best way to invest in mezzanine CLOs. CLOB leverages PineBridge’s specialized knowledge and experience in this space, and complements CLOI’s investment-grade focus. CLOB offers a diversified approach to mezzanine CLO investing with the benefits of the ETF structure: transparency, liquidity, cost and efficient access.”
“We’re very pleased to partner again with VanEck to further expand access to the mezzanine CLO market,” said Laila Kollmorgen, Portfolio Manager, CLO Tranche, at PineBridge and manager of both CLOI and CLOB. “We believe our well-established track record and institutional pedigree, both as a CLO manager and an active investor in CLO tranches, position us advantageously to manage risks effectively, generate income, and ultimately provide alpha for our investors.”
In addition to CLOB and CLOI, VanEck’s diverse lineup of income ETFs includes the VanEck Investment Grade Floating Rate ETF (FLTR), which invests in U.S.-denominated floating rate notes issued by corporate issuers and rated investment grade; the VanEck Fallen Angel High Yield Bond ETF (ANGL), offering exposure to high-yield bonds originally issued as investment grade; and the VanEck BDC Income ETF (BIZD), which invests in publicly traded business development companies.
The VanEck team provides regular updates and insights on income investing on its website.
About VanEck
VanEck has a history of looking beyond the financial markets to identify trends that are likely to create impactful investment opportunities. We were one of the first U.S. asset managers to offer investors access to international markets. This set the tone for the firm’s drive to identify asset classes and trends – including gold investing in 1968, emerging markets in 1993, and exchange traded funds in 2006 – that subsequently shaped the investment management industry.
Today, VanEck offers active and passive strategies with compelling exposures supported by well-designed investment processes. As of August 31, 2024, VanEck managed approximately $113.9 billion in assets, including mutual funds, ETFs and institutional accounts. The firm’s capabilities range from core investment opportunities to more specialized exposures to enhance portfolio diversification. Our actively managed strategies are fueled by in-depth, bottom-up research and security selection from portfolio managers with direct experience in the sectors and regions in which they invest. Investability, liquidity, diversity, and transparency are key to the experienced decision-making around market and index selection underlying VanEck’s passive strategies.
Since our founding in 1955, putting our clients’ interests first, in all market environments, has been at the heart of the firm’s mission.
About PineBridge Investments
PineBridge Investments is a private, global asset manager focused on active, high-conviction investing. We draw on the collective power of our experts in each discipline, market, and region of the world through an open culture of collaboration designed to identify the best ideas. Our mission is to exceed clients’ expectations on every level, every day. As of 30 June 2024, the firm managed US$169.7 billion* across global asset classes for sophisticated investors around the world.
Important Disclosures
This is not an offer to buy or sell, or a recommendation to buy or sell any of the securities, financial instruments or digital assets mentioned herein. The information presented does not involve the rendering of personalized investment, financial, legal, tax advice, or any call to action. Certain statements contained herein may constitute projections, forecasts and other forward-looking statements, which do not reflect actual results, are for illustrative purposes only, are valid as of the date of this communication, and are subject to change without notice. Actual future performance of any assets or industries mentioned are unknown. Information provided by third party sources are believed to be reliable and have not been independently verified for accuracy or completeness and cannot be guaranteed. VanEck does not guarantee the accuracy of third party data. The information herein represents the opinion of the author(s), but not necessarily those of VanEck or its other employees.
An investment in the VanEck CLO AA-BB ETF (CLOB) may be subject to risks which include, among others, Collateralized Loan Obligations (CLO), debt securities, LIBOR Replacement, foreign currency, foreign securities, investment focus, newly-issued securities, extended settlement, affiliated fund, management, derivatives, cash transactions, market, Sub-Adviser, operational, authorized participant concentration, new fund, absence of prior active market, trading issues, fund shares trading, premium/discount, liquidity of fund shares, non-diversified, and seed investor risks. The Fund may also be subject to liquidity, interest rate, floating rate obligations, credit, call, extension, high yield securities, income, valuation, privately-issued securities, covenant lite loans, default of the underlying asset and CLO manager risks, all of which may adversely affect the Fund.
An investment in the VanEck CLO ETF (CLOI) may be subject to risks which include, among others, Collateralized Loan Obligations (CLO), debt securities, LIBOR Replacement, foreign currency, foreign securities, investment focus, newly-issued securities, extended settlement, affiliated fund, management, derivatives, cash transactions, market, Sub-Adviser, operational, authorized participant concentration, new fund, absence of prior active market, trading issues, fund shares trading, premium/discount, liquidity of fund shares, non-diversified, and seed investor risks. The Fund may also be subject to liquidity, interest rate, floating rate obligations, credit, call, extension, high yield securities, income, valuation, privately-issued securities, covenant lite loans, default of the underlying asset and CLO manager risks, all of which may adversely affect the Fund.
An investment in the VanEck Investment Grade Floating Rate ETF (FLTR) may be subject to risk which includes, among others, foreign securities, foreign currency, investing in Japanese and United Kingdom issuers, credit, interest rate, floating rate, floating rate LIBOR, restricted securities, financial, market, operational, sampling, index tracking, authorized participant concentration, no guarantee of active trading market, trading issues, passive management, fund shares trading, premium/discount risk and liquidity of fund shares, non-diversified and concentration risks, all of which may adversely affect the Fund.
An investment in the VanEck Fallen Angel High Yield Bond ETF (ANGL) may be subject to risk which includes, among others, high yield securities, foreign securities, foreign currency, credit, interest rate, restricted securities, market, operational, call, Consumer staples, consumer discretionary, energy, communications, index tracking, authorized participant concentration, no guarantee of active trading market, trading issues, passive management, fund shares trading, premium/discount risk and liquidity of fund shares, non-diversified and concentration risks, all of which may adversely affect the Fund.
An investment in VanEck BDC Income ETF (BIZD) may be subject to risks of investments in business development companies (BDC). BDCs invest in private companies and thinly traded securities of public companies, including debt instruments of such companies. Generally, little public information exists for private and thinly traded companies and there is a risk that investors may not be able to make fully informed investment decisions. Less mature and smaller private companies involve greater risk than well-established and larger publicly traded companies. Investing in debt involves risk that the issuer may default on its payments or declare bankruptcy and debt may not be rated by a credit rating agency. Many debt investments in which a BDC may invest will not be rated by a credit rating agency and will be below investment grade quality. These investments have predominantly speculative characteristics with respect to an issuer’s capacity to make payments of interest and principal. BDCs may not generate income at all times. Additionally, limitations on asset mix and leverage may prohibit the way that BDCs raise capital. The VanEck BDC Income ETF (BIZD) and its affiliates may not own in excess of 25% of a BDC’s outstanding voting securities which may limit the Fund’s ability to fully replicate its index. An investment in the Fund may be subject to risks which include, among others, investment restrictions, financial sector, small- and medium-capitalization companies, equity securities, market, operational, index tracking, authorized participant concentration, no guarantee of active trading market, trading issues, passive management, fund shares trading, premium/discount risk and liquidity of fund shares, issuer-specific changes and concentration risks. Small- and medium-capitalization companies may be subject to elevated risks.
Investing involves substantial risk and high volatility, including possible loss of principal. An investor should consider the investment objective, risks, charges and expenses of a Fund carefully before investing. To obtain a prospectus and summary prospectus, which contain this and other information, call 800.826.2333 or visit vaneck.com. Please read the prospectus and summary prospectus carefully before investing.
©️ Van Eck Securities Corporation, Distributor, a wholly owned subsidiary of Van Eck Associates Corporation
666 Third Avenue, New York, NY 10017
Phone: 800.826.2333
Email: info@vaneck.com
Media Contact
Ryan Graham
JConnelly
862-777-4274
rgraham@jconnelly.com
![]() View original content to download multimedia:https://www.prnewswire.com/news-releases/vaneck-launches-clob-etf-focusing-on-aa-bb-clos-for-higher-yield-opportunity-302258050.html
View original content to download multimedia:https://www.prnewswire.com/news-releases/vaneck-launches-clob-etf-focusing-on-aa-bb-clos-for-higher-yield-opportunity-302258050.html
SOURCE VanEck
© 2024 Benzinga.com. Benzinga does not provide investment advice. All rights reserved.
Why Is Worthington Enterprises Stock Diving Premarket On Wednesday?
Worthington Enterprises, Inc. WOR shares are trading lower at a premarket on Wednesday after the company reported worse-than-expected first-quarter financial results.
On Tuesday, the company reported a net sales decline of 17.5% Y/Y to $257.3 million, missing the consensus of $300.26 million.
The decline was attributed to the deconsolidation of the former Sustainable Energy Solutions (SES) segment in the fourth quarter of FY24 and lower volumes in the Building Products segment.
Adjusted EBITDA from continuing operations fell to $48.4 million from $65.9 million a year ago quarter. Adjusted EPS of $0.50 missed the consensus of $0.74.
By segment, Consumer Products’ net sales stood at $117.6 million in the quarter, with adjusted EBITDA coming in at $17.8 million. Meanwhile, Building Products generated net sales of $139.7 million, down 15.8% Y/Y, in the quarter.
As of May 31, 2024, debt remained steady at $300 million and cash stood at $178.5 million.
Dividend: The Board of Directors declared a quarterly dividend of $0.17 per common share, payable on December 27, 2024, to shareholders of record as of December 13, 2024.
In the quarter, the company repurchased 150,000 common shares for $6.8 million, averaging $45.35 per share.
Worthington Enterprises President and CEO Andy Rose stated, “Consumer Products had a solid quarter delivering year over year earnings growth despite flat volumes. Building Products earnings were down on weak volumes in our heating and cooking business, combined with lower contributions from ClarkDietrich, which continued to face some margin compression.”
“We have a positive long-term outlook especially with the recent recalibration of interest rates. Our market-leading products and brands are well-positioned to take advantage of long-term secular trends and should benefit when near-term headwinds subside and demand normalizes,” Rose added.
Price Action: WOR shares are down 5.03% at $43.01 premarket at the last check on Wednesday.
Read Next:
Market News and Data brought to you by Benzinga APIs
© 2024 Benzinga.com. Benzinga does not provide investment advice. All rights reserved.
Costco (COST) vs. Target (TGT): Which is the Better Stock Going Forward?
Today I’m having a look at Costco and Target; two fellow big box retailers. Shares of retail powerhouse Costco (COST) have risen about 63%% over the past year, while Target (TGT) shares are up around 39% over the same time frame. Both stocks have performed well, but which is the better opportunity for investors going forward? Let’s examine that question.
I’m neutral on Costco based on its pricey valuation. Regarding Target, I’m bullish this stock based on its inexpensive valuation, attractive dividend yield, and long history of dividend growth. Additionally, sell-side analysts view Target as having considerably more upside ahead over the next 12 months.
The Setup
Costco is much beloved by investors, and rightfully so. The stock has generated handsome returns for its shareholders over the years, to the tune of nearly 900% over the past decade. Costco is often cited as being well managed and possessing an attractive business model due to recurring annual fees paid my its members.
Target has generated a total return of 224% over the past decade. Target is no slouch, but it has significantly lagged Costco’s performance over the past 10 years. However, this may create a more compelling setup for an investment in shares of Target today, as we’ll discuss next.
Massive Gap in Valuations
While Costco is a great business with a strong track record of performance, it trades at quite a steep multiple at this point in time. Costco has an off-cycle fiscal year that ends in August, and will soon report its Q4 2024 earnings results. The company trades above 50 times consensus 2025 earnings estimates. This sky-high multiple leaves little room for error going forward if the company disappoints investors in Q4 or during the next fiscal year.
Meanwhile, Target trades at a much more reasonable valuation of 14.8x forward earnings estimates, well below Costco’s multiple and also significantly below the S&P 500’s (SPX) forward valuation of 24x. One can certainly make a case that Costco is a higher-quality business than Target based on its recurring membership fees, but a valuation three times as expensive seems like too much of a gap.
Furthermore, despite Costco’s reputation for quality, Target is a higher-margin business, with gross margins of 26.1% approximately twice as high as Costco’s gross margins of 12.5%. Target’s profit margin of 4.2% is also noticeably higher than Costco’s 2.8%. From my perspective, Target’s significantly lower valuation offers the stock more downside protection and more room to surprise to the upside.
Two Strong Dividend Growth Stocks
Costco is a dividend stock, but its yield of 0.5% is fairly inconsequential. That said, Costco deserves credit for its strong dividend growth, having raised its dividend rate 19 years in a row.
Meanwhile, Target’s dividend yield is 2.9%. This is nearly six times higher than Costco’s current yield, and more than double the yield for the S&P 500. Target has an even more impressive track record of consistently paying and growing its dividend than Costco. Target is a Dividend King that has increased its payout for an incredible 55 years in a row.
Both companies also maintain relatively conservative payout ratios, meaning that both dividends look safe for the foreseeable future. While Costco has done a good job of growing its dividend, Target’s yield is significantly higher, and its consistent history of dividend growth is even better, which supports my bullish view of the stock.
Is COST Stock a Buy, According to Analysts?
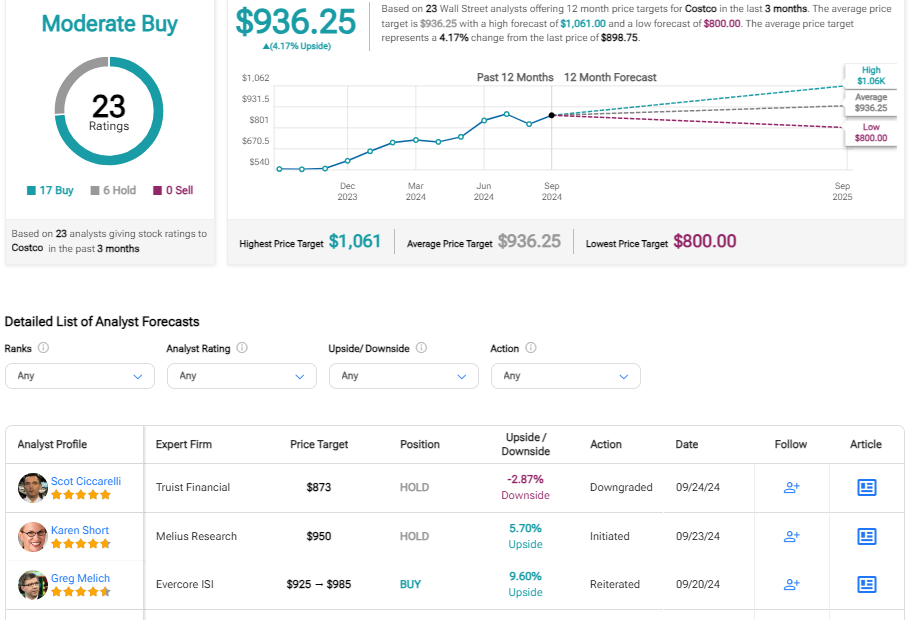
Turning to Wall Street, COST earns a Strong Buy consensus rating based on 17 Buy, five Hold, and no Sell ratings assigned in the past three months. The average COST stock price target of $936.25 implies about 4.0% potential upside from current levels.
Is TGT Stock a Buy, According to Analysts?
At the same time, TGT earns a Moderate Buy consensus rating based on 17 Buys, 10 Holds, and zero Sell rating assigned in the past three months. The average TGT stock price target of $180.87 implies about 16% potential upside from current levels.
Smart Choices
As you can see using TipRanks’ Stock Comparison Tool below, both Costco and Target receive Outperform ratings from TipRanks’ Smart Score system.
Smart Score is a quantitative stock scoring system created by TipRanks. It gives stocks a score from one to 10, based on eight key market factors. Scores of eight, nine, or 10 are considered equivalent to an Outperform rating.
Cocsto’s Outperform-equivalent Smart Score of nine is impressive, but Target comes out on top with a perfect-10 Smart Score.
Target Stock Looks Like the Preferred Investment Choice
Costco is a great company and has been a great performer for its shareholders over many years. However, I’m neutral on shares at this point as this strong run of performance has sent its valuation above 50x forward earnings, giving the stock little margin for error going forward.
Target trades at a much more attractive valuation of under 15x forward earnings, offers a higher dividend yield, and longer history of dividend growth. I’m bullish on Target given its inexpensive valuation, attractive dividend yield, and 55 straight years of dividend growth. Costco is a good stock with a dependable history of performance, but right now I view Target as the better investment option based on my assessment of the two choices.


