CV3 Financial Launches ServEase Loan Servicing Division
The Convergence of Origination and Servicing Ensures Customer Experience Continuity
LOS ANGELES, Sept. 24, 2024 /PRNewswire/ — CV3 Financial Services, announced today that the company is introducing ServEase, a loan servicing division for its customers. CV3 is a leading private lender providing financing to real estate investors for fix-and-flip and rental properties and ground up construction loans. ServEase combines the functions of asset management and the previously outsourced responsibilities of handling loan payments and payoffs into one in-house operation.
“At CV3, our philosophy is that the customer experience begins at first contact, and ends never,” explained CV3 president and CEO, William J. Tessar. “ServEase ensures that customers receive the outstanding service and support they have come to expect from CV3, throughout the life of their loan.”
In a typical mortgage lending model, loan originations and loan servicing often operate as separate entities, with minimal communication between the two. This separation can result in a disjointed customer experience, where the dedication and care that customers receive during the loan origination phase do not carry through to the servicing stage.
By making the servicing experience a priority, CV3 is demonstrating its commitment to building customers for life. ServEase delivers a powerful, secure digital servicing platform that enables customers to easily schedule and make payments, track loan balances, print, manage, e-file and access tax forms, and quickly obtain accurate loan account and payoff statements. It enhances communication by triggering important notifications which can reduce delinquencies and defaults, inherently improving both overall loan performance and customer transparency.
“Traditionally, customers may work with CV3 for just 30 days to apply for and close a loan, but then they are paired with a servicing provider for the life of the loan,” said Tessar. “At CV3, we believe that our responsibility to our customers extends far beyond origination. The convergence of origination and servicing under the CV3 banner provides continuity to ensure that the exceptional service and care our customers receive from day one is seamless throughout their entire journey.”
About CV3 Financial Services
CV3 Financial Services, LLC (CV3) is a private lender providing business purpose loans for non-owner-occupied properties to real estate investors in 33 states. Financing options include bridge, fix-and-flip rehab loans, rental property financing, and new construction loans. With a digital lending platform designed to simplify the loan process, and all processing, underwriting, funding and servicing handled under one roof, CV3 delivers direct answers and quick closings for clients’ real estate investment financing needs. For more information, visit https://www.cv3financial.com.
![]() View original content to download multimedia:https://www.prnewswire.com/news-releases/cv3-financial-launches-servease-loan-servicing-division-302257417.html
View original content to download multimedia:https://www.prnewswire.com/news-releases/cv3-financial-launches-servease-loan-servicing-division-302257417.html
SOURCE CV3 Financial Services
Market News and Data brought to you by Benzinga APIs
© 2024 Benzinga.com. Benzinga does not provide investment advice. All rights reserved.
Why Ken Fisher Says 'Capital Preservation' Could Cost You Big In Retirement
Legendary investor Ken Fisher has a message for retirees and those planning for retirement – the allure of “capital preservation” might be setting you up for financial disappointment.
Fisher, known for his no-nonsense approach to investing, argued in a New York Post opinion report issued on Monday that the concept of capital preservation – often touted as a haven for retirement savings – is fundamentally at odds with the growth needed to sustain a comfortable retirement.
Don’t Miss:
“Growth and true capital preservation can’t coexist in the short run,” Fisher explained. He said that what many consider “safe” investing strategies often fail to keep pace with inflation, potentially eroding purchasing power over time.
The center of Fisher’s argument lies in the role of market volatility. While many investors view volatility as a threat, Fisher sees it as essential for long-term growth. He said that historically, U.S. stocks have risen in 63.1% of calendar months and 73.5% of calendar years from 1925 to 2023.
Trending: Will the surge continue or decline on real estate prices? People are finding out about risk-free real estate investing that lets you cash out whenever you want.
“Eliminate the [downside] and the [upside] also disappears,” Fisher said. He argues that attempts to completely avoid market fluctuations typically result in ultralow returns, barely outpacing – or even trailing behind – inflation.
The investor aimed at financial products promising growth and capital preservation, calling them “phony.”
“Investment strategies promising both growth and capital preservation are phony baloney,” Fisher opined. “Yet so many vendors in varied forms – especially in rocky times like this summer’s – claim otherwise, peddling poor products destined to disappoint.
Trending: Founder of Personal Capital and ex-CEO of PayPal re-engineers traditional banking with this new high-yield account — start saving better today.
He warns investors to be particularly wary of insurance-like “buffered” funds and any product claiming “upside with no downside.”
Instead, the investor is advocating for a clear-eyed approach to retirement investing. He urges investors to understand that short-term volatility is the price of admission for long-term growth. For those who can’t stomach market ups and downs, he suggests reevaluating financial goals, savings rates and future spending plans.
See Also: These five entrepreneurs are worth $223 billion – they all believe in one platform that offers a 7-9% target yield with monthly dividends
The veteran investor’s advice comes when many retirees grapple with economic uncertainty and market turbulence. While the desire for stability is understandable, Fisher’s message is clear – playing it too safe could cost you big in the long run.
As retirement horizons lengthen and the cost of living continues to rise, Fisher’s perspective offers the insight that there are no guarantees and that pursuing growth often requires embracing, rather than avoiding, market volatility.
Read Next:
Up Next: Transform your trading with Benzinga Edge’s one-of-a-kind market trade ideas and tools. Click now to access unique insights that can set you ahead in today’s competitive market.
Get the latest stock analysis from Benzinga?
This article Why Ken Fisher Says ‘Capital Preservation’ Could Cost You Big In Retirement originally appeared on Benzinga.com
© 2024 Benzinga.com. Benzinga does not provide investment advice. All rights reserved.
Will Innovation in Broadband Technology Propel HLIT's Stock Growth?
Harmonic Inc. HLIT recently announced the launch of the cOS Virtualized Broadband Platform that empowers operators to deliver symmetrical multi-gigabit Internet speeds with lower latency, enhanced security and reliability. In this venture, the company collaborated with Comcast, one of the leading broadband providers in the United States, to develop the industry’s first Unified DOCSIS 4.0 fiber solution ready for real-world deployments.
DOCSIS 4.0 is the latest standard for cable broadband services designed to provide high-speed internet and improved network efficiency for advanced data-intensive applications. The cOS virtualized broadband platform integrates both the variants of DOCSIS 4.0 Full Duplex and Frequency Division Duplexing. The combination of FDX and FDD in a single platform ensures greater flexibility, allowing operators to deliver multiple gigabit symmetrical speeds of up to 9Gbps over the existing broadband infrastructure.
Eliminating the requirement of a complete infrastructure overhaul reduces costs, expedites time to market, and ensures a smooth transition to robust network. This feature makes the cOS platform well-suited for rural and remote areas. In fact, HLIT’s fiber solutions match the criteria for the Build America, Buy America initiative and are eligible for funding under the Broadband Equity Access Deployment program.
Will This Venture Drive HLIT’s Share Performance?
The unified DOCSIS 4.0 solution has set a new industry benchmark by merging FDX and FDD technology to power an intelligent ecosystem of network edge devices and provide high-speed broadband services.
Harmonic boasts an extensive customer base, delivering broadband services to more than 30 million homes across North America, Asia, Europe and Latin America. The recent innovations will further solidify its foothold in those regions and accelerate its business expansions. The cost efficiency and versatility of Harmonic’s cOS virtualized broadband platform will likely boost subscriber growth, particularly in underserved rural areas.
HLIT’s Stock Price Performance
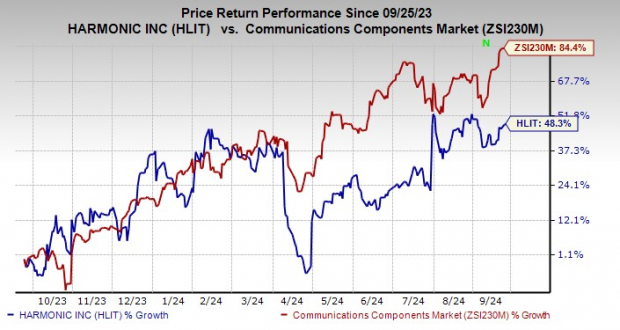
The stock has gained 48.3% over the past year compared with the industry’s growth of 84.4%.

Image Source: Zacks Investment Research
Zacks Rank & Other Stocks to Consider
Harmonic currently sports a Zacks Rank #1 (Strong Buy).
Arista Networks, Inc. ANET carries a Zacks Rank #2 (Buy) at present.
In the last reported quarter, it delivered an earnings surprise of 8.25%. It is engaged in providing cloud networking solutions for data centers and cloud computing environments. The company offers 10/25/40/50/100 Gigabit Ethernet switches and routers optimized for next-generation data center networks.
Ubiquiti Inc. UI sports a Zacks Rank #1 at present. The company offers a comprehensive portfolio of networking products and solutions for service providers and enterprises.
Its excellent global business model, which is flexible and adaptable to evolving changes in markets, helps it to beat challenges and maximize growth. The company’s effective management of its strong global network of more than 100 distributors and master resellers improved its UI’s visibility for future demand and inventory management techniques.
Workday Inc. carries a Zacks Rank of 2 at present. In the last reported quarter, it delivered an earnings surprise of 7.36%.
WDAY is a leading provider of enterprise-level software solutions for financial management and human resource domains. The company’s cloud-based platform combines finance and HR in a single system that makes the process easier for organizations to provide analytical insights and decision support.
Market News and Data brought to you by Benzinga APIs
© 2024 Benzinga.com. Benzinga does not provide investment advice. All rights reserved.
Unpacking the Latest Options Trading Trends in UiPath
Financial giants have made a conspicuous bearish move on UiPath. Our analysis of options history for UiPath PATH revealed 11 unusual trades.
Delving into the details, we found 18% of traders were bullish, while 36% showed bearish tendencies. Out of all the trades we spotted, 6 were puts, with a value of $666,810, and 5 were calls, valued at $225,186.
Expected Price Movements
Analyzing the Volume and Open Interest in these contracts, it seems that the big players have been eyeing a price window from $10.0 to $12.5 for UiPath during the past quarter.
Analyzing Volume & Open Interest
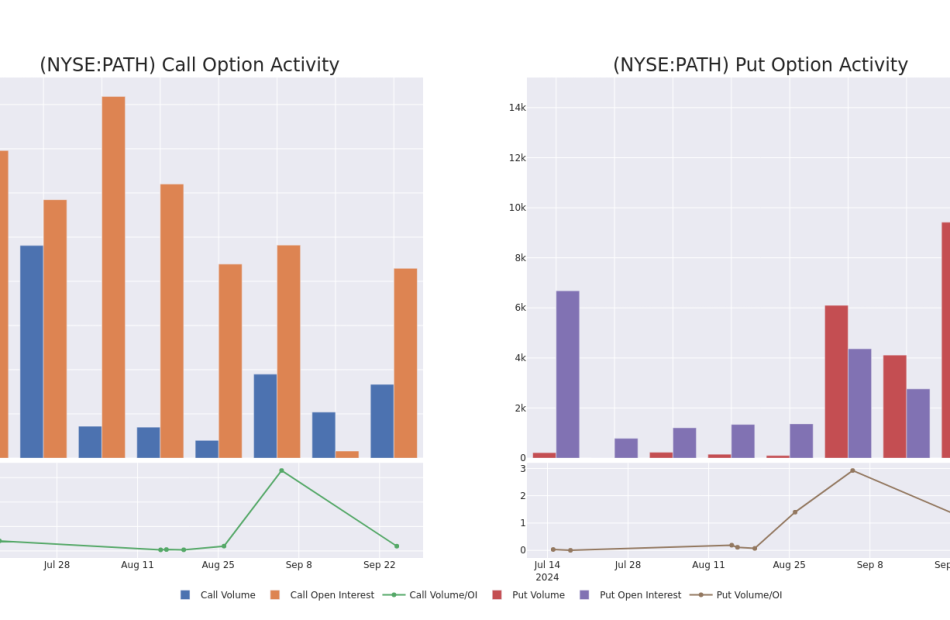
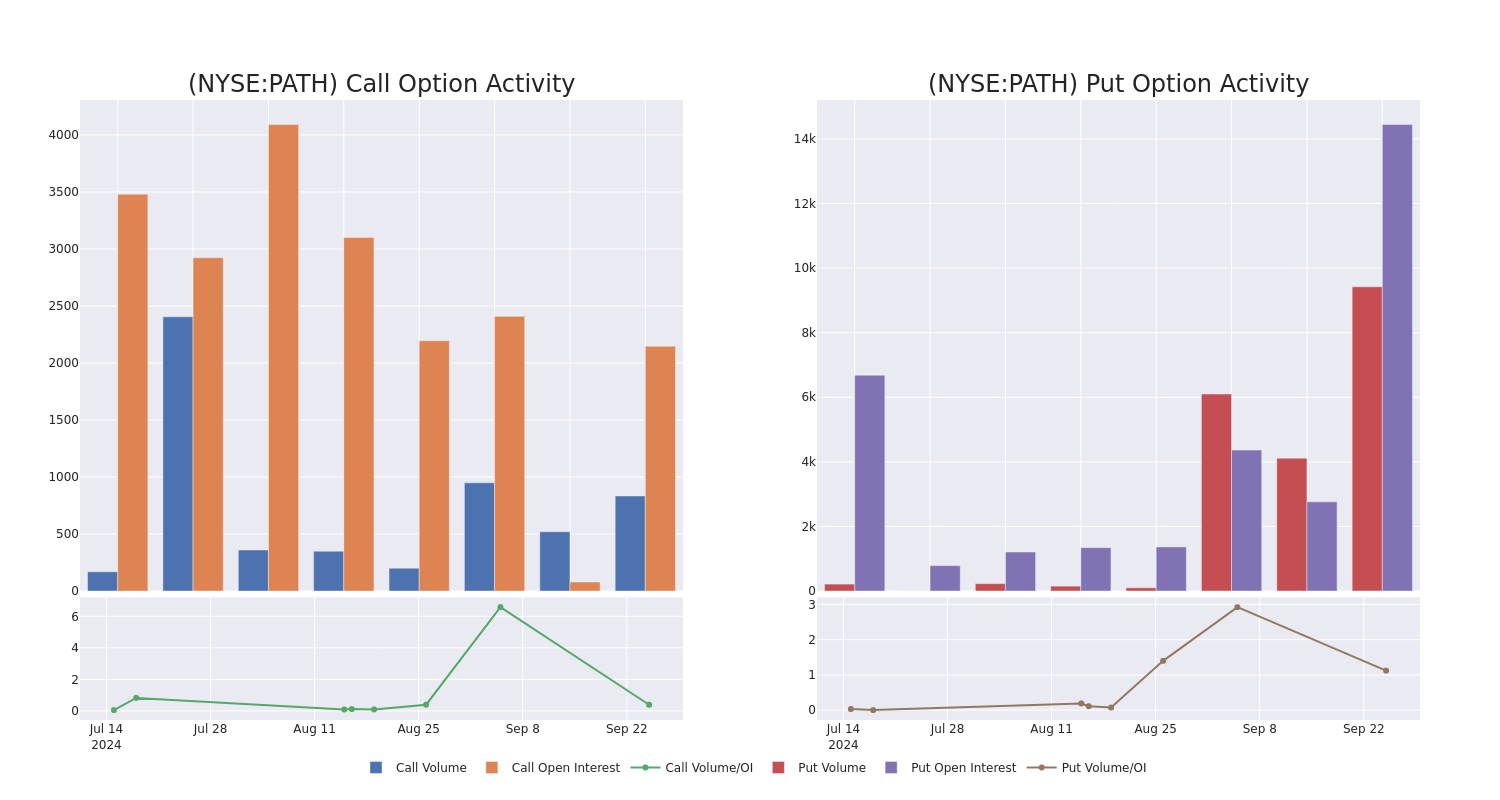
Assessing the volume and open interest is a strategic step in options trading. These metrics shed light on the liquidity and investor interest in UiPath’s options at specified strike prices. The forthcoming data visualizes the fluctuation in volume and open interest for both calls and puts, linked to UiPath’s substantial trades, within a strike price spectrum from $10.0 to $12.5 over the preceding 30 days.
UiPath Call and Put Volume: 30-Day Overview
Significant Options Trades Detected:
| Symbol | PUT/CALL | Trade Type | Sentiment | Exp. Date | Ask | Bid | Price | Strike Price | Total Trade Price | Open Interest | Volume |
|---|---|---|---|---|---|---|---|---|---|---|---|
| PATH | PUT | SWEEP | BEARISH | 06/20/25 | $1.65 | $1.6 | $1.65 | $12.00 | $445.7K | 8.4K | 5.0K |
| PATH | CALL | SWEEP | BEARISH | 05/16/25 | $3.8 | $3.7 | $3.7 | $10.00 | $69.2K | 0 | 188 |
| PATH | PUT | TRADE | NEUTRAL | 06/20/25 | $1.64 | $1.56 | $1.6 | $12.00 | $64.0K | 8.4K | 2.0K |
| PATH | CALL | TRADE | BULLISH | 01/16/26 | $4.6 | $4.2 | $4.6 | $10.00 | $50.5K | 1.7K | 165 |
| PATH | PUT | TRADE | NEUTRAL | 06/20/25 | $1.64 | $1.56 | $1.6 | $12.00 | $48.0K | 8.4K | 2.3K |
About UiPath
UiPath offers an end-to-end cross-application enterprise automation platform. The platform leverages a range of automation technologies including robotic process automation, application programming interface, and artificial intelligence. UiPath’s solution can automate a broad range of repetitive tasks across industries including claims processing, employee onboarding, invoice to cash, loan applications, and customer service.
Having examined the options trading patterns of UiPath, our attention now turns directly to the company. This shift allows us to delve into its present market position and performance
Present Market Standing of UiPath
- With a volume of 5,485,144, the price of PATH is down -3.63% at $12.48.
- RSI indicators hint that the underlying stock is currently neutral between overbought and oversold.
- Next earnings are expected to be released in 65 days.
Turn $1000 into $1270 in just 20 days?
20-year pro options trader reveals his one-line chart technique that shows when to buy and sell. Copy his trades, which have had averaged a 27% profit every 20 days. Click here for access.
Options are a riskier asset compared to just trading the stock, but they have higher profit potential. Serious options traders manage this risk by educating themselves daily, scaling in and out of trades, following more than one indicator, and following the markets closely.
If you want to stay updated on the latest options trades for UiPath, Benzinga Pro gives you real-time options trades alerts.
Market News and Data brought to you by Benzinga APIs
© 2024 Benzinga.com. Benzinga does not provide investment advice. All rights reserved.
Should You Buy Walgreens Boots Alliance for Its 11.1% Dividend Yield? 3 Things to Know First
It’s tempting to gravitate toward dividend stocks that pay huge dividends. Take Walgreens Boots Alliance (NASDAQ: WBA) for example. The pharmacy chain’s dividend yields over 11% at its current share price. In other words, investors get double-digit investment returns before factoring in any potential share price movement.
However, there is never a free lunch in the stock market. It’s rarely so easy.
Peek behind the curtains and you’ll will find a litany of issues at Walgreens that have created such a high dividend yield. This is a warning sign of a yield trap.
Here are three problems facing Walgreens and why dividend-hungry investors may want to look elsewhere.
1. Junk-status financials may trigger a dividend cut
Many consumers may already be familiar with Walgreens Boots Alliance. The company has a sprawling network of pharmacies across America, Europe, and Latin America under the Walgreens and Boots brands. The traditional pharmacy model worked wonders for years; companies like Walgreens would fill prescriptions and use the foot traffic to sell groceries and other goods to help boost their profit margins.
Unfortunately, the digital age has begun impacting this business model, and Walgreens has sought to evolve with the times by using mergers and acquisitions to grow larger and diversify its business model. It merged with Boots Alliance in 2014 to expand its store footprint and then acquired VillageMD in 2021 to enter primary care services.
It hasn’t turned out well; the company has struggled under a massive debt load, and cash flow has dried up significantly. In July, S&P Global downgraded Walgreens’ credit to BB, a sub-investment-grade rating (junk status). The company is now scrambling to clean up its financials and it may sell its VillageMD business. Walgreens slashed the dividend nearly in half in early 2024, so don’t be shocked if it happens again: It still costs Walgreens over $200 million quarterly.
2. The S&P 500 could soon drop the company
How likely is it that another cut is on the way? The chances seem pretty high. Don’t underestimate the stigma attached to junk status financials. Walgreens is still a member of the S&P 500 index, a badge of honor that will probably be hard to get back once lost.
Investors generally favor S&P 500 companies, and having that status attracts institutional investors, especially funds that track the S&P 500, which must own the stock if it’s in the index. A stock can enjoy a boost from buyers when it’s added and could see additional selling pressure if removed.
Walgreens is already trading near multidecade lows, and the deteriorating financials only increase the chances that the index will remove Walgreens. The S&P 500 rebalances quarterly, and Walgreens lost its spot in the Dow Jones Industrial Average earlier this year.
3. Consumer health trends working against Walgreens
Walgreens must turn itself around to avoid all these negative consequences. However, doing so will require more than shedding debt. Walgreens must have a viable long-term business model. Unfortunately, the traditional pharmacy model is becoming dated; that’s why Walgreens set out on this acquisition spree in the first place.
Today, pharmaceutical drugs are starting to bypass retail pharmacies. Telehealth companies like Hims & Hers are enjoying rampant growth, and e-commerce giant Amazon has pushed into healthcare via its online service, including prescription delivery.
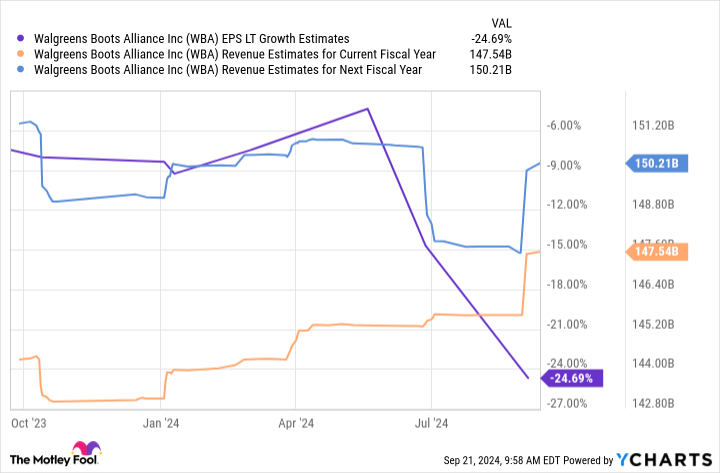
Analysts are currently pessimistic about Walgreens’ growth outlook. Estimates call for negative long-term earnings growth and low-single-digit revenue growth:
Walgreens more closely resembles a company barely holding on than a comeback story in motion. Dividends require healthy businesses to sustain them, and Walgreens isn’t there. Investors should avoid Walgreens stock and look for more durable dividend opportunities elsewhere.
Should you invest $1,000 in Walgreens Boots Alliance right now?
Before you buy stock in Walgreens Boots Alliance, consider this:
The Motley Fool Stock Advisor analyst team just identified what they believe are the 10 best stocks for investors to buy now… and Walgreens Boots Alliance wasn’t one of them. The 10 stocks that made the cut could produce monster returns in the coming years.
Consider when Nvidia made this list on April 15, 2005… if you invested $1,000 at the time of our recommendation, you’d have $712,454!*
Stock Advisor provides investors with an easy-to-follow blueprint for success, including guidance on building a portfolio, regular updates from analysts, and two new stock picks each month. The Stock Advisor service has more than quadrupled the return of S&P 500 since 2002*.
*Stock Advisor returns as of September 23, 2024
John Mackey, former CEO of Whole Foods Market, an Amazon subsidiary, is a member of The Motley Fool’s board of directors. Justin Pope has positions in Hims & Hers Health. The Motley Fool has positions in and recommends Amazon and S&P Global. The Motley Fool has a disclosure policy.
Should You Buy Walgreens Boots Alliance for Its 11.1% Dividend Yield? 3 Things to Know First was originally published by The Motley Fool
Decoding Alibaba Gr Hldgs's Options Activity: What's the Big Picture?
Financial giants have made a conspicuous bearish move on Alibaba Gr Hldgs. Our analysis of options history for Alibaba Gr Hldgs BABA revealed 95 unusual trades.
Delving into the details, we found 41% of traders were bullish, while 42% showed bearish tendencies. Out of all the trades we spotted, 21 were puts, with a value of $2,122,564, and 74 were calls, valued at $5,984,584.
Expected Price Movements
Based on the trading activity, it appears that the significant investors are aiming for a price territory stretching from $70.0 to $130.0 for Alibaba Gr Hldgs over the recent three months.
Volume & Open Interest Trends
Looking at the volume and open interest is an insightful way to conduct due diligence on a stock.
This data can help you track the liquidity and interest for Alibaba Gr Hldgs’s options for a given strike price.
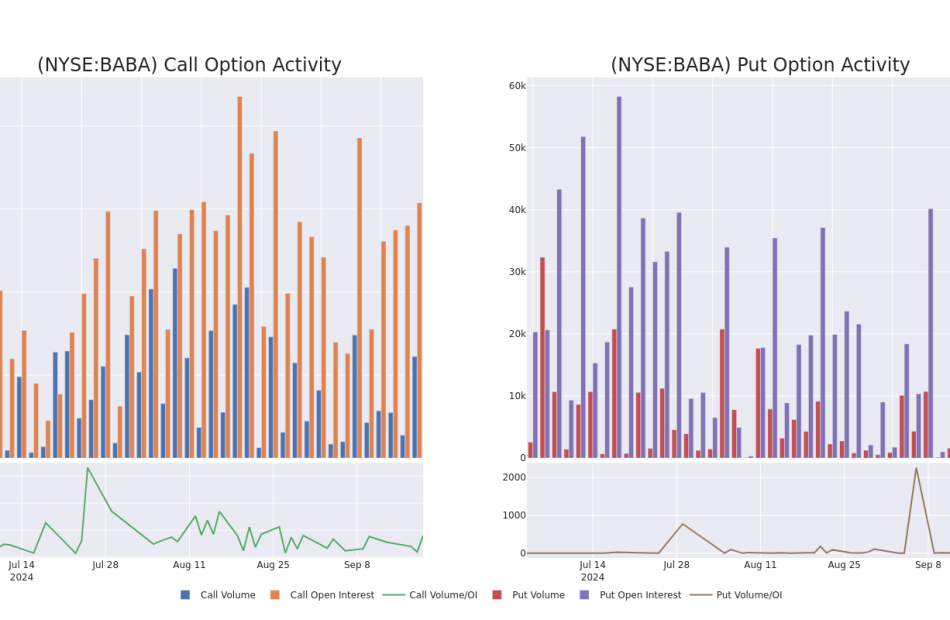
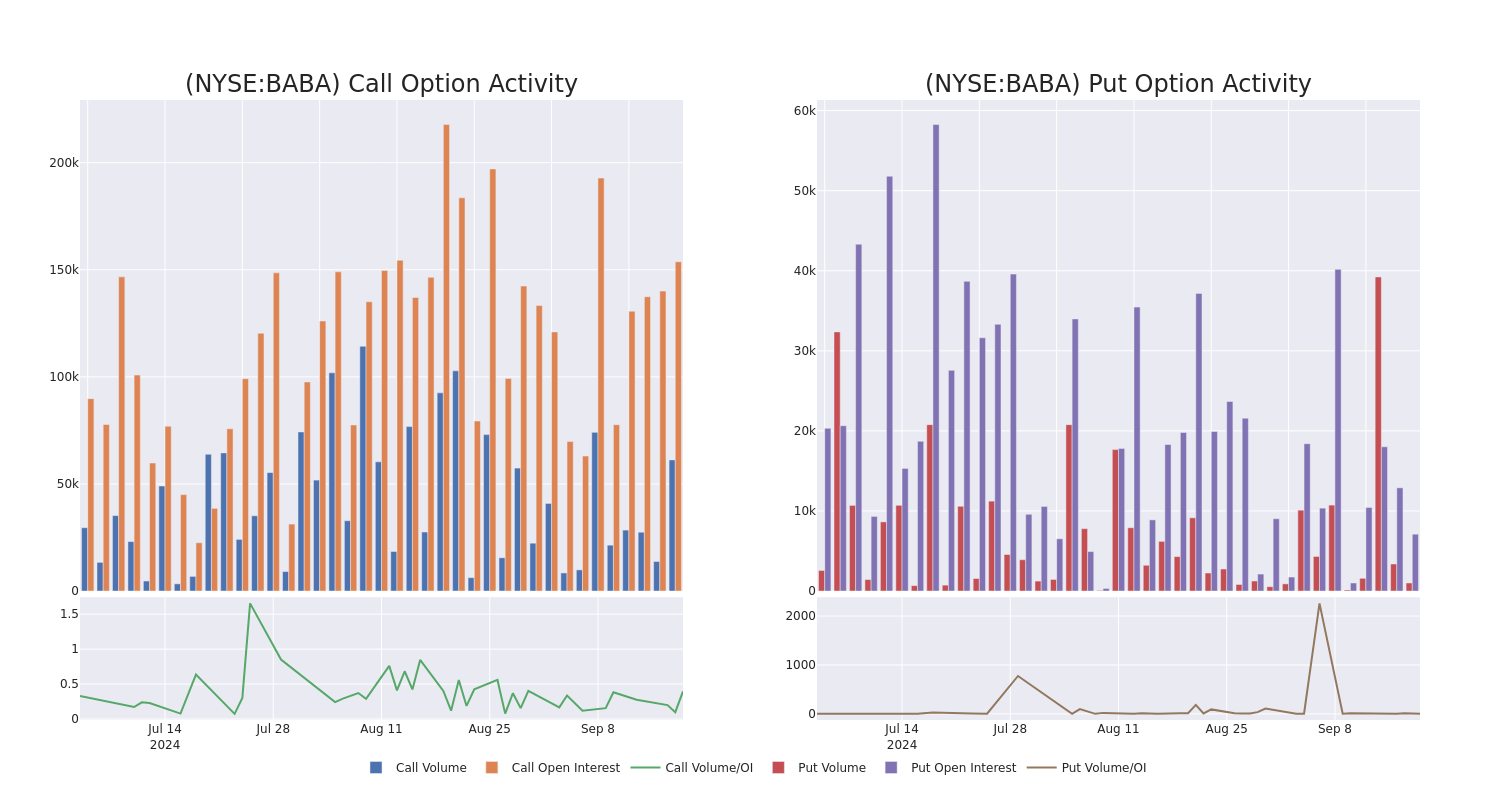
Below, we can observe the evolution of the volume and open interest of calls and puts, respectively, for all of Alibaba Gr Hldgs’s whale activity within a strike price range from $70.0 to $130.0 in the last 30 days.
Alibaba Gr Hldgs Option Activity Analysis: Last 30 Days
Biggest Options Spotted:
| Symbol | PUT/CALL | Trade Type | Sentiment | Exp. Date | Ask | Bid | Price | Strike Price | Total Trade Price | Open Interest | Volume |
|---|---|---|---|---|---|---|---|---|---|---|---|
| BABA | PUT | SWEEP | BULLISH | 12/20/24 | $3.45 | $3.3 | $3.35 | $90.00 | $381.6K | 1.3K | 1.7K |
| BABA | PUT | SWEEP | BULLISH | 01/15/27 | $28.3 | $27.5 | $27.35 | $115.00 | $219.0K | 0 | 80 |
| BABA | CALL | SWEEP | BEARISH | 10/18/24 | $1.79 | $1.74 | $1.74 | $100.00 | $193.7K | 20.8K | 9.1K |
| BABA | CALL | TRADE | BEARISH | 12/19/25 | $16.65 | $16.55 | $16.55 | $95.00 | $177.0K | 1.1K | 364 |
| BABA | CALL | SWEEP | BEARISH | 01/17/25 | $0.89 | $0.81 | $0.84 | $130.00 | $169.4K | 4.3K | 2.0K |
About Alibaba Gr Hldgs
Alibaba is the world’s largest online and mobile commerce company as measured by gross merchandise volume. It operates China’s online marketplaces, including Taobao (consumer-to-consumer) and Tmall (business-to-consumer). The China commerce retail division is the most valuable cash flow-generating business at Alibaba. Additional revenue sources include China commerce wholesale, international commerce retail/wholesale, local consumer services, cloud computing, digital media and entertainment platforms, Cainiao logistics services, and innovation initiatives/other.
After a thorough review of the options trading surrounding Alibaba Gr Hldgs, we move to examine the company in more detail. This includes an assessment of its current market status and performance.
Alibaba Gr Hldgs’s Current Market Status
- With a trading volume of 18,368,545, the price of BABA is down by -1.7%, reaching $95.54.
- Current RSI values indicate that the stock is may be overbought.
- Next earnings report is scheduled for 50 days from now.
What Analysts Are Saying About Alibaba Gr Hldgs
In the last month, 1 experts released ratings on this stock with an average target price of $115.0.
Unusual Options Activity Detected: Smart Money on the Move
Benzinga Edge’s Unusual Options board spots potential market movers before they happen. See what positions big money is taking on your favorite stocks. Click here for access.
* An analyst from Loop Capital persists with their Buy rating on Alibaba Gr Hldgs, maintaining a target price of $115.
Trading options involves greater risks but also offers the potential for higher profits. Savvy traders mitigate these risks through ongoing education, strategic trade adjustments, utilizing various indicators, and staying attuned to market dynamics. Keep up with the latest options trades for Alibaba Gr Hldgs with Benzinga Pro for real-time alerts.
Market News and Data brought to you by Benzinga APIs
© 2024 Benzinga.com. Benzinga does not provide investment advice. All rights reserved.
Warren Buffett is a fan of energy stocks. Here’s one more strong buy signal.
Warren Buffett isn’t the only one who likes the energy sector. Alongside Berkshire Hathaway’s BRK.A BRK.B huge purchases of Occidental Petroleum OXY shares, insiders at energy companies have been buying large amounts of stock for weeks and selling very little. Vickers Insider Weekly has singled out the energy sector as an insider favorite in four of the past five weeks, as of Sept. 16.
Buffett plus insiders is a powerful signal. Buffett likes Occidental Petroleum’s prodigious cash flow and extensive holdings in the U.S. Southwest’s Permian Basin, which helps make it a low-cost producer. But why are insiders buying?
Most Read from MarketWatch
In the big picture, it’s because energy-stock prices are seriously lagging. But the weakness won’t last forever. “Longer term, this is an industry that is going to grow,” says Hennessy Energy Transition Investor HNRGX portfolio manager Ben Cook. “There will be supportive commodity prices and good earnings and cash flow in the right companies. That’s attractive and the management teams know it. The insiders recognize there is good opportunity.”
Here’s how out-of-favor the energy sector is:
Unjustified discounts
These steep discounts seem odd for a half-dozen reasons, say energy-investing experts.
Energy companies have become much more shareholder-friendly in the past few years, Cook says. They have better capital-spending discipline, which creates strong free cash flow. They are returning much of that cash to shareholders via dividends and buybacks. “The insiders are saying, ‘I am willing to take the downside risk because the investment merit of these stocks has improved,’” Cook adds.
Plus, oil CL00 BRN00 prices will likely go higher from here. One reason is that the Middle East could be on the brink of a wider war. Yet oil has not budged in response. “The risk of geopolitical disruption is not priced into oil at all,” Cook says.
Global interest-rate cuts will help. Besides the Fed, central banks in Europe and Canada have been cutting rates to support growth. “That creates a healthy environment for energy demand,” says Cook. “A growing global economy and pursuit of higher quality of living in less-developed countries ultimately mean an increased need for energy.” Meanwhile, that capital discipline among U.S. producers keeps supply in check.
Global demand for U.S. energy also will support domestic producers and services companies. Global demand will grow at least in line with world GDP growth of 1.5%-2%, Thummel says. “Fossil fuels are over 80% of the global energy supply, and that will not dramatically change over the next few decades.” Meanwhile, global inventories and the U.S. strategic reserve are below historical level.
Artificial intelligence (AI) requires a lot of computing power, which uses a lot of electricity. This demand will favor natural-gas (NG) producers, notes Thummel, since power plants use a lot of NG. Green at Penn Capital points out that the shares of electric power producers such as Vistra VST, NRG Energy NRG and Talen Energy TLN have taken off this year. “The vast majority of that power will be from natural gas,” Green says. “But you have had no recognition of this in the price of exploration and production stocks and the service companies that provide the drilling rigs.”
The U.S. presidential election outcome will be OK for energy, no matter who wins. Democratic administrations are good for energy stocks because they often restrict supply, notes Green. Meanwhile, Donald Trump’s “drill baby drill” mantra might be irrelevant. “Trump won’t make energy companies drill like crazy because the investor base will not allow that,” Green says. Investors like the cash flow, dividends and share buybacks that come from capital spending discipline. “The only way they will drill more is if oil prices go up and their cash flow allows them to invest.”
Favored energy stocks to consider
Cook at Hennessy says oil-services giants Schlumberger SLB, Baker Hughes BKR and Halliburton HAL all have been disproportionately punished in the current energy-sector weakness. He favors quality energy companies with better balance sheets including Exxon Mobil XOM, Cheniere Energy LNG, EOG Resources EOG, NextEra Energy NEE and ConocoPhillips COP.
Thummel says Chevron CVX shares look excessively discounted because of overblown concerns about foreign investment, which he thinks will soon start paying off. He also singles out Diamondback Energy FANG in the belief that it could be an acquisition target as the consolidation among Permian Basin producers continues. “Diamondback is one of the last pure-play Permian producers with significant scale,” he says.
Energy stocks insiders are buying
Vickers Insider Weekly highlights bullish energy sector insider buying at: PBF Energy PBF; Texas Pacific Land TPL; Talos Energy TALO; Matador Resources MTDR; Comstock Resources CRK; Global Partners GLP; Hallador Energy HNRG; HighPeak Energy HPK; ProFrac Holding ACDC, and Granite Ridge Resources GRNT.
.
More: Nvidia’s stock is no longer the S&P 500’s top gainer this year. Here’s what is.
Most Read from MarketWatch
This Is What Whales Are Betting On Merck & Co
Financial giants have made a conspicuous bullish move on Merck & Co. Our analysis of options history for Merck & Co MRK revealed 9 unusual trades.
Delving into the details, we found 55% of traders were bullish, while 33% showed bearish tendencies. Out of all the trades we spotted, 4 were puts, with a value of $119,340, and 5 were calls, valued at $224,086.
Projected Price Targets
Taking into account the Volume and Open Interest on these contracts, it appears that whales have been targeting a price range from $100.0 to $120.0 for Merck & Co over the last 3 months.
Volume & Open Interest Trends
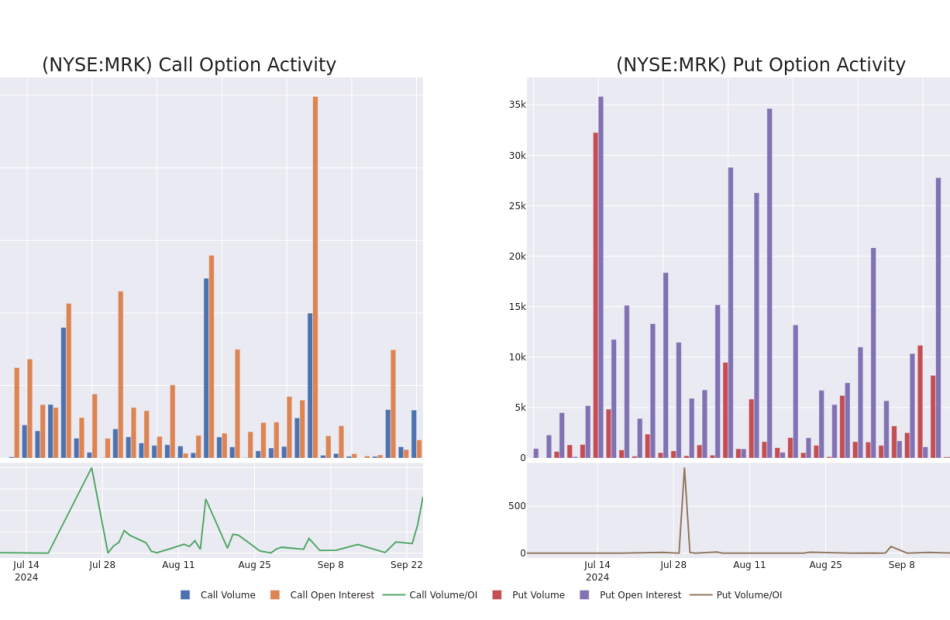
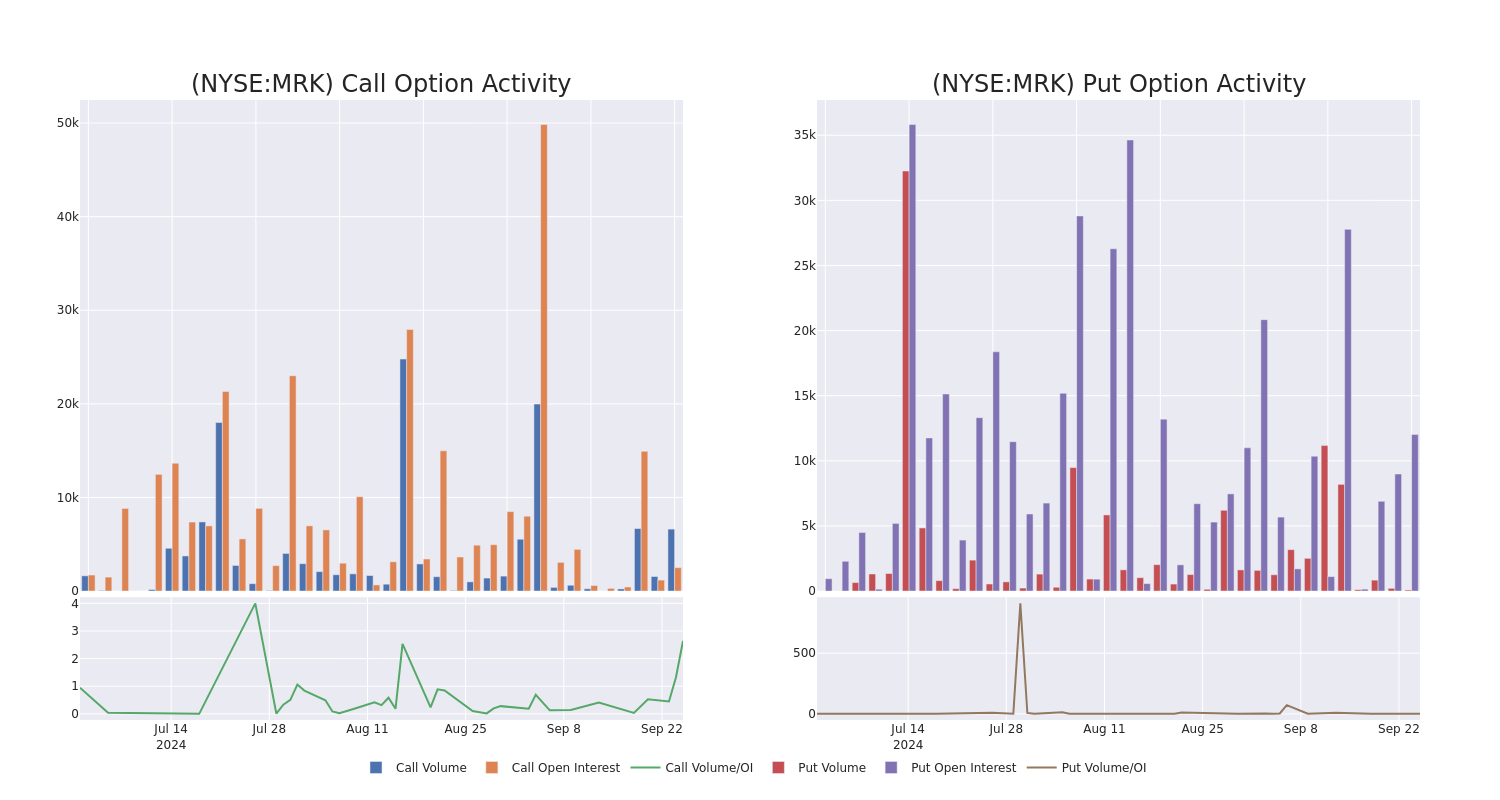
In today’s trading context, the average open interest for options of Merck & Co stands at 2075.86, with a total volume reaching 6,696.00. The accompanying chart delineates the progression of both call and put option volume and open interest for high-value trades in Merck & Co, situated within the strike price corridor from $100.0 to $120.0, throughout the last 30 days.
Merck & Co Option Volume And Open Interest Over Last 30 Days
Largest Options Trades Observed:
| Symbol | PUT/CALL | Trade Type | Sentiment | Exp. Date | Ask | Bid | Price | Strike Price | Total Trade Price | Open Interest | Volume |
|---|---|---|---|---|---|---|---|---|---|---|---|
| MRK | CALL | TRADE | BEARISH | 12/19/25 | $10.0 | $9.85 | $9.85 | $120.00 | $58.1K | 1.2K | 60 |
| MRK | CALL | TRADE | NEUTRAL | 01/16/26 | $24.5 | $20.0 | $21.9 | $100.00 | $56.9K | 318 | 26 |
| MRK | CALL | SWEEP | BEARISH | 10/18/24 | $0.99 | $0.95 | $0.95 | $118.00 | $44.4K | 972 | 1.6K |
| MRK | CALL | SWEEP | BULLISH | 10/18/24 | $0.9 | $0.88 | $0.9 | $118.00 | $36.9K | 972 | 2.8K |
| MRK | PUT | TRADE | BEARISH | 10/18/24 | $3.35 | $3.2 | $3.35 | $118.00 | $34.8K | 16 | 0 |
About Merck & Co
Merck makes pharmaceutical products to treat several conditions in a number of therapeutic areas, including cardiometabolic disease, cancer, and infections. Within cancer, the firm’s immuno-oncology platform is growing as a major contributor to overall sales. The company also has a substantial vaccine business, with treatments to prevent pediatric diseases as well as human papillomavirus, or HPV. Additionally, Merck sells animal health-related drugs. From a geographical perspective, just under half of the company’s sales are generated in the United States.
After a thorough review of the options trading surrounding Merck & Co, we move to examine the company in more detail. This includes an assessment of its current market status and performance.
Where Is Merck & Co Standing Right Now?
- With a volume of 7,899,351, the price of MRK is down -0.1% at $114.84.
- RSI indicators hint that the underlying stock is currently neutral between overbought and oversold.
- Next earnings are expected to be released in 36 days.
What Analysts Are Saying About Merck & Co
2 market experts have recently issued ratings for this stock, with a consensus target price of $155.0.
Unusual Options Activity Detected: Smart Money on the Move
Benzinga Edge’s Unusual Options board spots potential market movers before they happen. See what positions big money is taking on your favorite stocks. Click here for access.
* An analyst from Cantor Fitzgerald downgraded its action to Overweight with a price target of $155.
* An analyst from Cantor Fitzgerald has revised its rating downward to Overweight, adjusting the price target to $155.
Options trading presents higher risks and potential rewards. Astute traders manage these risks by continually educating themselves, adapting their strategies, monitoring multiple indicators, and keeping a close eye on market movements. Stay informed about the latest Merck & Co options trades with real-time alerts from Benzinga Pro.
Market News and Data brought to you by Benzinga APIs
© 2024 Benzinga.com. Benzinga does not provide investment advice. All rights reserved.
Deutsche Bank Loves This Stock Paying A Near 13% Dividend
Benzinga and Yahoo Finance LLC may earn commission or revenue on some items through the links below.
Global shipping doesn’t dominate the headlines like Big Tech or AI, but it is a mission-critical link in the global commerce chain. This business sector has quietly been building fortunes for investors for centuries, and that trend continues today. That helps explain why Deutsche Bank analysts are enamored with a global shipping stock paying a double-digit dividend.
Global shipping, like real estate, is an industry that has numerous different sectors. Although the most recognizable global shipping sector may be the flow of finished goods from China to Europe and the Americas, transporting raw materials like iron ore and aluminum is also very lucrative. This is known as the “dry bulk” sector, and it’s paying investors big dividends because without it, global manufacturing would come to a halt.
Don’t Miss Out:
Deutsche Bank analysts have noticed and believe the dry-bulk sector is rising. Their data shows that shipping rates for the Capesize ships that handle dry bulk products have gone from $9,000/day to $28,000/day in the last twelve months. That’s an increase of over 300%, which translates into serious profits for investors in dry bulk shipping companies.
One of those companies is Star Bulk Carriers (Nasdaq: SBLK). This is a rapidly growing global shipping company that handles a full range of dry bulk products, which are broken down into two sections:
· Major Bulk-(e.g. coal, grains, ore)
· Minor Bulk-(e.g. sugar, cement)
Star Bulk Carriers was already a global leader in the field when it acquired competitor Eagle Bulk in the last quarter of 2023. This $2.1 billion transaction made Star Bulk Carriers the largest bulk shipping company on the Nasdaq. It also allowed Star Bulk to expand its fleet, which now includes 161 ships of various sizes.
Trending: This billion-dollar fund has invested in the next big real estate boom, here’s how you can join for $10.
This is a paid advertisement. Carefully consider the investment objectives, risks, charges and expenses of the Fundrise Flagship Fund before investing. This and other information can be found in the Fund’s prospectus. Read them carefully before investing.
Star Bulk Carriers has a market cap of $2.46 billion, and it just reported blockbuster Q2 2024 earnings of $352.8 million. That was nearly a 50% improvement over the previous year, and the extra profits are leading to some impressive dividends. Star Bulk Carriers is paying a strong 12.8% dividend on its $21.86 share price. That means Star Bulk investors are set to earn $2.79/share for the upcoming quarter.
That’s a great return by any measure, and Star Bulk’s position as one of the largest operators in its sector indicates this company is primed for continued earnings. There is, of course, never a guarantee of future dividends, but it’s worth noting that Star Bulk Carriers has paid over $1.2 billion in investor dividends since 2021.
As always, remember that every business sector has risks, and global shipping is no different. Elevated fuel costs or a global economic slowdown could impact profits in the case of Star Bulk Carriers. With those caveats, Star Bulk Carriers has the potential to be a good dividend stock, and the fact that it’s available at an affordable share price doesn’t hurt either.
Wondering if your investments can get you to a $5,000,000 nest egg? Speak to a financial advisor today. SmartAsset’s free tool matches you up with up to three vetted financial advisors who serve your area, and you can interview your advisor matches at no cost to decide which one is right for you.
Keep Reading:
This article Deutsche Bank Loves This Stock Paying A Near 13% Dividend originally appeared on Benzinga.com
Looking At Charles Schwab's Recent Unusual Options Activity
Investors with a lot of money to spend have taken a bearish stance on Charles Schwab SCHW.
And retail traders should know.
We noticed this today when the trades showed up on publicly available options history that we track here at Benzinga.
Whether these are institutions or just wealthy individuals, we don’t know. But when something this big happens with SCHW, it often means somebody knows something is about to happen.
So how do we know what these investors just did?
Today, Benzinga‘s options scanner spotted 17 uncommon options trades for Charles Schwab.
This isn’t normal.
The overall sentiment of these big-money traders is split between 23% bullish and 70%, bearish.
Out of all of the special options we uncovered, 13 are puts, for a total amount of $944,461, and 4 are calls, for a total amount of $750,128.
Predicted Price Range
After evaluating the trading volumes and Open Interest, it’s evident that the major market movers are focusing on a price band between $40.0 and $75.0 for Charles Schwab, spanning the last three months.
Volume & Open Interest Development
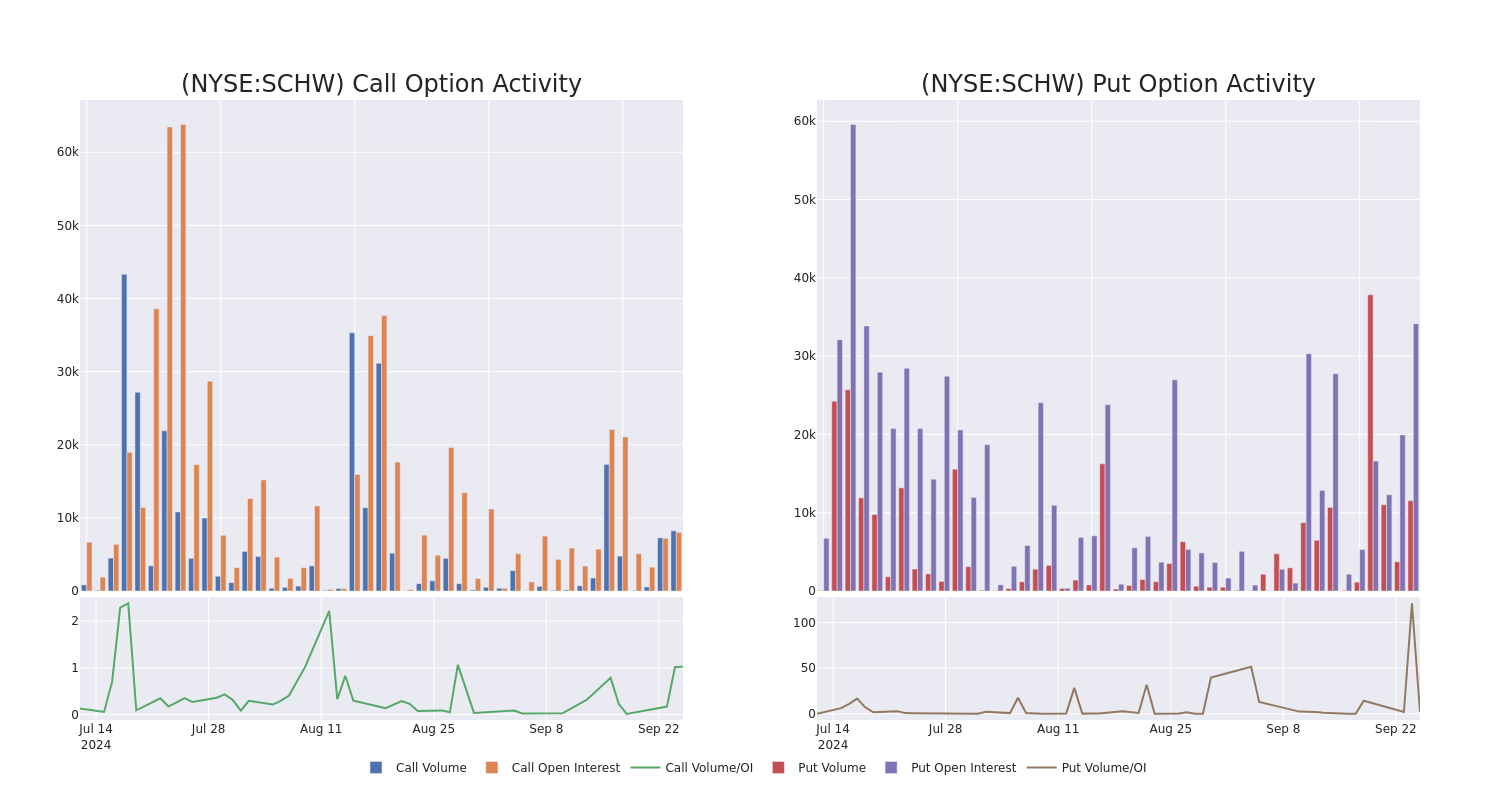
In terms of liquidity and interest, the mean open interest for Charles Schwab options trades today is 4687.22 with a total volume of 19,787.00.
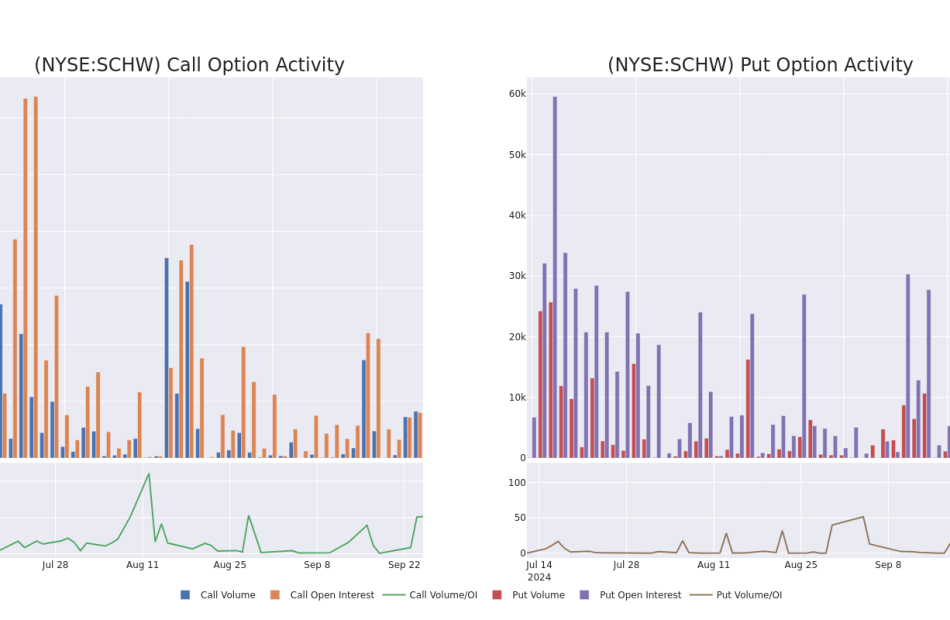
In the following chart, we are able to follow the development of volume and open interest of call and put options for Charles Schwab’s big money trades within a strike price range of $40.0 to $75.0 over the last 30 days.
Charles Schwab Option Volume And Open Interest Over Last 30 Days
Significant Options Trades Detected:
| Symbol | PUT/CALL | Trade Type | Sentiment | Exp. Date | Ask | Bid | Price | Strike Price | Total Trade Price | Open Interest | Volume |
|---|---|---|---|---|---|---|---|---|---|---|---|
| SCHW | CALL | TRADE | BEARISH | 01/17/25 | $1.08 | $1.05 | $1.06 | $75.00 | $530.0K | 7.3K | 6.5K |
| SCHW | PUT | SWEEP | BEARISH | 10/18/24 | $1.6 | $1.49 | $1.6 | $62.50 | $159.5K | 13.2K | 2.9K |
| SCHW | PUT | SWEEP | BEARISH | 10/18/24 | $1.41 | $1.33 | $1.41 | $62.50 | $155.5K | 13.2K | 1.1K |
| SCHW | CALL | TRADE | BULLISH | 01/17/25 | $1.04 | $0.99 | $1.02 | $75.00 | $153.0K | 7.3K | 1.5K |
| SCHW | PUT | SWEEP | BEARISH | 10/18/24 | $1.55 | $1.54 | $1.54 | $62.50 | $102.4K | 13.2K | 1.9K |
About Charles Schwab
Charles Schwab operates in brokerage, wealth management, banking, and asset management. It runs a large network of brick-and-mortar brokerage branch offices and a well-established online investing website, and it has mobile trading capabilities. It also operates a bank and a proprietary asset-management business and offers services to independent investment advisors. Schwab is among the largest firms in the investment business, with over $8 trillion of client assets at the end of December 2023. Nearly all of its revenue is from the United States.
In light of the recent options history for Charles Schwab, it’s now appropriate to focus on the company itself. We aim to explore its current performance.
Charles Schwab’s Current Market Status
- With a volume of 3,206,756, the price of SCHW is down -0.78% at $64.08.
- RSI indicators hint that the underlying stock is currently neutral between overbought and oversold.
- Next earnings are expected to be released in 20 days.
What The Experts Say On Charles Schwab
A total of 1 professional analysts have given their take on this stock in the last 30 days, setting an average price target of $70.0.
Unusual Options Activity Detected: Smart Money on the Move
Benzinga Edge’s Unusual Options board spots potential market movers before they happen. See what positions big money is taking on your favorite stocks. Click here for access.
* An analyst from Wells Fargo downgraded its action to Equal-Weight with a price target of $70.
Options trading presents higher risks and potential rewards. Astute traders manage these risks by continually educating themselves, adapting their strategies, monitoring multiple indicators, and keeping a close eye on market movements. Stay informed about the latest Charles Schwab options trades with real-time alerts from Benzinga Pro.
Market News and Data brought to you by Benzinga APIs
© 2024 Benzinga.com. Benzinga does not provide investment advice. All rights reserved.


