Home Buying Hounds Launch Cash for Houses Service in Fort Worth, Texas
Fort Worth, Texas, Sept. 30, 2024 (GLOBE NEWSWIRE) — Home Buying Hounds is excited to announce the launch of its cash for houses service in Fort Worth, Texas, which has been designed to offer individuals searching to “Sell Your House Fast In Texas” a quick and simple way to sell their properties without having to consider expensive and time-consuming repairs or renovations.
The cash for houses service by Home Buying Hounds leverages the trusted, local homebuying company’s extensive real estate experience to provide homeowners with a much simpler, easier, and quicker transaction than what is available via a traditional real estate transaction. With a skilled and knowledgeable team, the cash for houses company helps homeowners find a solution to their unique property situation
“Do you have a house in Texas that you need to sell fast? We’ll not only buy it fast with cash, but we’ll buy it as-is, meaning that you don’t have to clean or repair anything before you sell it to us,” said a spokesperson for Home Buying Hounds. “We are a cash home buyer program that’s based here in Texas. We regularly make fair and reasonable cash offers to homeowners throughout the area to help them sell their property.”
Serving Fort Worth and surrounding areas in Texas, Home Buying Hounds simplifies the difficult and complicated process of selling a house by offering cash payments for homes of those facing foreclosure risk, an upcoming auction, bankruptcy, a mortgage, probate outcome, overwhelming property tax payments, significant debt, liens, or an escrow a family wants to escape.
With competitive no-obligation offers and a closing schedule tailored to a homeowner’s specific needs and preferences, Home Buying Hounds cash for houses service provides a range of benefits. These include:
No Repairs: Home Buying Hounds buy properties in ‘as-is’ conditions, meaning that homeowners are under no obligation to fix, renovate, or even clean their property before selling. The professional team will take care of any repairs needed after the transaction is complete.
No Agents: With no realtors and no house listings, Home Buying Hounds removes the middleman from the house-selling process to offer a more streamlined approach that enables families to sell their houses stress-free and fast for cash.
No Fees: The latest figures show that when homeowners opt for the traditional real estate route to sell their homes, they will lose at least 6% of their money through associated fees and commissions.
“There’s absolutely no obligation to accept the cash that we offer and to sell your home to us, so why not find out what that offer is? You can then compare it with the other options that you’re considering as you decide the best way to sell your Texas real estate. Sell to us for a hassle-free experience!” furthered the spokesperson for Home Buying Hounds
Home Buying Hounds encourages homeowners seeking simplicity and ease, as well as cash offers without any fees cutting into the amount, to contact its expert team today at (833) 997-7653 or through the company’s website.
About Home Buying Hounds
Home Buying Hounds is a cash home buyer program that offers fast, transparent cash purchases to buy houses in Texas, eliminating traditional market complexities and delays. From offering a smooth closing and skipping time-consuming showings to providing a free cash offer, Home Buying Hounds helps individuals sell their homes in Texas.
More Information
To learn more about Home Buying Hounds and the launch of its cash for houses service in Fort Worth, Texas, please visit the website at https://www.homebuyinghounds.com/sell-my-house-fast-texas/.
Source: https://thenewsfront.com/home-buying-hounds-launch-cash-for-houses-service-in-fort-worth-texas/

Home Buying Hounds
249 NE 28th St
Fort Worth
Texas 76164
United States

(833) 997-7653

https://www.homebuyinghounds.com/sell-my-house-fast-texas/
Market News and Data brought to you by Benzinga APIs
© 2024 Benzinga.com. Benzinga does not provide investment advice. All rights reserved.
House Buying Heros Celebrate Being Rated the Top Cash Home Buying Company in Garland, Texas
Garland, Texas, Sept. 30, 2024 (GLOBE NEWSWIRE) — House Buying Heros, a leading cash home buyer company in Texas, is thrilled to announce the celebration of consistently receiving 5-star reviews across Google and Facebook to cement its position as the top cash home buying company in Garland, Texas.
In Garland, residents have long needed more options when it comes to selling their homes. Traditionally, they could choose to list their property, attempt to sell it independently or wait for a more opportune moment. Recognizing that many property owners either needed help or chose not to pursue the traditional route with agents, House Buying Heros stepped in to address this gap in the local market.
The company specializes in providing customized solutions to meet the unique needs of homeowners navigating challenging situations such as foreclosure, troublesome properties, and probate matters while offering a personalized approach to the home selling process that takes into account an individual’s unique needs, property and schedule to help them achieve their real estate goals without the stress.
House Buying Heros’ consistent high rating from its local community empowers the company to remain committed to providing a 5-star service to the Garland community to enable more individuals to bypass the conventional route and sell their homes fast and for cash.
“We’re absolutely delighted to be your preferred home buyers in Texas! At House Buying Heros, we’ve proudly established ourselves as the foremost house-buying company in the region, all thanks to our exceptional network of partners and investors,” said a spokesperson for House Buying Heros. “Leveraging our extensive expertise, we’ve meticulously developed a streamlined home-selling process designed to deliver an efficient and stress-free experience tailored just for you.”
With beneficial partnerships with other investors and years of real estate experience, House Buying Heros has the ability to provide homeowners with the most cost-effective offers on their homes without the additional need for them to complete extensive repairs or time-consuming renovations.
The top home-buying company is dedicated to helping homeowners sell their homes on their timeline and without the stress of enduring house listings, staging, and realtor commissions by providing instant, no-obligation cash offers. With no more dealing with agents worrying about deep cleaning or making expensive interior updates, House Buying Heros takes care of the details to guide each client smoothly toward the next chapter of their journey.
The spokesperson for House Buying Heros continued, “We’re here to make sure you receive a personalized and competitive cash offer that truly reflects your property’s value. Your time means a lot to us, so we promise not to present any offers that don’t do justice to your home. Our aim is to help you navigate the challenges often involved in traditional home selling, so you can focus on your future plans hassle-free.”
House Buying Heros encourages homeowners in Texas with any questions about its operations, the intricacies of property sales, or if they are interested in receiving an all-cash AS-IS offer on their property to reach out to its professional team today at (855) 563-4376.
About House Buying Heros
House Buying Heros is a leading cash home buyer company in Texas that has earned an outstanding reputation for offering fast, transparent cash purchases for houses in Garland, Texas. With the understanding that individuals may need to sell their burdensome property fast, House Buying Heros delivers competitive cash offers and stress-free transactions to help make selling a Texas home simple and fair.
More Information
To learn more about House Buying Heros and its celebration as the top cash home-buying company in Garland, Texas, please visit the website at https://www.housebuyingheros.com/sell-my-house-fast-texas/

House Buying Heros
1051 Northwest Highway
Garland
Texas 75041
United States

(855) 563-4376

https://www.housebuyingheros.com/sell-my-house-fast-texas/
Market News and Data brought to you by Benzinga APIs
© 2024 Benzinga.com. Benzinga does not provide investment advice. All rights reserved.
How To Earn $500 A Month From McCormick Stock Ahead Of Q3 Earnings
McCormick & Company, Incorporated MKC will release earnings results for its third quarter, before the opening bell on Tuesday, Oct. 1.
Analysts expect the Hunt Valley, Maryland-based company to report quarterly earnings at 67 cents per share, up from 65 cents per share in the year-ago period. McCormick is projected to post quarterly revenue of $1.67 billion, according to Benzinga Pro.
With the recent buzz around McCormick, some investors may be eyeing potential gains from the company’s dividends. As of now, McCormick has a dividend yield of 2.02%. That’s a quarterly dividend of 42 cents a share ($1.68 a year).
To earn $500 monthly from McCormick, start with the yearly target of $6,000 ($500 x 12 months).
Next, we take this amount and divide it by McCormick’s $1.68 dividend: $6,000 / $1.68 = 3,571 shares
So, an investor would need to own approximately $297,250 worth of McCormick, or 3,571 shares to generate a monthly dividend income of $500.
Assuming a more conservative goal of $100 monthly ($1,200 annually), we do the same calculation: $1,200 / $1.68 = 714 shares, or $59,433 to generate a monthly dividend income of $100.
Note that dividend yield can change on a rolling basis, as the dividend payment and the stock price both fluctuate over time.
The dividend yield is calculated by dividing the annual dividend payment by the current stock price. As the stock price changes, the dividend yield will also change.
For example, if a stock pays an annual dividend of $2 and its current price is $50, its dividend yield would be 4%. However, if the stock price increases to $60, the dividend yield would decrease to 3.33% ($2/$60).
Conversely, if the stock price decreases to $40, the dividend yield would increase to 5% ($2/$40).
Further, the dividend payment itself can also change over time, which can also impact the dividend yield. If a company increases its dividend payment, the dividend yield will increase even if the stock price remains the same. Similarly, if a company decreases its dividend payment, the dividend yield will decrease.
Price Action: Shares of McCormick edged lower by 0.01% to close at $83.24 on Friday.
On Sept. 17, Bank of America Securities analyst Peter Galbo maintained McCormick with a Buy rating and raised the price target from $86 to $95.
Read More:
Market News and Data brought to you by Benzinga APIs
© 2024 Benzinga.com. Benzinga does not provide investment advice. All rights reserved.
Smart Money Is Betting Big In INTC Options
Investors with a lot of money to spend have taken a bullish stance on Intel INTC.
And retail traders should know.
We noticed this today when the trades showed up on publicly available options history that we track here at Benzinga.
Whether these are institutions or just wealthy individuals, we don’t know. But when something this big happens with INTC, it often means somebody knows something is about to happen.
So how do we know what these investors just did?
Today, Benzinga‘s options scanner spotted 15 uncommon options trades for Intel.
This isn’t normal.
The overall sentiment of these big-money traders is split between 53% bullish and 33%, bearish.
Out of all of the special options we uncovered, 3 are puts, for a total amount of $251,075, and 12 are calls, for a total amount of $665,770.
What’s The Price Target?
After evaluating the trading volumes and Open Interest, it’s evident that the major market movers are focusing on a price band between $18.0 and $35.0 for Intel, spanning the last three months.
Analyzing Volume & Open Interest
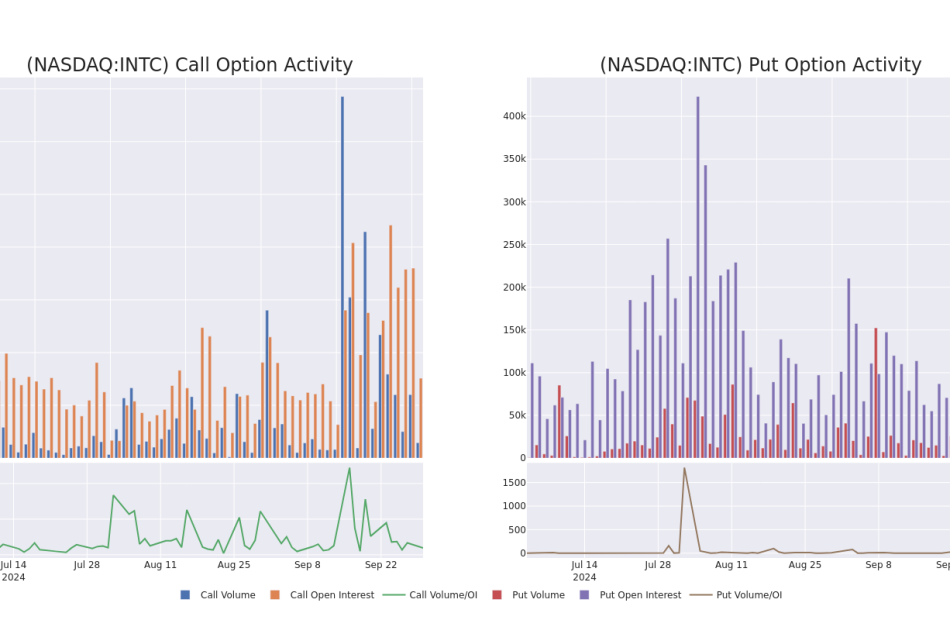
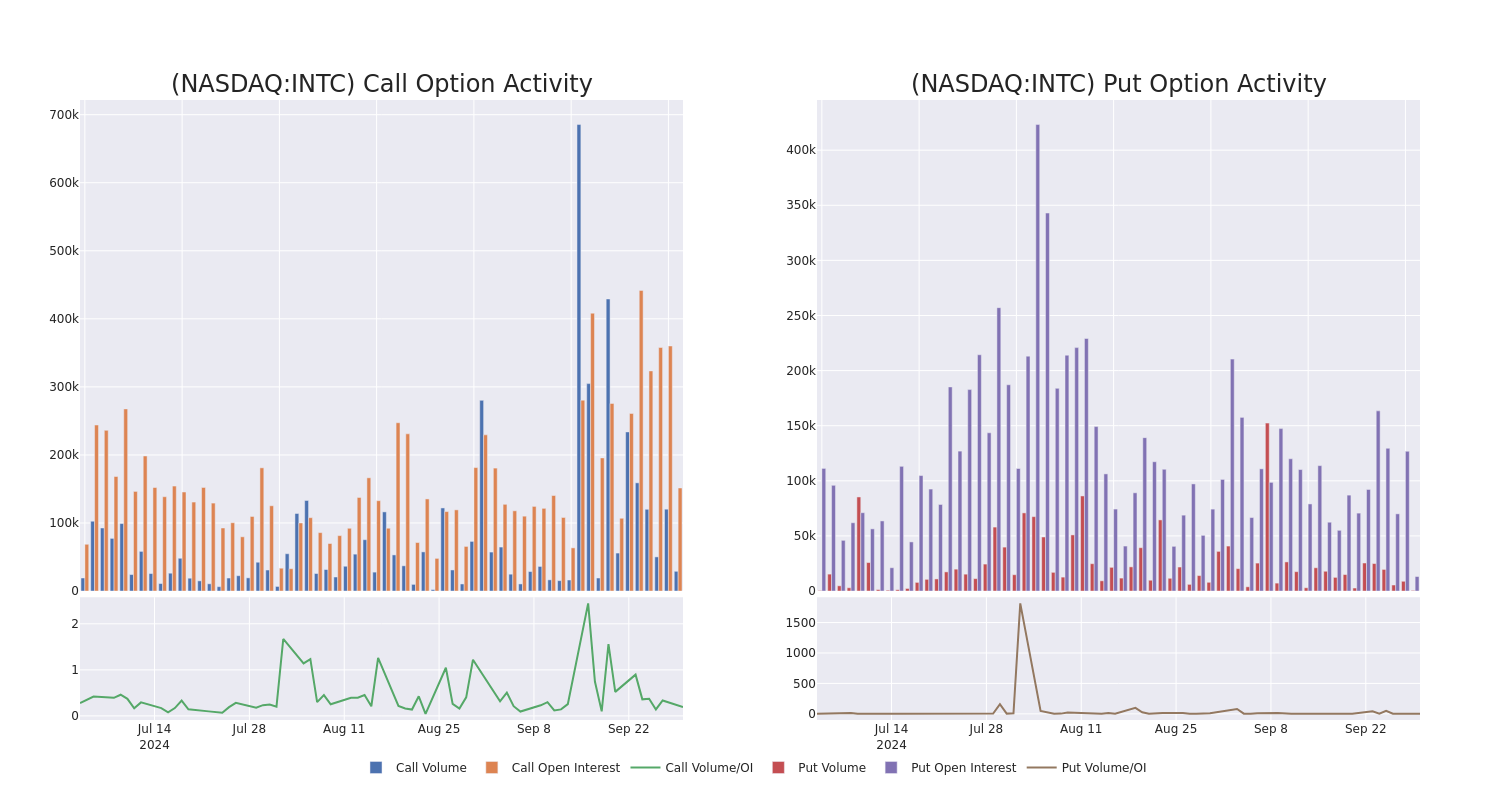
Assessing the volume and open interest is a strategic step in options trading. These metrics shed light on the liquidity and investor interest in Intel’s options at specified strike prices. The forthcoming data visualizes the fluctuation in volume and open interest for both calls and puts, linked to Intel’s substantial trades, within a strike price spectrum from $18.0 to $35.0 over the preceding 30 days.
Intel Call and Put Volume: 30-Day Overview
Noteworthy Options Activity:
| Symbol | PUT/CALL | Trade Type | Sentiment | Exp. Date | Ask | Bid | Price | Strike Price | Total Trade Price | Open Interest | Volume |
|---|---|---|---|---|---|---|---|---|---|---|---|
| INTC | PUT | TRADE | NEUTRAL | 01/15/27 | $13.3 | $12.9 | $13.1 | $35.00 | $131.0K | 59 | 150 |
| INTC | CALL | SWEEP | BEARISH | 12/20/24 | $0.8 | $0.79 | $0.79 | $29.00 | $118.5K | 33.3K | 3.1K |
| INTC | CALL | SWEEP | BEARISH | 12/20/24 | $0.81 | $0.79 | $0.79 | $29.00 | $118.5K | 33.3K | 1.6K |
| INTC | CALL | TRADE | BULLISH | 12/19/25 | $8.8 | $6.0 | $8.7 | $18.00 | $86.9K | 1.5K | 100 |
| INTC | PUT | SWEEP | NEUTRAL | 01/17/25 | $10.7 | $10.6 | $10.65 | $34.00 | $79.8K | 211 | 107 |
About Intel
Intel is a leading digital chipmaker, focused on the design and manufacturing of microprocessors for the global personal computer and data center markets. Intel pioneered the x86 architecture for microprocessors and was the prime proponent of Moore’s law for advances in semiconductor manufacturing. Intel remains the market share leader in central processing units in both the PC and server end markets. Intel has also been expanding into new adjacencies, such as communications infrastructure, automotive, and the Internet of Things. Further, Intel expects to leverage its chip manufacturing capabilities into an outsourced foundry model where it constructs chips for others.
After a thorough review of the options trading surrounding Intel, we move to examine the company in more detail. This includes an assessment of its current market status and performance.
Current Position of Intel
- With a volume of 20,349,013, the price of INTC is down -1.76% at $23.49.
- RSI indicators hint that the underlying stock may be approaching overbought.
- Next earnings are expected to be released in 24 days.
Turn $1000 into $1270 in just 20 days?
20-year pro options trader reveals his one-line chart technique that shows when to buy and sell. Copy his trades, which have had averaged a 27% profit every 20 days. Click here for access.
Options trading presents higher risks and potential rewards. Astute traders manage these risks by continually educating themselves, adapting their strategies, monitoring multiple indicators, and keeping a close eye on market movements. Stay informed about the latest Intel options trades with real-time alerts from Benzinga Pro.
Market News and Data brought to you by Benzinga APIs
© 2024 Benzinga.com. Benzinga does not provide investment advice. All rights reserved.
What the Options Market Tells Us About Exxon Mobil
Whales with a lot of money to spend have taken a noticeably bullish stance on Exxon Mobil.
Looking at options history for Exxon Mobil XOM we detected 13 trades.
If we consider the specifics of each trade, it is accurate to state that 53% of the investors opened trades with bullish expectations and 46% with bearish.
From the overall spotted trades, 4 are puts, for a total amount of $145,132 and 9, calls, for a total amount of $542,086.
Predicted Price Range
After evaluating the trading volumes and Open Interest, it’s evident that the major market movers are focusing on a price band between $110.0 and $120.0 for Exxon Mobil, spanning the last three months.
Insights into Volume & Open Interest
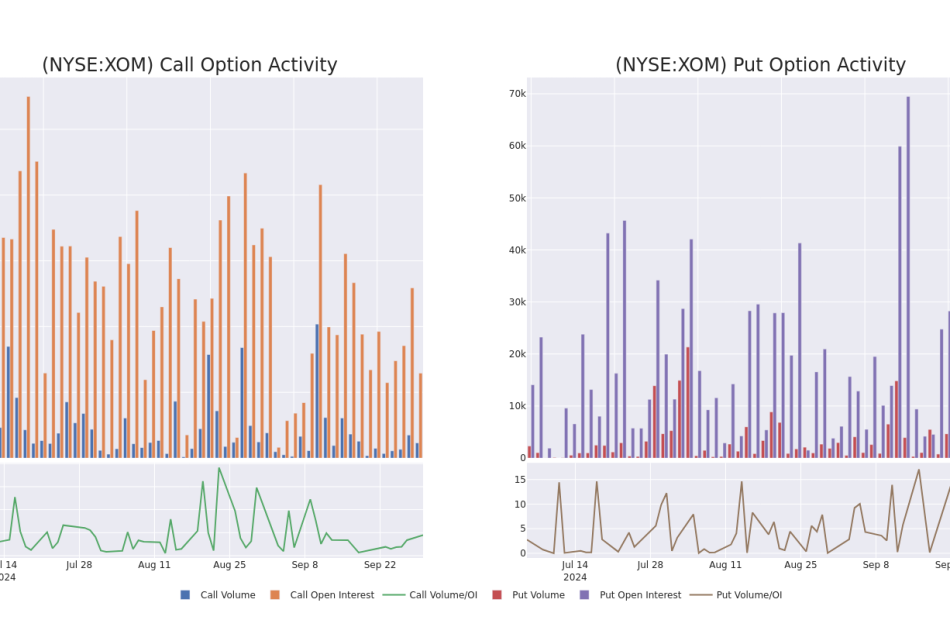
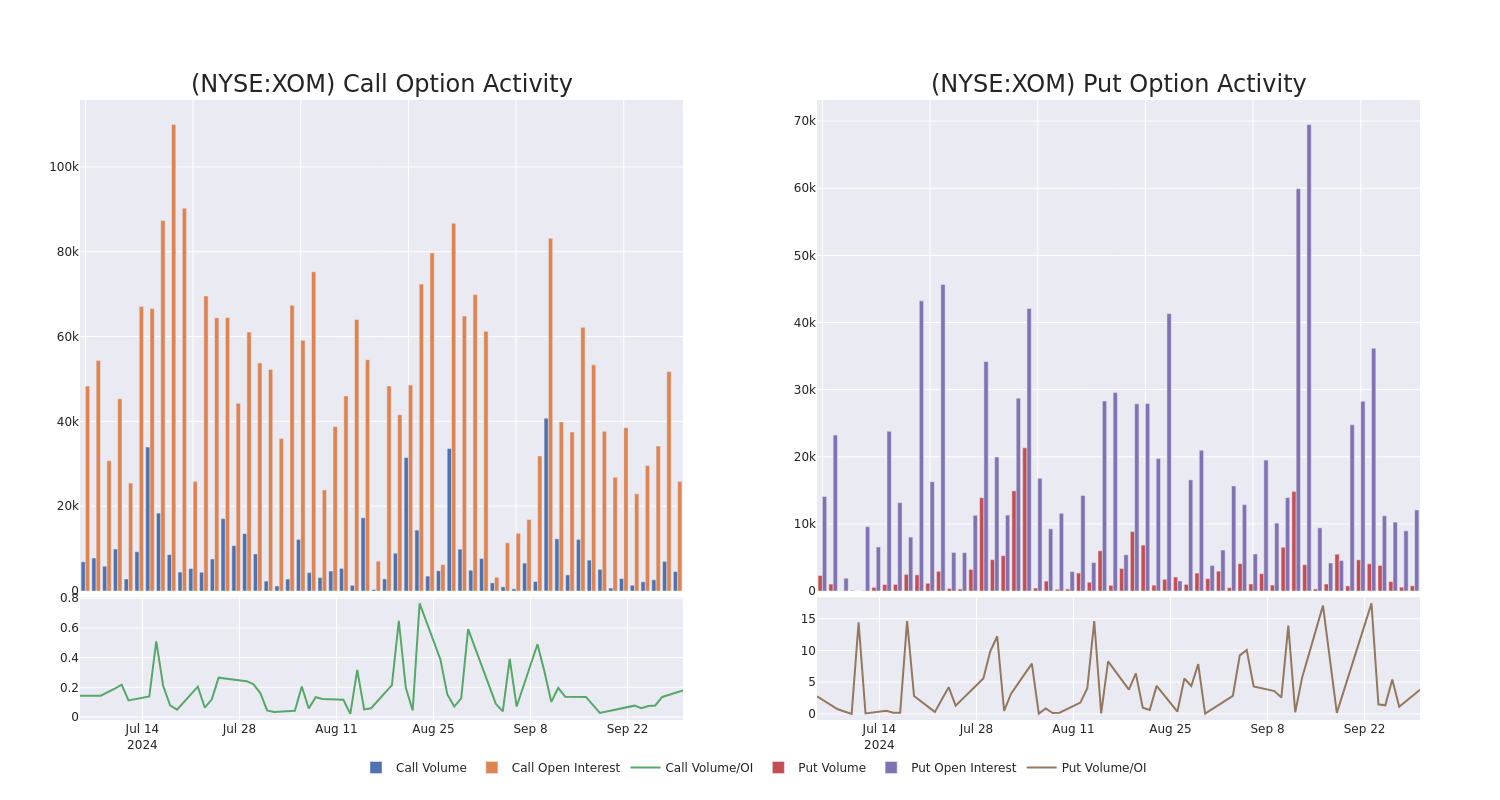
Assessing the volume and open interest is a strategic step in options trading. These metrics shed light on the liquidity and investor interest in Exxon Mobil’s options at specified strike prices. The forthcoming data visualizes the fluctuation in volume and open interest for both calls and puts, linked to Exxon Mobil’s substantial trades, within a strike price spectrum from $110.0 to $120.0 over the preceding 30 days.
Exxon Mobil 30-Day Option Volume & Interest Snapshot
Biggest Options Spotted:
| Symbol | PUT/CALL | Trade Type | Sentiment | Exp. Date | Ask | Bid | Price | Strike Price | Total Trade Price | Open Interest | Volume |
|---|---|---|---|---|---|---|---|---|---|---|---|
| XOM | CALL | SWEEP | BEARISH | 11/15/24 | $4.65 | $4.45 | $4.45 | $115.00 | $133.5K | 5.1K | 710 |
| XOM | CALL | TRADE | BULLISH | 11/15/24 | $4.45 | $4.35 | $4.45 | $115.00 | $88.5K | 5.1K | 210 |
| XOM | CALL | TRADE | BEARISH | 11/15/24 | $4.85 | $4.4 | $4.4 | $115.00 | $88.0K | 5.1K | 410 |
| XOM | CALL | SWEEP | BULLISH | 10/25/24 | $1.49 | $1.37 | $1.4 | $120.00 | $70.0K | 748 | 530 |
| XOM | PUT | TRADE | BULLISH | 12/20/24 | $2.64 | $2.56 | $2.59 | $110.00 | $41.4K | 4.3K | 186 |
About Exxon Mobil
ExxonMobil is an integrated oil and gas company that explores for, produces, and refines oil around the world. In 2023, it produced 2.4 million barrels of liquids and 7.7 billion cubic feet of natural gas per day. At the end of 2023, reserves were 16.9 billion barrels of oil equivalent, 66% of which were liquids. The company is one of the world’s largest refiners with a total global refining capacity of 4.5 million barrels of oil per day and is one of the world’s largest manufacturers of commodity and specialty chemicals.
Having examined the options trading patterns of Exxon Mobil, our attention now turns directly to the company. This shift allows us to delve into its present market position and performance
Current Position of Exxon Mobil
- With a trading volume of 3,110,001, the price of XOM is up by 0.66%, reaching $116.58.
- Current RSI values indicate that the stock is may be approaching overbought.
- Next earnings report is scheduled for 25 days from now.
What The Experts Say On Exxon Mobil
5 market experts have recently issued ratings for this stock, with a consensus target price of $135.4.
Turn $1000 into $1270 in just 20 days?
20-year pro options trader reveals his one-line chart technique that shows when to buy and sell. Copy his trades, which have had averaged a 27% profit every 20 days. Click here for access.
* An analyst from Wells Fargo has decided to maintain their Overweight rating on Exxon Mobil, which currently sits at a price target of $136.
* An analyst from Morgan Stanley has decided to maintain their Overweight rating on Exxon Mobil, which currently sits at a price target of $142.
* An analyst from UBS persists with their Buy rating on Exxon Mobil, maintaining a target price of $149.
* An analyst from Redburn Atlantic has revised its rating downward to Neutral, adjusting the price target to $120.
* Maintaining their stance, an analyst from Mizuho continues to hold a Neutral rating for Exxon Mobil, targeting a price of $130.
Options trading presents higher risks and potential rewards. Astute traders manage these risks by continually educating themselves, adapting their strategies, monitoring multiple indicators, and keeping a close eye on market movements. Stay informed about the latest Exxon Mobil options trades with real-time alerts from Benzinga Pro.
Market News and Data brought to you by Benzinga APIs
© 2024 Benzinga.com. Benzinga does not provide investment advice. All rights reserved.
Worried About a Stock Market Pullback? Buy This Vanguard ETF.
The S&P 500 just set another all-time high on its way to another strong year. The benchmark large-cap index has bested virtually every Wall Street forecast from the beginning of the year, and it’s now up 20% year to date.
However, there is reason to wonder whether the rally can continue. Some investors are concerned that artificial intelligence (AI) stocks are already overvalued, and there’s also evidence that the S&P 500’s valuation is getting stretched.
For example, the Vanguard S&P 500 ETF, which tracks the S&P 500, trades at a price-to-earnings (P/E) ratio of 28.7. That’s the highest it’s been since the pandemic’s height, and well above its historical average. In fact, the only times the index has been more expensive than it is now — during the dot-com bubble, the Great Recession, and the pandemic — a bear market has followed.
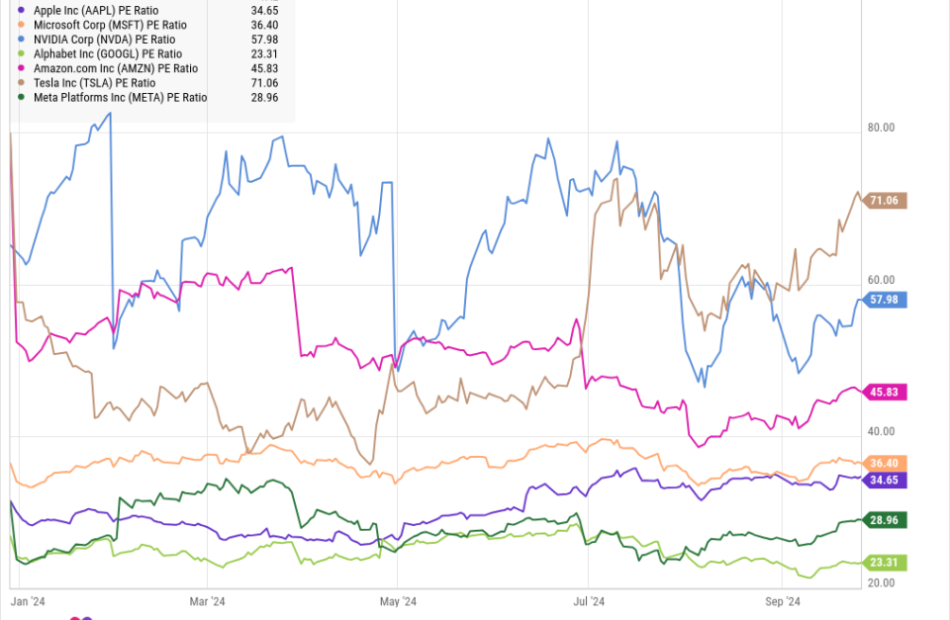
Looking at the biggest stocks in the S&P 500, you might also get the sense that the index is overvalued. The chart below shows the valuations of the “Magnificent Seven” stocks. As you can see, all but two are above 30, showing how pricey the most popular stocks are.
The valuations of all these stocks have expanded significantly, pushing into well above 30. That’s a ratio that typically reflects smaller growth stocks. While large-cap stocks have outperformed, leaving smaller companies behind, that could soon change.
It’s time for a rotation
This bull market isn’t unique. It’s typical for large caps to lead the early stages of a new rally, but bull markets tend to broaden over time as investors move into mid-caps and small-caps.
Considering valuations in the large-cap sector and the effect of falling interest rates, the rally in the Magnificent Seven stocks may have peaked. Most of them are trading below their 52-week highs, even as the S&P 500 just set another all-time high.
In order for stocks to continue to moving higher at this point, the rally needs to broaden. Expanding into small-caps, which have thus far lagged, would be the normal way for that to happen. That means the Vanguard Russell 2000 ETF (NASDAQ: VTWO) should be a winner as investors rotate out of large-cap stocks.
Why the Vanguard Russell 2000 ETF is a buy
Small-cap stocks have lagged behind their large-cap peers in the current bull market because they aren’t as directly exposed to the AI boom. Concerns have lingered about a potential recession due to elevated interest rates, high inflation, and a rising — but still small — unemployment rate.
However, the Vanguard Russell 2000 ETF is much cheaper than the S&P 500 index funds. It trades at a P/E ratio of 17, or a roughly 40% discount from the S&P 500. That’s too much of a discount for the market to continue to ignore it.
Furthermore, the Federal Reserve has begun a new interest rate cutting cycle, lowering the Fed Funds rate by 50 basis points last week. Lower interest rates tend to favor small-cap stocks because smaller companies tend to be more dependent on borrowing money and more at risk of going bankrupt. Therefore, they benefit more from lower interest rates than their more-established large-cap peers.
What’s next for the Vanguard small-cap fund
Small-caps have historically traded at a premium to their large-cap peers, at least over the last 20 years. During that period, the S&P Small-Cap 600 has traded at a P/E ratio of 1.32 times the S&P 500, according to research from RBC Wealth Management.
While the AI boom may offer one explanation for why that relationship is currently reversed, investors should expect the ratio to eventually revert to the mean over time. That means small-cap stocks will go up, large-caps will come down, or both.
In order for the Vanguard small-cap index to trade at 1.3 times the valuation of the S&P 500, it would have to double in price, at least without any change in its earnings. That’s unlikely to happen in the short term, but the math is favorable for small-cap investors over the coming years.
As interest rates go down, small-caps should narrow the historically large gap with the S&P 500, and that will make the Vanguard small-cap ETF a winner.
Should you invest $1,000 in Vanguard Russell 2000 ETF right now?
Before you buy stock in Vanguard Russell 2000 ETF, consider this:
The Motley Fool Stock Advisor analyst team just identified what they believe are the 10 best stocks for investors to buy now… and Vanguard Russell 2000 ETF wasn’t one of them. The 10 stocks that made the cut could produce monster returns in the coming years.
Consider when Nvidia made this list on April 15, 2005… if you invested $1,000 at the time of our recommendation, you’d have $743,952!*
Stock Advisor provides investors with an easy-to-follow blueprint for success, including guidance on building a portfolio, regular updates from analysts, and two new stock picks each month. The Stock Advisor service has more than quadrupled the return of S&P 500 since 2002*.
*Stock Advisor returns as of September 23, 2024
Jeremy Bowman has no position in any of the stocks mentioned. The Motley Fool has no position in any of the stocks mentioned. The Motley Fool has a disclosure policy.
Worried About a Stock Market Pullback? Buy This Vanguard ETF. was originally published by The Motley Fool
Price Over Earnings Overview: Permian Resources
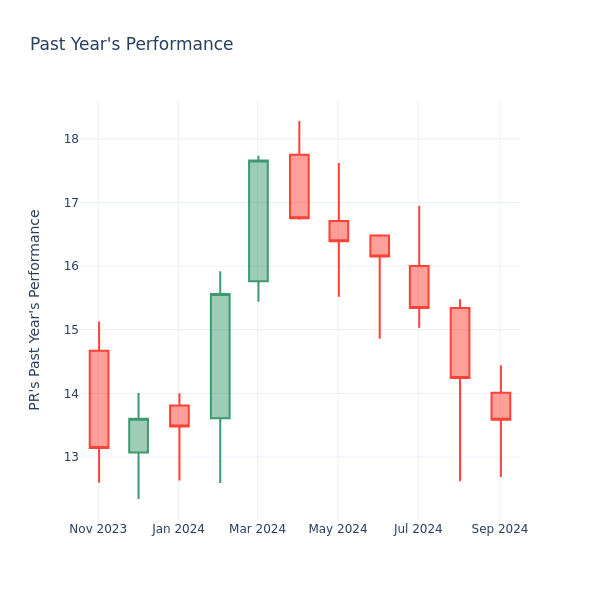
In the current market session, Permian Resources Inc. PR share price is at $13.59, after a 0.59% increase. Moreover, over the past month, the stock fell by 1.31%, but in the past year, increased by 1.12%. Shareholders might be interested in knowing whether the stock is overvalued, even if the company is performing up to par in the current session.
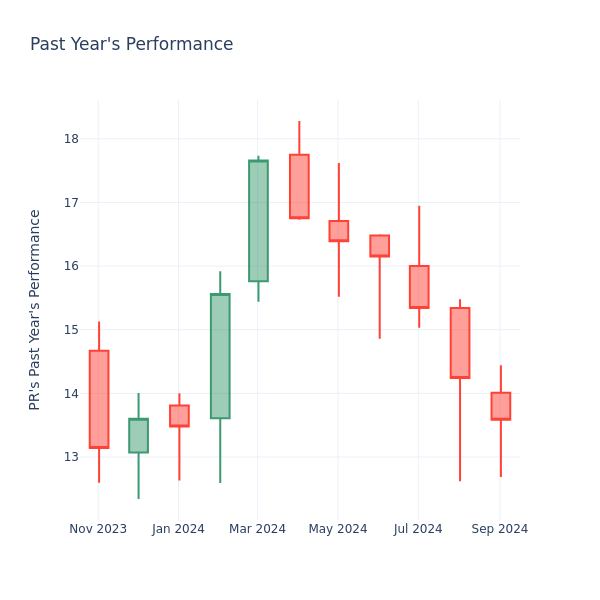
Permian Resources P/E Compared to Competitors
The P/E ratio is used by long-term shareholders to assess the company’s market performance against aggregate market data, historical earnings, and the industry at large. A lower P/E could indicate that shareholders do not expect the stock to perform better in the future or it could mean that the company is undervalued.
Compared to the aggregate P/E ratio of the 17.46 in the Oil, Gas & Consumable Fuels industry, Permian Resources Inc. has a lower P/E ratio of 10.16. Shareholders might be inclined to think that the stock might perform worse than it’s industry peers. It’s also possible that the stock is undervalued.
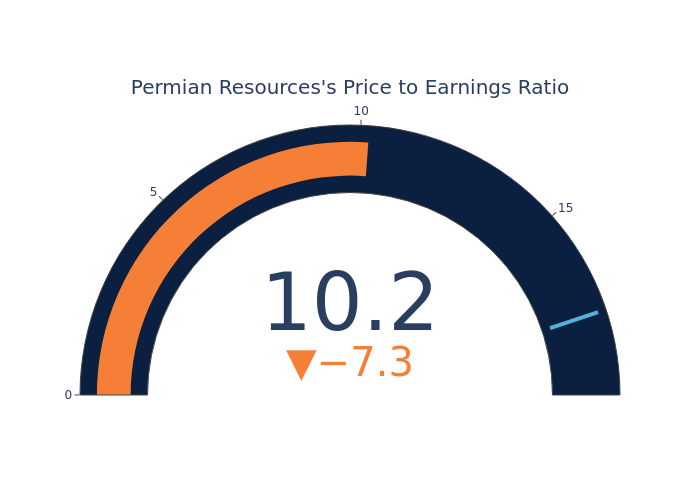
In summary, while the price-to-earnings ratio is a valuable tool for investors to evaluate a company’s market performance, it should be used with caution. A low P/E ratio can be an indication of undervaluation, but it can also suggest weak growth prospects or financial instability. Moreover, the P/E ratio is just one of many metrics that investors should consider when making investment decisions, and it should be evaluated alongside other financial ratios, industry trends, and qualitative factors. By taking a comprehensive approach to analyzing a company’s financial health, investors can make well-informed decisions that are more likely to lead to successful outcomes.
Market News and Data brought to you by Benzinga APIs
© 2024 Benzinga.com. Benzinga does not provide investment advice. All rights reserved.
Antelope Enterprise Announces First Half 2024 Financial Results
NEW YORK, Sept. 30, 2024 (GLOBE NEWSWIRE) — Antelope Enterprise Holdings Limited (NASDAQ Capital Market: AEHL) (“Antelope Enterprise”, “AEHL” or the “Company”), is the majority owner of Hainan Kylin Cloud Services Technology Co., Ltd (“Kylin Cloud”), the operator of a livestreaming ecommerce business in China, and the Company expects to shortly enter the energy field through the production of electricity in Texas using natural gas generators, today announced its financial results for the six months ended June 30, 2024.
First Half 2024 Summary
- Revenue generated from the livestreaming ecommerce business was $43.4 million, a 2.6% decrease as compared to $44.6 million for the same period of 2023.
- Gross profit generated from the livestreaming ecommerce business was $3.5 million, a 48.7% decrease as compared to $6.8 million for the same period of 2023.
- Loss from operations from the livestreaming ecommerce business was $6.5 million, as compared to loss from operations of $5.5 million for the same period of 2023.
Will Zhang, Chairman and CEO of Antelope Enterprise, commented, “The revenue for the livestreaming ecommerce business segment came in at $43.4 million for the first six months of 2024, modestly lower than the $44.6 million in revenue recorded for the six months of 2023. This slight decline was due to loss of a few major clients and a change in business strategy to secure a larger number of mid-tier clients to help to mitigate the risk of retaining major clients. Our majority-owned Kylin Cloud subsidiary had engagements with more than 70 clients in the first half of 2024 represents an increase of nearly 20 clients compared to the same period in 2023.”
“Kylin Cloud provides turnkey livestreaming marketing and broadcasting services to consumer brand companies by matching consumer brand products with the appropriate hosts and influencers. We believe that there is a tremendous market opportunity ahead for livestreaming ecommerce and believe that Kylin Cloud has the resources, infrastructure and team culture to achieve sustained growth in this B2C ecosystem,” CEO Will Zhang continued.
“In an important strategic development for the Company, we recently announced that we are planning to enter the energy field in the third quarter of 2024, and that we are going to launch this business in Texas to meet the rapidly growing needs of the computing power industry. We believe that our new positioning in the energy supply sector is extremely timely to meet the high expected demand for energy due to the growth of these sectors,” concluded Chairman and CEO Will Zhang.
Six Months Results Ended June 30, 2024
Revenue for the six months ended June 30, 2024 was $43.5 million, a decrease of $1.1 million or 2.6% from $44.6 million for the same period of 2023. The decrease in revenue was due to the loss of a few of the livestreaming businesses’ major clients in the current period. This propelled a change in business strategy to focus on securing a larger number of mid-tier clients to mitigate the risk associated with an over-concentration of major clients. In the first half of 2024, we had business engagements with more than 70 clients which represented an increase of nearly 20 clients compared to the same period in 2023.
Gross profit for the six months ended June 30, 2024 was $3.5 million, a decrease of $3.3 million or 48.7% as compared to $6.8 million for the same period of 2023. The decrease in gross profit was due to the decrease in revenue and an increase in the cost of goods sold of $2.1 million or 5.7% in the current period. The increase in cost of goods sold was due to increased training, management and support costs attributable to the livestreaming businesses’ focus on mid-tier clients. For the first half of 2024, the gross profit margin was 8.0% for the livestreaming ecommerce business as compared to a gross profit margin of 15.3% for the first half of 2023.
Other income for the six months ended June 30, 2024 was $0.7 million, an increase of $0.2 million or 59.2% as compared to $0.4 million for the same period of 2023. Other income primarily consists of interest income of $0.2 million and other income of $0.4 million.
Selling and distribution expenses for the six months ended June 30, 2024 were $3.1 million, a decrease of $4.0 million or 55.9% as compared to $7.1 million for the same period of 2023. The decrease in selling and distribution expenses was due to decreased advertising and promotion expenses of $3.5 million and decreased commission expenses of $0.5 million.
Administrative expenses for the six months ended June 30, 2024 were $6.9 million, an increase of $1.3 million or 22.8% as compared to $5.6 million for the same period of 2023. The increase in administrative expenses was due to an increase in stock compensation expense of $0.8 million and the $0.5 million increase in professional service expenses.
Loss from continuing operations before taxation for the six months ended June 30, 2024 was $6.5 million, an increase of $1.1 million or 19.3% as compared to a loss from continuing operations before taxation of $5.5 million for the same period of 2023. The increase was due to the decrease in gross profit in the current period as compared to the same period of 2023, as described above, as well as an increase in administrative expenses which was partly offset by a decrease in selling and distribution expenses.
Loss per basic share and fully diluted share from continuing operations for the six months ended June 30, 2024 were $0.96, as compared to loss per basic and fully diluted share of $3.38 for the same period of 2023.
Financial Condition
As of June 30, 2024, the Company had $2.3 million in cash and cash equivalents, an increase of $1.7 million or 333.2% as compared to $0.6 million as of December 31, 2023. As of June 30, 2024, working capital (current assets minus current liabilities) was $5.8 million and the current ratio (current assets divided by current liabilities) was 2.6 times, as compared to working capital of $4.2 million and a current ratio of 8.0 times as of December 31, 2023. Stockholders’ equity as of June 30, 2024 was $18.0 million, an increase of $3.6 million or 25.2% as compared to $14.4 million as of December 31, 2023.
Liquidity and Capital Resources
Our cash flow analysis for each of the accounts includes the cash flow transactions of discontinued operations.
Cash flow used in operating activities was $7.2 million for the six months ended June 30, 2024, an increase of $1.6 million as compared to $5.6 million for the same period of 2023. The increase of cash outflow was mainly due to an increase in cash outflow on loan receivables of $0.9 million, an increase in cash outflow on other receivables and prepayments of $0.9 million, and increased cash outflow on trade receivables of $1.5 million. This was partly offset by a decrease in operating cash outflow before working capital changes of $0.6 million, a decrease in cash outflow from trade payable of $0.7 million, a decrease in cash outflow on accrued liabilities and other payables of $0.8 million, a decrease in cash outflow on taxes payable of $0.6 million and increased cash inflow on unearned revenue of $0.9 million. Also, there was cash inflow from operating activities of $2.0 million from our discontinued operations for the six months ended June 30, 2023.
Cash flow used in investing activities was $0.3 million, compared to a cash inflow of $0.3 million for the same period of 2023. The increase in cash outflow was mainly due to the acquisition of fixed assets of $1.8 million, which was partly offset by collection of note receivable of $1.5 million and decrease in restricted cash of $0.1 million.
Cash flow generated from financing activities was $10.1 million for the six months ended June 30, 2024, compared to $5.7 million for the same period of 2023, primarily due to an increase in the proceeds from warrants exercised of $1.2 million and an increase in proceeds from a promissory note of $4.6 million. This was partly offset by a decrease in equity financing of $3.4 million for the six months ended June 30, 2024 compared with the six months ended June 30, 2023. For the six months ended June 30, 2023, net cash used in financing activities includes a cash outflow of $2.1 million from our discontinued operations.
Business Outlook
We own a majority position of a livestreaming ecommerce business, Hainan Kylin Cloud Services Technology Co., Ltd (“Kylin Cloud”), and aim to launch an energy supply business in the third quarter of 2024. Kylin Cloud’s SaaS+ systems platform strategically matches hosts and influencers to consumer brand products which results in increased sales for these companies.
In the last few years, livestreaming ecommerce has comprised an ever-increasing percentage of China’s ecommerce sales which we expect to continue in the years ahead, spurred by a consumer ecosystem that includes a young demographic and their high usage rate of mobile devices. We believe that Kylin Cloud is unique in the livestreaming space since it utilizes advanced analytics that matches hosts and influencers to consumer brand products which facilitates unique content for higher conversion rates as compared to traditional ecommerce.
In the current period, the business strategy of the livestreaming business was modified to focus on securing a larger number of mid-tier clients to mitigate the risk associated with an over-concentration of major clients. Since some of these new clients are still in the beginning stages of collaboration and their business volume has just started to grow, it will take time for the new mid-tier clients to develop and increase their sales volume. In the first half of 2024, the livestreaming business had business engagements with more than 70 clients, which represented an increase of nearly 20 clients compared to the same period in 2023.
In an important strategic development for the Company, we recently announced plans to enter the energy field through the production of electricity using natural gas generators in Texas. This electricity would then be transmitted directly to rapidly growing computing power sectors who require high amounts of energy. Compared to conventional methods, this model eliminates intermediary steps like transmission to the power grid and processing by public utilities, which could result in lower energy losses and higher efficiency. Given the strong market demand of computing power industries, the Company believes it has a runway for significant growth in the near future.
This business outlook reflects the Company’s current and preliminary views and is based on the information currently available to us, which are subject to change, and is subject to risks and uncertainties, as well as risks and uncertainties identified in the Company’s public filings.
Conference Call Information
We will host a conference call at 8:00 am ET on September 30, 2024. Listeners may access the call by dialing 1-844-695-5522 five to ten minutes prior to the scheduled conference call time, and international callers should dial 1-412-317-0698; all callers should ask to join the Antelope Enterprise Holdings Ltd. earnings conference call. A replay of the conference call will be available for 14 days starting from 11:00 am ET on September 30, 2024. To access the replay, dial 1-877-344-7529 and international callers should dial 1-412-317-0088. The replay access code is 7480379.
About Antelope Enterprise Holdings Limited
Antelope Enterprise Holdings Limited Limited (“Antelope Enterprise”, “AEHL” or the “Company”), is the 51% owner of Hainan Kylin Cloud Services Technology Co., Ltd (“Kylin Cloud”), the operator of a growing livestreaming ecommerce business in China with access to 800,000+ hosts and influencers. Through its wholly owned US subsidiary, AEHL US LLC, the Company expects to begin generating electricity for the rapidly growing needs of Company expects to begin generating electricity for the rapidly growing needs of computing power industries in the fourth quarter of 2024. For more information, please visit our website at https://aehltd.com/.
Safe Harbor Statement
Certain of the statements made in this press release are “forward-looking statements” within the meaning and protections of Section 27A of the Securities Act of 1933, as amended, and Section 21E of the Securities Exchange Act of 1934, as amended. Forward-looking statements include statements with respect to our beliefs, plans, objectives, goals, expectations, anticipations, assumptions, estimates, intentions, and future performance, and involve known and unknown risks, uncertainties and other factors, which may be beyond our control, and which may cause the actual results, performance, capital, ownership or achievements of the Company to be materially different from future results, performance or achievements expressed or implied by such forward-looking statements. Forward-looking statements in this press release include, without limitation, the continued stable macroeconomic environment in the PRC, the PRC technology sectors continuing to exhibit sound long-term fundamentals, and our ability to continue to grow our energy, livestreaming ecommerce, business management and information system consulting businesses. All statements other than statements of historical fact are statements that could be forward-looking statements. You can identify these forward-looking statements through our use of words such as “may,” “will,” “anticipate,” “assume,” “should,” “indicate,” “would,” “believe,” “contemplate,” “expect,” “estimate,” “continue,” “plan,” “point to,” “project,” “could,” “intend,” “target” and other similar words and expressions of the future. Although the Company believes that the expectations expressed in these forward-looking statements are reasonable, it cannot assure you that such expectations will turn out to be correct, and the Company cautions investors that actual results may differ materially from the anticipated results and encourages investors to review other factors that may affect its future results in the Company’s registration statement and other filings with the U.S. Securities and Exchange Commission.
All written or oral forward-looking statements attributable to us are expressly qualified in their entirety by this cautionary notice, including, without limitation, those risks and uncertainties described in our annual report on Form 20-F for the year ended December 31, 2023 and otherwise in our SEC reports and filings. Such reports are available upon request from the Company, or from the Securities and Exchange Commission, including through the SEC’s Internet website at http://www.sec.gov. We have no obligation and do not undertake to update, revise or correct any of the forward-looking statements after the date hereof, or after the respective dates on which any such statements otherwise are made.
FINANCIAL TABLES FOLLOW
ANTELOPE ENTERPRISE HOLDINGS., LTD AND SUBSIDIARIES
CONDENSED CONSOLIDATED STATEMENTS OF FINANCIAL POSITION
| As of June 30, 2024 | As of December 31, 2023 | |||||||
| USD’000 | USD’000 | |||||||
| (Unaudited) | (Audited) | |||||||
| ASSETS AND LIABILITIES | ||||||||
| NONCURRENT ASSETS | ||||||||
| Property and equipment, net | 1,946 | 161 | ||||||
| Intangible assets, net | 1 | 1 | ||||||
| Right-of-use assets, net | 310 | – | ||||||
| Security deposit | 166 | – | ||||||
| Loan receivable | 10,768 | 5,181 | ||||||
| Note Receivable | 5,490 | 6,949 | ||||||
| Total noncurrent assets | 18,681 | 12,292 | ||||||
| CURRENT ASSETS | ||||||||
| Trade receivable | 1,508 | – | ||||||
| Other receivables and prepayments | 4,367 | 2,871 | ||||||
| Available-for-sale financial assets | – | 99 | ||||||
| Due from related parties | 1,286 | 1,316 | ||||||
| Cash and bank balances | 2,322 | 536 | ||||||
| Total current assets | 9,483 | 4,822 | ||||||
| Total assets | 28,164 | 17,114 | ||||||
| CURRENT LIABILITIES | ||||||||
| Trade payables | 639 | – | ||||||
| Accrued liabilities and other payables | 1,077 | 216 | ||||||
| Unearned revenue | 1,009 | 27 | ||||||
| Amounts owed to related parties | 53 | 78 | ||||||
| Lease liabilities | 117 | – | ||||||
| Taxes payable | 763 | 281 | ||||||
| Total current liabilities | 3,658 | 602 | ||||||
| NET CURRENT ASSETS | 5,825 | 4,220 | ||||||
| NONCURRENT LIABILITIES | ||||||||
| Lease liabilities | 227 | – | ||||||
| Note payable | 6,245 | 2,111 | ||||||
| Total noncurrent liabilities | 6,472 | 2,111 | ||||||
| Total liabilities | 10,130 | 2,713 | ||||||
| NET ASSETS | 18,034 | 14,401 | ||||||
| EQUITY | ||||||||
| Reserves | 17,145 | 13,985 | ||||||
| Noncontrolling interest | 889 | 416 | ||||||
| Total equity | 18,034 | 14,401 | ||||||
ANTELOPE ENTERPRISE HOLDINGS LIMITED AND SUBSIDIARIES
CONSOLIDATED STATEMENTS OF COMPREHENSIVE INCOME (LOSS)
(UNAUDITED)
| SIX MONTHS ENDED JUNE 30, | ||||||||
| 2024 | 2023 | |||||||
| USD’000 | USD’000 | |||||||
| Net sales | 43,462 | 44,636 | ||||||
| Cost of goods sold | 39,969 | 37,824 | ||||||
| Gross profit | 3,493 | 6,812 | ||||||
| Other income | 651 | 409 | ||||||
| Selling and distribution expenses | (3,130 | ) | (7,100 | ) | ||||
| Administrative expenses | (6,863 | ) | (5,588 | ) | ||||
| Finance costs | (537 | ) | – | |||||
| Other expenses | (139 | ) | – | |||||
| Loss before taxation | (6,525 | ) | (5,467 | ) | ||||
| Income tax expense | 2 | – | ||||||
| Net loss for the period from continuing operations | (6,527 | ) | (5,467 | ) | ||||
| Discontinued operations | ||||||||
| Gain on disposal of discontinued operations | – | 10,659 | ||||||
| Loss from discontinued operations | – | (200 | ) | |||||
| Net income (loss) | (6,527 | ) | 4,992 | |||||
| Net income (loss) attributable to : | ||||||||
| Equity holders of the Company | (6,635 | ) | 4,997 | |||||
| Non-controlling interest | 108 | (5 | ) | |||||
| Net income (loss) | (6,527 | ) | 4,992 | |||||
| Net loss attributable to the equity holders of the Company arising from: | ||||||||
| Continuing operations | (6,635 | ) | (5,462 | ) | ||||
| Discontinued operations | – | 10,459 | ||||||
| Other comprehensive loss | ||||||||
| Exchange differences on translation of financial statements of foreign operations | (913 | ) | (598 | ) | ||||
| Total comprehensive income (loss) | (7,440 | ) | 4,394 | |||||
| Total comprehensive income (loss) attributable to: | ||||||||
| Equity holders of the Company | (7,548 | ) | 4,399 | |||||
| Non-controlling interest | 108 | (5 | ) | |||||
| Total comprehensive income (loss) | (7,440 | ) | 4,394 | |||||
| Total comprehensive income (loss) arising from: | ||||||||
| Continuing operations | (7,440 | ) | (6,065 | ) | ||||
| Discontinued operations | – | 10,459 | ||||||
| Income (loss) per share attributable to the equity holders of the Company | ||||||||
| Basic (USD) | ||||||||
| — from continuing operations | (0.96 | ) | (3.38 | ) | ||||
| — from discontinued operations | – | 6.48 | ||||||
| Diluted (USD) | ||||||||
| — from continuing operations | (0.96 | ) | (3.38 | ) | ||||
| — from discontinued operations | – | 5.27 | ||||||
ANTELOPE ENTERPRISE HOLDINGS LIMITED AND SUBSIDIARIES
CONSOLIDATED STATEMENTS OF CASH FLOWS
(UNAUDITED)
| Six Months Ended June 30, | ||||||||
| 2024 | 2023 | |||||||
| USD’000 | USD’000 | |||||||
| CASH FLOWS FROM OPERATING ACTIVITIES: | ||||||||
| Income (loss) before taxation | (6,524 | ) | 5,192 | |||||
| Adjustments for | ||||||||
| Operating lease charge | 33 | – | ||||||
| Depreciation of property, plant and equipment | 40 | 26 | ||||||
| Gain on disposal of subsidiaries | – | (10,659 | ) | |||||
| Loan forgiveness by related party | – | (167 | ) | |||||
| Loss on convertible note | 6 | 5 | ||||||
| Standstill fee on note payable | 125 | – | ||||||
| Share based compensation | 5,442 | 4,115 | ||||||
| Interest expense on lease liability | 13 | – | ||||||
| Amortization of OID of convertible note | 28 | 22 | ||||||
| Operating cash flows before working capital changes | (838 | ) | (1,466 | ) | ||||
| Increase in trade receivables | (1,508 | ) | – | |||||
| Increase in other receivables and prepayments | (2,189 | ) | (1,325 | ) | ||||
| Increase in loan receivable | (5,587 | ) | (4,688 | ) | ||||
| Increase (Decrease) in trade payables | 639 | (70 | ) | |||||
| Increase in unearned revenue | 982 | 56 | ||||||
| Increase (Decrease) in taxes payable | 480 | (106 | ) | |||||
| Increase in accrued liabilities and other payables | 861 | 8 | ||||||
| Cash used in operations | (7,160 | ) | (7,591 | ) | ||||
| Interest paid | – | – | ||||||
| Income tax paid | – | (14 | ) | |||||
| Net cash generated from operating activities from discontinued operations | – | 2,038 | ||||||
| Net cash used in operating activities | (7,160 | ) | (5,567 | ) | ||||
| CASH FLOWS FROM INVESTING ACTIVITIES: | ||||||||
| Acquisition of fixed assets | (1,825 | ) | (72 | ) | ||||
| Decrease in notes receivable | 1,460 | – | ||||||
| Decrease in available-for-sale financial asset | 99 | 126 | ||||||
| Decrease in restricted cash | – | 299 | ||||||
| Cash disposed as a result of disposal of subsidiaries | – | (37 | ) | |||||
| Net cash used in investing activities from discontinued operations | – | – | ||||||
| Net cash generated from (used in) investing activities | (266 | ) | 316 | |||||
| CASH FLOWS FROM FINANCING ACTIVITIES: | ||||||||
| Payment for lease liabilities | (13 | ) | – | |||||
| Insurance of share capital for equity financing | 4,297 | 7,661 | ||||||
| Warrants exercised | 1,228 | – | ||||||
| Proceeds from promissory note | 4,630 | – | ||||||
| Repayment of promissory note | (550 | ) | – | |||||
| Advance from related parties | 533 | 55 | ||||||
| Net cash used in financing activities from discontinued operations | – | (2,064 | ) | |||||
| Net cash generated from financing activities | 10,125 | 5,652 | ||||||
| NET INCREASE IN CASH & EQUIVALENTS | 2,699 | 401 | ||||||
| CASH & EQUIVALENTS, BEGINNING OF PERIOD | 536 | 612 | ||||||
| EFFECT OF FOREIGN EXCHANGE RATE DIFFERENCES | (913 | ) | (560 | ) | ||||
| CASH & EQUIVALENTS, END OF PERIOD | 2,322 | 453 | ||||||
The accompanying notes in the Company’s Form 6-K as filed with the SEC are an integral part of these
consolidated financial statements.
Source: Antelope Enterprise Holdings Ltd.
| Contact Information: | |
| Antelope Enterprise Holdings Limited | Precept Investor Relations LLC |
| Edmund Hen, Chief Financial Officer | David Rudnick, Account Manager |
| Email: info@aehltd.com | Email: david.rudnick@preceptir.com |
| Phone: +1 646-694-8538 |

© 2024 Benzinga.com. Benzinga does not provide investment advice. All rights reserved.
What the Options Market Tells Us About DoorDash
Financial giants have made a conspicuous bearish move on DoorDash. Our analysis of options history for DoorDash DASH revealed 9 unusual trades.
Delving into the details, we found 22% of traders were bullish, while 66% showed bearish tendencies. Out of all the trades we spotted, 2 were puts, with a value of $74,850, and 7 were calls, valued at $241,460.
Expected Price Movements
Taking into account the Volume and Open Interest on these contracts, it appears that whales have been targeting a price range from $135.0 to $160.0 for DoorDash over the last 3 months.
Analyzing Volume & Open Interest
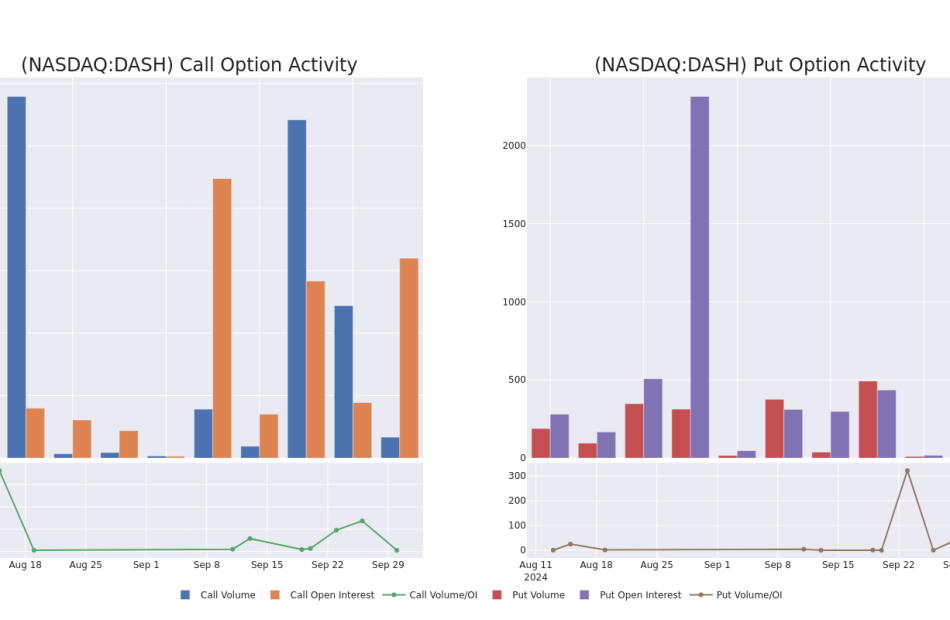
Examining the volume and open interest provides crucial insights into stock research. This information is key in gauging liquidity and interest levels for DoorDash’s options at certain strike prices. Below, we present a snapshot of the trends in volume and open interest for calls and puts across DoorDash’s significant trades, within a strike price range of $135.0 to $160.0, over the past month.
DoorDash 30-Day Option Volume & Interest Snapshot
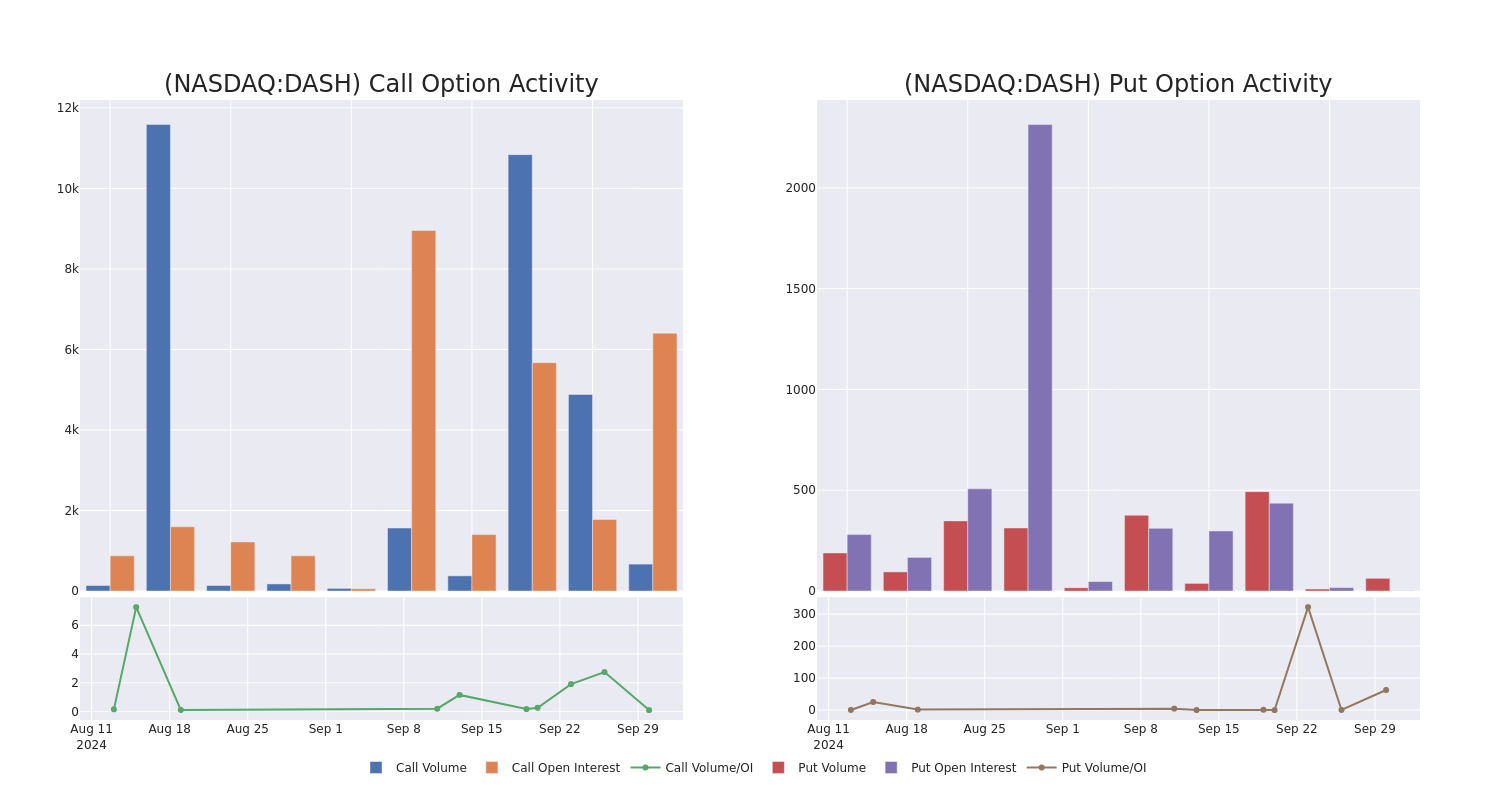
Largest Options Trades Observed:
| Symbol | PUT/CALL | Trade Type | Sentiment | Exp. Date | Ask | Bid | Price | Strike Price | Total Trade Price | Open Interest | Volume |
|---|---|---|---|---|---|---|---|---|---|---|---|
| DASH | CALL | SWEEP | BEARISH | 01/17/25 | $14.0 | $13.5 | $13.5 | $140.00 | $48.6K | 4.7K | 141 |
| DASH | PUT | SWEEP | BULLISH | 10/18/24 | $17.8 | $17.5 | $17.5 | $160.00 | $42.0K | 1 | 24 |
| DASH | CALL | SWEEP | BEARISH | 01/17/25 | $14.25 | $14.0 | $14.0 | $140.00 | $40.6K | 4.7K | 70 |
| DASH | CALL | SWEEP | BEARISH | 01/17/25 | $16.25 | $16.1 | $16.1 | $135.00 | $33.8K | 1.3K | 23 |
| DASH | PUT | SWEEP | BEARISH | 10/18/24 | $18.25 | $17.95 | $18.25 | $160.00 | $32.8K | 1 | 39 |
About DoorDash
Founded in 2013 and headquartered in San Francisco, DoorDash is an online food order demand aggregator. Consumers can use its app to order food on-demand for pickup or delivery from merchants mainly in the US. Through the acquisition of Wolt in 2022, the firm also provides this service in Europe. DoorDash provides a marketplace for the merchants to create a presence online, market their offerings, and meet demand by making the offerings available for pickup or delivery. The firm provides similar service to businesses in addition to restaurants, such as grocery, retail, pet supplies, and flowers.
In light of the recent options history for DoorDash, it’s now appropriate to focus on the company itself. We aim to explore its current performance.
DoorDash’s Current Market Status
- Trading volume stands at 933,237, with DASH’s price down by -0.33%, positioned at $141.76.
- RSI indicators show the stock to be may be overbought.
- Earnings announcement expected in 30 days.
What The Experts Say On DoorDash
5 market experts have recently issued ratings for this stock, with a consensus target price of $162.4.
Unusual Options Activity Detected: Smart Money on the Move
Benzinga Edge’s Unusual Options board spots potential market movers before they happen. See what positions big money is taking on your favorite stocks. Click here for access.
* An analyst from Keybanc has elevated its stance to Overweight, setting a new price target at $177.
* An analyst from JMP Securities has decided to maintain their Market Outperform rating on DoorDash, which currently sits at a price target of $160.
* Reflecting concerns, an analyst from Raymond James lowers its rating to Outperform with a new price target of $155.
* An analyst from Cantor Fitzgerald downgraded its action to Overweight with a price target of $160.
* An analyst from Oppenheimer has decided to maintain their Outperform rating on DoorDash, which currently sits at a price target of $160.
Options are a riskier asset compared to just trading the stock, but they have higher profit potential. Serious options traders manage this risk by educating themselves daily, scaling in and out of trades, following more than one indicator, and following the markets closely.
If you want to stay updated on the latest options trades for DoorDash, Benzinga Pro gives you real-time options trades alerts.
Market News and Data brought to you by Benzinga APIs
© 2024 Benzinga.com. Benzinga does not provide investment advice. All rights reserved.
ROSEN, TRUSTED INVESTOR COUNSEL, Encourages WEBTOON Entertainment Inc. Investors to Secure Counsel Before Important Deadline in Securities Class Action – WBTN
NEW YORK, Sept. 30, 2024 (GLOBE NEWSWIRE) —
WHY: Rosen Law Firm, a global investor rights law firm, reminds purchasers of common stock of WEBTOON Entertainment Inc. WBTN pursuant and/or traceable to the Company’s initial public offering conducted in June 2024 (the “IPO”), of the important November 4, 2024 lead plaintiff deadline.
SO WHAT: If you purchased WEBTOON common stock you may be entitled to compensation without payment of any out of pocket fees or costs through a contingency fee arrangement.
WHAT TO DO NEXT: To join the WEBTOON class action, go to https://rosenlegal.com/submit-form/?case_id=28596 or call Phillip Kim, Esq. toll-free at 866-767-3653 or email case@rosenlegal.com for information on the class action. A class action lawsuit has already been filed. If you wish to serve as lead plaintiff, you must move the Court no later than November 4, 2024. A lead plaintiff is a representative party acting on behalf of other class members in directing the litigation.
WHY ROSEN LAW: We encourage investors to select qualified counsel with a track record of success in leadership roles. Often, firms issuing notices do not have comparable experience, resources or any meaningful peer recognition. Many of these firms do not actually litigate securities class actions, but are merely middlemen that refer clients or partner with law firms that actually litigate the cases. Be wise in selecting counsel. The Rosen Law Firm represents investors throughout the globe, concentrating its practice in securities class actions and shareholder derivative litigation. Rosen Law Firm has achieved the largest ever securities class action settlement against a Chinese Company. Rosen Law Firm was Ranked No. 1 by ISS Securities Class Action Services for number of securities class action settlements in 2017. The firm has been ranked in the top 4 each year since 2013 and has recovered hundreds of millions of dollars for investors. In 2019 alone the firm secured over $438 million for investors. In 2020, founding partner Laurence Rosen was named by law360 as a Titan of Plaintiffs’ Bar. Many of the firm’s attorneys have been recognized by Lawdragon and Super Lawyers.
DETAILS OF THE CASE: According to the lawsuit, the Registration Statement made materially false and/or misleading statements and/or failed to disclose WEBTOON’s business, operations, and prospects. Specifically, defendants failed to disclose to investors that: (1) WEBTOON experienced a deceleration in advertising revenue growth; (2) WEBTOON experienced a deceleration in intellectual property (“IP”) adaptations revenue; (3) WEBTOON experienced exposure to weaker foreign currencies which offset revenue growth; (4) as a result of the foregoing, defendants’ positive statements about WEBTOON’s business, operations, and prospects were materially misleading and/or lacked a reasonable basis. When the true details entered the market, the lawsuit claims that investors suffered damages.
To join the WEBTOON class action, go to https://rosenlegal.com/submit-form/?case_id=28596 or call Phillip Kim, Esq. toll-free at 866-767-3653 or email case@rosenlegal.com for information on the class action.
No Class Has Been Certified. Until a class is certified, you are not represented by counsel unless you retain one. You may select counsel of your choice. You may also remain an absent class member and do nothing at this point. An investor’s ability to share in any potential future recovery is not dependent upon serving as lead plaintiff.
Follow us for updates on LinkedIn: https://www.linkedin.com/company/the-rosen-law-firm, on Twitter: https://twitter.com/rosen_firm or on Facebook: https://www.facebook.com/rosenlawfirm/.
Attorney Advertising. Prior results do not guarantee a similar outcome.
——————————-
Contact Information:
Laurence Rosen, Esq.
Phillip Kim, Esq.
The Rosen Law Firm, P.A.
275 Madison Avenue, 40th Floor
New York, NY 10016
Tel: (212) 686-1060
Toll Free: (866) 767-3653
Fax: (212) 202-3827
case@rosenlegal.com
www.rosenlegal.com

Market News and Data brought to you by Benzinga APIs
© 2024 Benzinga.com. Benzinga does not provide investment advice. All rights reserved.


