Billionaire Investor Who Predicted 2000, 2008 Crashes Says Market Euphoria Will Top Soon, Warns Of 'Black Swan Event'
Mark Spitznagel, co-founder of Universa Investments, believes the stock market is in a “Goldilocks phase” following the Federal Reserve’s rate cuts and China’s stimulus measures. After a crash last month, the market surged to new highs, but Spitznagel warns this euphoria won’t last in an interview with Bloomberg.
He predicts a looming recession and believes the current rally is only temporary.
Spitznagel, known for his focus on “tail-risk” hedging, which protects against extreme, unexpected market events, says the biggest market bubble in history is about to burst. He foresees stagflation in the future, where the Fed will have to act, but it won’t be enough to save the economy.
Spitznagel has had success hedging through large downturns in the market, utilizing out-of-the-money put options as a way to “buy insurance” against market routs. Buying puts on the overall market through the SPDR S&P 500 ETF Trust SPY or similar broad-exposure ETFs could be a way to protect against market volatility.
Spitznagel said that while the market might continue to soar in the short term, it will soon exit the Goldilocks zone, potentially by the end of the year. With the recent “uninversion” of the yield curve, Spitznagel feels the market is now in “black swan territory.”
What Is A Black Swan Event: A black swan event is an unpredictable event that leads to market volatility. The COVID-19 market crash is a recent example of a black swan event.
He also criticized traditional investment strategies like diversification, calling them a “big lie.” He argues that modern portfolio theory has distracted investors, often making them poorer in the long run. Instead, he urges investors to focus on how their portfolios will perform in both good and bad markets.
According to Spitznagel, the key is to protect against one’s own tendencies, not just market movements. Rather than fixating on what the market will do next, investors should think about how they’ll react in boom and bust scenarios to avoid emotional mistakes like selling at the low and buying at the high.
Photo: Shutterstock
Market News and Data brought to you by Benzinga APIs
© 2024 Benzinga.com. Benzinga does not provide investment advice. All rights reserved.
"I Can See It Becoming A $100 Billion REIT" – What Will It Take For This High-Yield Company To Hit New Heights?
Benzinga and Yahoo Finance LLC may earn commission or revenue on some items through the links below.
Some real estate investment trusts (REITs) are a perfect portfolio fit for investors looking to see steady income with limited risk. One of the most popular is Realty Income (NYSE:O). Known as the monthly income dividend company, Realty Income has a current yield of 5.06% and a payout of $3.16 per year.
Where it wins is consistency. The company has declared 651 consecutive monthly dividends and is a Dividend King and a member of the S&P 500 Dividend Aristocrats® index, having increased its dividend for 30 years in a row. Since going public, it has paid around $14 billion in dividends to shareholders. Nareit reported that the compound average annual total return was 13.5%, a solid performance for a REIT.
Check It Out:
For years, triple net leases, mostly in retail with clients like Dollar General and Walgreens, have been its bread and butter. Over the last few years, Realty Income has been evolving its strategy, which may be more than just old reliable. At the helm is CEO Sumit Roy, who sees new opportunities and areas of exploration that could grow the company and add some risk.
The Evolution Of A New Strategy
Speaking to Nareit, Simon Yarmak, managing director of investment bank Stifel, said the company has had a significant turnaround over the past decade. “They’ve grown sevenfold from an $8 billion equity market cap to a $55 billion equity market cap,” he said, remarking on their transformation from far more than just triple net leases. In the past several months, Stifel has raised its price target on Realty Income twice, most recently from $67.50 to $70.25, putting it at the top end of analyst targets.
“About 10 years ago, we started to move into single-tenant industrial properties, which was a natural supplement to our retail business,” Roy told Nareit. Now, around 15% of its portfolio is in industrial centers.
The company has also gone international, sticking close to its retail roots by starting with 12 properties in the United Kingdom leased to Sainsbury’s grocery business. Roy said the company has gone from zero to $11 billion in five years. Earlier this year, it announced a 527-million-euro sale-leaseback transaction for 82 retail properties leased to sports retailer Decathlon, exposing it to Germany, France and Portugal.
Realty Income’s new heft in the marketplace has led it to a substantial path of portfolio diversification. Its $1.7 billion sale-leaseback with Wynn Resorts Limited for Encore Boston Harbor in 2022 was a big signal to the market that something was changing about the company. More capital has led to the ability to make bigger deals, such as its $950 million investment with Blackstone Real Estate Income Trust, Inc. in 2023 to acquire The Bellagio Las Vegas. Gaming is now around 3.3% of its portfolio.
Another partnership in 2023 with Digital Realty (NYSE:DLR) took the company into the world of data centers. Data centers are one of the hottest areas of real estate due to the growing demand for capacity fueled by AI. For investors, there are only a handful of data center REITs, so getting added exposure may be a bonus. While this area is subject to far more volatility than Realty Income’s traditional retail business, the upside could make up for the risk.
“Generally, when companies diversify their story, people question whether it’s the right thing to do, but each time Realty Income has gone into other businesses, they’re not dipping their toes in, they’re acquiring big quality assets,” Yarmak remarked.
See More:
The Path To $100 Billion
Sumit Roy sees Realty Income’s opportunity as nearly infinite. “I don’t see an end to what a company like ours can become in size,” he said, noting that adding European assets took the company’s addressable market from $4 billion to $13 trillion.
Yarmak believes the company will build on its legacy categories while expanding into other areas. “Realty Income is now a $70 billion company and over the next few years I can see it becoming a $100 billion REIT.”
James Shanahan, senior equity research analyst for Edward Jones, suggests investors consider Realty Income’s role within a portfolio. Its massive size means that while it is still expanding, it may not be a high-growth story. He recommends investors examine the company and pair it with other companies that have a high-growth strategy.
For long-term investors, it’s always a good idea to monitor a company’s changing strategy regarding its investments. So far, Realty Income has made strong strategic moves, benefiting from key growth areas. Its diversification could serve it well if there are any concerns with one aspect of the business. Its top tenants are still less than 5% of the business, meaning that Realty Income should be protected no matter what storms come.
Better Yields Than Some REITs?
The current interest rate environment has created an incredible opportunity for income-seeking investors to earn massive yields, but not through publicly-traded REITs.
Arrived Homes, the Jeff Bezos-backed investment platform, has launched its Private Credit Fund, which provides access to a pool of short-term loans backed by residential real estate with a target 7% to 9% net annual yield paid to investors monthly. It paid 8.1% in July. The best part? Unlike other private credit funds, this one has a minimum investment of only $100.
Looking for fractional real estate investment opportunities? The Benzinga Real Estate Screener features the latest offerings.
Wondering if your investments can get you to a $5,000,000 nest egg? Speak to a financial advisor today. SmartAsset’s free tool matches you up with up to three vetted financial advisors who serve your area, and you can interview your advisor matches at no cost to decide which one is right for you.
This article “I Can See It Becoming A $100 Billion REIT” – What Will It Take For This High-Yield Company To Hit New Heights? originally appeared on Benzinga.com
Ingersoll Rand Continues to Expand its Portfolio with Three Bolt-On Acquisitions
- Acquisitions complement Ingersoll Rand’s product and technology offerings and increase geographic reach, while adding new pump technology and capabilities
- Execution of bolt-on acquisition strategy continues to enhance company’s durable financial profile by serving high-growth, sustainable end markets
- Demonstrates company’s commitment to capital allocation and expected achievement of mid-teens return on invested capital (ROIC) by third full year of ownership
DAVIDSON, N.C., Oct. 01, 2024 (GLOBE NEWSWIRE) — Ingersoll Rand Inc. IR, a global provider of mission-critical flow creation and life science and industrial solutions, has acquired Air Power Systems Co., LLC (“APSCO”), Blutek s.r.l. (“Blutek”), and UT Pumps & Systems Private Limited (“UT Pumps”) for a combined purchase price of approximately $135 million. These acquisitions add more than $50 million in revenue cumulatively acquired at a high-single digit multiple of 2024 estimated Adjusted EBITDA.
APSCO, based in the United States, is a leading provider of hydraulic and pneumatic products and engineered solutions serving diverse specialty work truck vehicles. For 60 years, APSCO has served its customers with comprehensive offerings across hydraulic coolers, systems, and components in addition to pneumatic consoles, cylinders, valves, and switches. The acquisition will expand Ingersoll Rand’s leading position in the dry and liquid bulk markets with energy efficient, innovative solutions. APSCO will join the Industrial Technologies and Services (IT&S) segment.
Blutek, based in Italy, specializes in the design and production of highly engineered solutions for compressed air and nitrogen generation in mission-critical environments. As a certified supplier to leading Engineering, Procurement, and Construction (EPC) companies, Blutek will increase Ingersoll Rand’s ability to compete in high specification projects, adding technology capabilities, expertise, and aftermarket potential in high-growth end markets including biogas and carbon capture. The business will join the IT&S segment.
UT Pumps is a leading Indian manufacturer of screw pumps and triplex plunger pumps. This acquisition adds new pump technology to Ingersoll Rand’s portfolio. Its high-pressure pumps are mainly focused on attractive end markets including water, wastewater, food and beverage, pharmaceuticals, general industrial, and chemicals. UT Pumps will join the Precision and Science Technologies (P&ST) segment.
“Investments in sustainability, innovation, and aftermarket are core to our growth and today’s announcement underscores our commitment to deploy capital in pursuit of this strategy,” said Vicente Reynal, chairman and chief executive officer of Ingersoll Rand. “These acquisitions demonstrate our successful bolt-on acquisition playbook, which when combined with the power of Ingersoll Rand Execution Excellence (IRX), will continue to deliver value to both customers and shareholders.”
Thus far, Ingersoll Rand has closed 14 acquisitions this year as part of its disciplined capital allocation strategy.
About Ingersoll Rand Inc.
Ingersoll Rand Inc. IR, driven by an entrepreneurial spirit and ownership mindset, is dedicated to Making Life Better for our employees, customers, shareholders, and planet. Customers lean on us for exceptional performance and durability in mission-critical flow creation and industrial solutions. Supported by over 80+ respected brands, our products and services excel in the most complex and harsh conditions. Our employees develop customers for life through their daily commitment to expertise, productivity, and efficiency. For more information, visit www.IRCO.com.
Forward-Looking Statements
This news release contains “forward-looking statements” within the meaning of the Private Securities Litigation Reform Act of 1995, including statements related to Ingersoll Rand Inc.’s (the “Company” or “Ingersoll Rand”) expectations regarding the performance of its business, its financial results, its liquidity and capital resources and other non-historical statements. These forward-looking statements generally are identified by the words “believe,” “project,” “expect,” “anticipate,” “estimate,” “forecast,” “outlook,” “target,” “endeavor,” “seek,” “predict,” “intend,” “strategy,” “plan,” “may,” “could,” “should,” “will,” “would,” “will be,” “on track to” “will continue,” “will likely result,” “guidance” or the negative thereof or variations thereon or similar terminology generally intended to identify forward-looking statements. All statements other than historical facts are forward-looking statements.
These forward-looking statements are based on Ingersoll Rand’s current expectations and are subject to risks and uncertainties, which may cause actual results to differ materially from these current expectations. Should one or more of these risks or uncertainties materialize, or should underlying assumptions prove incorrect, actual results may vary materially from those indicated or anticipated by such forward-looking statements. The inclusion of such statements should not be regarded as a representation that such plans, estimates or expectations will be achieved. Important factors that could cause actual results to differ materially from such plans, estimates or expectations include, among others, (1) adverse impact on our operations and financial performance due to natural disaster, catastrophe, global pandemics (including COVID-19), geopolitical tensions, cyber events or other events outside of our control; (2) unexpected costs, charges or expenses resulting from completed and proposed business combinations; (3) uncertainty of the expected financial performance of the Company; (4) failure to realize the anticipated benefits of completed and proposed business combinations; (5) the ability of the Company to implement its business strategy; (6) difficulties and delays in achieving revenue and cost synergies; (7) inability of the Company to retain and hire key personnel; (8) evolving legal, regulatory and tax regimes; (9) changes in general economic and/or industry specific conditions; (10) actions by third parties, including government agencies; and (11) other risk factors detailed in Ingersoll Rand’s most recent Annual Report on Form 10-K filed with the Securities and Exchange Commission (the “SEC”), as such factors may be updated from time to time in its periodic filings with the SEC, which are available on the SEC’s website at http://www.sec.gov. The foregoing list of important factors is not exclusive.
Any forward-looking statements speak only as of the date of this release. Ingersoll Rand undertakes no obligation to update any forward-looking statements, whether as a result of new information or development, future events or otherwise, except as required by law. Readers are cautioned not to place undue reliance on any of these forward-looking statements.

© 2024 Benzinga.com. Benzinga does not provide investment advice. All rights reserved.
Marlowe Brookwood Offers Upscale Living in a Suburban Garden-Style Community
AUSTELL, Ga., Oct. 1, 2024 /PRNewswire/ — Greystar, a global leader in the investment, development, and management of real estate, including rental housing, logistics and life sciences, today announced that Marlowe Brookwood, the latest Marlowe-branded apartment community, is now pre-leasing and will welcome its first move-ins this fall.
Marlowe by Greystar provides suburban luxury living with quality brand new finishes, spacious amenities and modern design with easy access to urban conveniences.
“We are pleased to bring our Marlowe brand to west Cobb County,” Craig Gearhart, Sr. Director of Development at Greystar, said. “Marlowe Brookwood has remarkable amenities and high-level finishes in a suburban setting. It is our second community in the area, with Elan Brookwood located right next door.”
Marlowe Brookwood has 340 residences that come in one-, two- and three-bedroom floorplans ranging from 770 sq. ft. to 1,503 sq. ft. Two of the community’s five buildings are four-stories with an elevator. The other three are garden style.
Residences will have upscale finishes that include gourmet kitchens with an island or peninsula, stainless steel appliances, quartz countertops, wood plank-style flooring, plush carpeted bedrooms, ensuite wardrobe closets, tile backsplashes and showers, designer lighting and in-home washer and dryers. Some homes will have private balconies or terraces.
Community amenities include property-wide Wi-Fi for seamless connectivity, co-working spaces and conference rooms, a 24-hour wellness studio with cardio and free weights, bike storage room, gated dog park and dog spa, gaming lawn with ping pong and cornhole, a pool with ledge and chaise loungers. Residents can mingle in the fireside lounge, the clubroom with bar and great room or the elevated wine room and gathering lounge.
For more information, or to schedule a tour, please visit MarloweBrookwood.com or call 470-531-7314.
About Greystar
Greystar is a leading, fully integrated global real estate company offering expertise in property management, investment management, development, and construction services in institutional-quality rental housing, logistics, and life sciences sectors. Headquartered in Charleston, South Carolina, Greystar manages and operates approximately $320 billion of real estate in 249 markets globally with offices throughout North America, Europe, South America, and the Asia-Pacific region. Greystar is the largest operator of apartments in the United States, manages more than 966,700 units/beds globally, and has a robust institutional investment management platform comprised of $78 billion of assets under management, including over $36 billion of development assets. Greystar was founded by Bob Faith in 1993 to become a provider of world-class service in the rental residential real estate business. To learn more, visit Greystar’s website.
![]() View original content to download multimedia:https://www.prnewswire.com/news-releases/marlowe-brookwood-offers-upscale-living-in-a-suburban-garden-style-community-302263756.html
View original content to download multimedia:https://www.prnewswire.com/news-releases/marlowe-brookwood-offers-upscale-living-in-a-suburban-garden-style-community-302263756.html
SOURCE Greystar
Market News and Data brought to you by Benzinga APIs
© 2024 Benzinga.com. Benzinga does not provide investment advice. All rights reserved.
Options Exercise Activity Initiated By Julie D Masino At Cracker Barrel Old
A substantial insider activity was disclosed on September 30, as Masino, CEO at Cracker Barrel Old CBRL, reported the exercise of a large sell of company stock options.
What Happened: The latest Form 4 filing on Monday with the U.S. Securities and Exchange Commission uncovered Masino, CEO at Cracker Barrel Old, exercising stock options for 0 shares of CBRL. The total transaction was valued at $0.
Cracker Barrel Old shares are currently trading down by 0.68%, with a current price of $45.04 as of Tuesday morning. This brings the total value of Masino’s 0 shares to $0.
Delving into Cracker Barrel Old’s Background
Cracker Barrel Old Country Store Inc operates hundreds of full-service restaurants throughout the United States. Its restaurants are open for breakfast, lunch, and dinner, with menus that offer home-style country food. Cracker Barrel’s biggest input costs are beef, dairy, fruits and vegetables, pork, and poultry. The company purchases its food products from a few different vendors on a cost-plus basis. All restaurants are located in freestanding buildings and include gift shops, which contribute roughly one fourth of total company revenue. Apparel and accessories are the company’s biggest revenue generators in the retail segment of the business.
A Deep Dive into Cracker Barrel Old’s Financials
Revenue Growth: Cracker Barrel Old’s remarkable performance in 3 months is evident. As of 31 July, 2024, the company achieved an impressive revenue growth rate of 6.89%. This signifies a substantial increase in the company’s top-line earnings. In comparison to its industry peers, the company trails behind with a growth rate lower than the average among peers in the Consumer Discretionary sector.
Insights into Profitability:
-
Gross Margin: With a high gross margin of 32.1%, the company demonstrates effective cost control and strong profitability relative to its peers.
-
Earnings per Share (EPS): Cracker Barrel Old’s EPS is notably higher than the industry average. The company achieved a positive bottom-line trend with a current EPS of 0.82.
Debt Management: Cracker Barrel Old’s debt-to-equity ratio is below industry norms, indicating a sound financial structure with a ratio of 2.73.
Navigating Market Valuation:
-
Price to Earnings (P/E) Ratio: The current P/E ratio of 24.78 is below industry norms, indicating potential undervaluation and presenting an investment opportunity.
-
Price to Sales (P/S) Ratio: With a P/S ratio of 0.29 below industry standards, the stock shows potential undervaluation, making it an appealing investment option for those focusing on sales performance.
-
EV/EBITDA Analysis (Enterprise Value to its Earnings Before Interest, Taxes, Depreciation & Amortization): With an EV/EBITDA ratio lower than industry benchmarks at 12.96, Cracker Barrel Old presents an attractive value opportunity.
Market Capitalization Analysis: The company’s market capitalization is below the industry average, suggesting that it is relatively smaller compared to peers. This could be due to various factors, including perceived growth potential or operational scale.
Now trade stocks online commission free with Charles Schwab, a trusted and complete investment firm.
Uncovering the Importance of Insider Activity
Insightful as they may be, insider transactions should be considered alongside a thorough examination of other investment criteria.
Within the legal framework, an “insider” is defined as any officer, director, or beneficial owner holding more than ten percent of a company’s equity securities as per Section 12 of the Securities Exchange Act of 1934. This includes executives in the c-suite and major hedge funds. These insiders are mandated to disclose their transactions through a Form 4 filing, to be submitted within two business days of the transaction.
The initiation of a new purchase by a company insider serves as a strong indication that they expect the stock to rise.
However, insider sells may not always signal a bearish view and can be influenced by various factors.
A Deep Dive into Insider Transaction Codes
When dissecting transactions, the focal point for investors is often those occurring in the open market, meticulously detailed in Table I of the Form 4 filing. A P in Box 3 denotes a purchase, while S signifies a sale. Transaction code C indicates the conversion of an option, and transaction code A denotes a grant, award, or other acquisition of securities from the company.
Check Out The Full List Of Cracker Barrel Old’s Insider Trades.
Insider Buying Alert: Profit from C-Suite Moves
Benzinga Edge reveals every insider trade in real-time. Don’t miss the next big stock move driven by insider confidence. Unlock this ultimate sentiment indicator now. Click here for access.
This article was generated by Benzinga’s automated content engine and reviewed by an editor.
Market News and Data brought to you by Benzinga APIs
© 2024 Benzinga.com. Benzinga does not provide investment advice. All rights reserved.
President Of Darden Restaurants Sold $334K In Stock
Martin Melvin John, President at Darden Restaurants DRI, reported an insider sell on September 30, according to a new SEC filing.
What Happened: John’s decision to sell 2,000 shares of Darden Restaurants was revealed in a Form 4 filing with the U.S. Securities and Exchange Commission on Monday. The total value of the sale is $334,452.
Monitoring the market, Darden Restaurants‘s shares up by 0.15% at $164.37 during Tuesday’s morning.
Unveiling the Story Behind Darden Restaurants
Darden Restaurants is the largest restaurant operator in the US full-service space, with consolidated revenue of $11.4 billion in fiscal 2024 resulting in 3%-4% full-service market share (per NRA data and our calculations). The company maintains a portfolio of 10 restaurant brands: Olive Garden, LongHorn Steakhouse, Cheddar’s Scratch Kitchen, Ruth’s Chris, Yard House, The Capital Grille, Seasons 52, Eddie V’s, Bahama Breeze, and The Capital Burger. Darden generates revenue almost exclusively from company-owned restaurants, though a small network of franchised restaurants and consumer-packaged goods sales through the traditional grocery channel contribute modestly. As of the end of its fiscal 2024, the company operated 2,031 restaurants in the US.
Breaking Down Darden Restaurants’s Financial Performance
Revenue Growth: Darden Restaurants’s remarkable performance in 3 months is evident. As of 31 August, 2024, the company achieved an impressive revenue growth rate of 0.97%. This signifies a substantial increase in the company’s top-line earnings. In comparison to its industry peers, the company trails behind with a growth rate lower than the average among peers in the Consumer Discretionary sector.
Profitability Metrics: Unlocking Value
-
Gross Margin: The company faces challenges with a low gross margin of 20.41%, suggesting potential difficulties in cost control and profitability compared to its peers.
-
Earnings per Share (EPS): Darden Restaurants’s EPS is significantly higher than the industry average. The company demonstrates a robust bottom-line performance with a current EPS of 1.75.
Debt Management: Darden Restaurants’s debt-to-equity ratio is below the industry average. With a ratio of 2.48, the company relies less on debt financing, maintaining a healthier balance between debt and equity, which can be viewed positively by investors.
Market Valuation:
-
Price to Earnings (P/E) Ratio: The current P/E ratio of 18.93 is below industry norms, indicating potential undervaluation and presenting an investment opportunity.
-
Price to Sales (P/S) Ratio: The current P/S ratio of 1.73 is below industry norms, suggesting potential undervaluation and presenting an investment opportunity for those considering sales performance.
-
EV/EBITDA Analysis (Enterprise Value to its Earnings Before Interest, Taxes, Depreciation & Amortization): Indicated by a lower-than-industry-average EV/EBITDA ratio of 13.53, the company suggests a potential undervaluation, which might be advantageous for value-focused investors.
Market Capitalization Analysis: The company’s market capitalization surpasses industry averages, showcasing a dominant size relative to peers and suggesting a strong market position.
Now trade stocks online commission free with Charles Schwab, a trusted and complete investment firm.
Exploring the Significance of Insider Trading
Insider transactions shouldn’t be used primarily to make an investing decision, however an insider transaction can be an important factor in the investing decision.
From a legal standpoint, the term “insider” pertains to any officer, director, or beneficial owner holding more than ten percent of a company’s equity securities as outlined in Section 12 of the Securities Exchange Act of 1934. This encompasses executives in the c-suite and significant hedge funds. These insiders are mandated to inform the public of their transactions through a Form 4 filing, to be submitted within two business days of the transaction.
A company insider’s new purchase is a indicator of their positive anticipation for a rise in the stock.
While insider sells may not necessarily reflect a bearish view and can be motivated by various factors.
Cracking Transaction Codes
For investors, a primary focus lies on transactions occurring in the open market, as indicated in Table I of the Form 4 filing. A P in Box 3 denotes a purchase, while S signifies a sale. Transaction code C signals the conversion of an option, and transaction code A denotes a grant, award, or other acquisition of securities from the company.
Check Out The Full List Of Darden Restaurants’s Insider Trades.
Insider Buying Alert: Profit from C-Suite Moves
Benzinga Edge reveals every insider trade in real-time. Don’t miss the next big stock move driven by insider confidence. Unlock this ultimate sentiment indicator now. Click here for access.
This article was generated by Benzinga’s automated content engine and reviewed by an editor.
Market News and Data brought to you by Benzinga APIs
© 2024 Benzinga.com. Benzinga does not provide investment advice. All rights reserved.
A Closer Look at Walmart's Options Market Dynamics
Deep-pocketed investors have adopted a bearish approach towards Walmart WMT, and it’s something market players shouldn’t ignore. Our tracking of public options records at Benzinga unveiled this significant move today. The identity of these investors remains unknown, but such a substantial move in WMT usually suggests something big is about to happen.
We gleaned this information from our observations today when Benzinga’s options scanner highlighted 29 extraordinary options activities for Walmart. This level of activity is out of the ordinary.
The general mood among these heavyweight investors is divided, with 24% leaning bullish and 65% bearish. Among these notable options, 18 are puts, totaling $747,290, and 11 are calls, amounting to $1,199,345.
Expected Price Movements
Taking into account the Volume and Open Interest on these contracts, it appears that whales have been targeting a price range from $66.67 to $110.0 for Walmart over the last 3 months.
Volume & Open Interest Trends
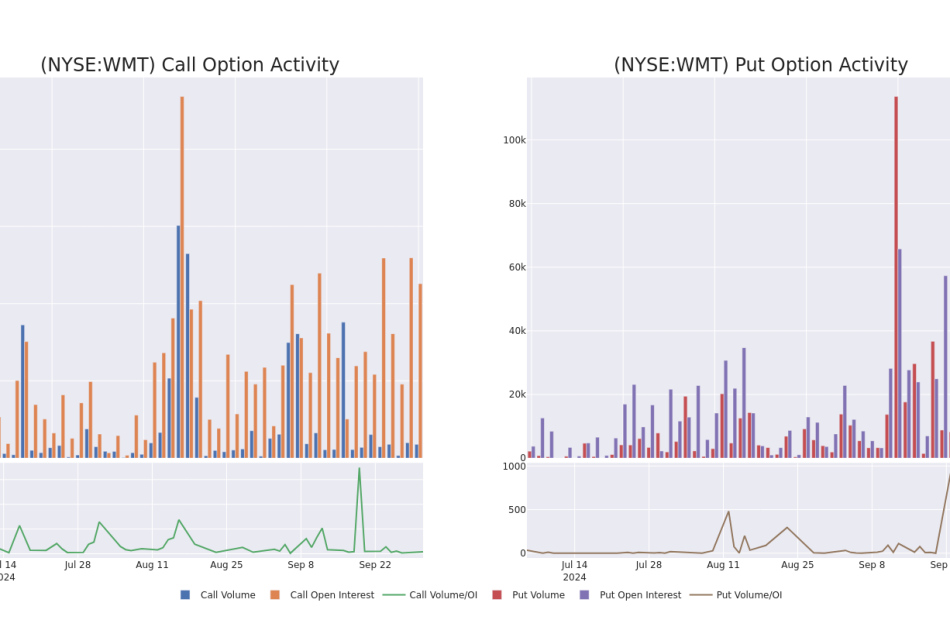
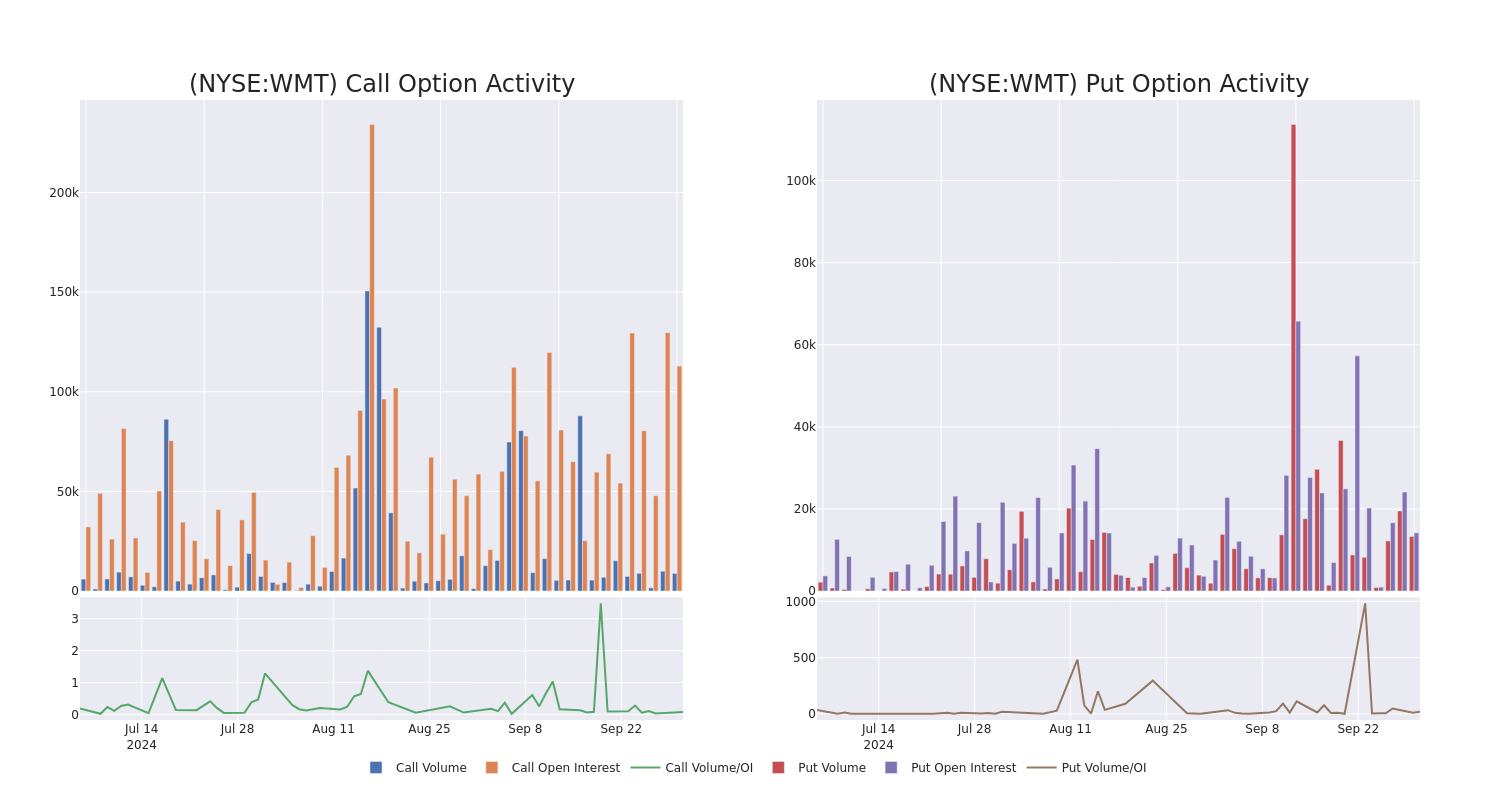
In today’s trading context, the average open interest for options of Walmart stands at 7058.28, with a total volume reaching 22,142.00. The accompanying chart delineates the progression of both call and put option volume and open interest for high-value trades in Walmart, situated within the strike price corridor from $66.67 to $110.0, throughout the last 30 days.
Walmart Option Volume And Open Interest Over Last 30 Days
Biggest Options Spotted:
| Symbol | PUT/CALL | Trade Type | Sentiment | Exp. Date | Ask | Bid | Price | Strike Price | Total Trade Price | Open Interest | Volume |
|---|---|---|---|---|---|---|---|---|---|---|---|
| WMT | CALL | TRADE | BEARISH | 11/15/24 | $1.1 | $0.95 | $1.0 | $85.00 | $500.0K | 33.1K | 273 |
| WMT | CALL | TRADE | BEARISH | 03/21/25 | $3.8 | $3.65 | $3.7 | $85.00 | $166.5K | 5.0K | 450 |
| WMT | CALL | SWEEP | BULLISH | 11/15/24 | $1.82 | $1.81 | $1.82 | $82.50 | $122.4K | 5.9K | 41 |
| WMT | CALL | TRADE | NEUTRAL | 11/15/24 | $1.04 | $0.95 | $1.0 | $85.00 | $100.0K | 33.1K | 6.3K |
| WMT | CALL | SWEEP | BEARISH | 11/15/24 | $3.15 | $3.1 | $3.1 | $80.00 | $56.4K | 27.2K | 433 |
About Walmart
Walmart serves as the preeminent retailer in the United States, with its strategy predicated on superior operating efficiency and offering the lowest priced goods to consumers to drive robust store traffic and product turnover. Walmart augmented its low-price business strategy by offering a convenient one-stop shopping destination with the opening of its first supercenter in 1988.Today, Walmart operates over 4,600 stores in the United States (5,200 including Sam’s Club) and over 10,000 stores globally. Walmart generated over $440 billion in domestic namesake sales in fiscal 2024, with Sam’s Club contributing another $86 billion to the company’s top line. Internationally, Walmart generated $115 billion in sales. The retailer serves around 240 million customers globally each week.
Following our analysis of the options activities associated with Walmart, we pivot to a closer look at the company’s own performance.
Walmart’s Current Market Status
- With a trading volume of 4,903,195, the price of WMT is up by 0.17%, reaching $80.89.
- Current RSI values indicate that the stock is may be approaching overbought.
- Next earnings report is scheduled for 49 days from now.
What Analysts Are Saying About Walmart
Over the past month, 5 industry analysts have shared their insights on this stock, proposing an average target price of $92.2.
Turn $1000 into $1270 in just 20 days?
20-year pro options trader reveals his one-line chart technique that shows when to buy and sell. Copy his trades, which have had averaged a 27% profit every 20 days. Click here for access.
* An analyst from Jefferies has decided to maintain their Buy rating on Walmart, which currently sits at a price target of $90.
* Maintaining their stance, an analyst from Baird continues to hold a Outperform rating for Walmart, targeting a price of $90.
* An analyst from Citigroup persists with their Buy rating on Walmart, maintaining a target price of $98.
* An analyst from Wells Fargo persists with their Overweight rating on Walmart, maintaining a target price of $88.
* In a cautious move, an analyst from Melius Research downgraded its rating to Buy, setting a price target of $95.
Options are a riskier asset compared to just trading the stock, but they have higher profit potential. Serious options traders manage this risk by educating themselves daily, scaling in and out of trades, following more than one indicator, and following the markets closely.
If you want to stay updated on the latest options trades for Walmart, Benzinga Pro gives you real-time options trades alerts.
Market News and Data brought to you by Benzinga APIs
© 2024 Benzinga.com. Benzinga does not provide investment advice. All rights reserved.
The "Everything Market" Could Last A While Longer
By Lance Roberts
We are currently in the “everything market.” It doesn’t matter what you have probably invested in; it is currently increasing in value. However, it isn’t likely for the reasons you think. A recent Marketwatch interview with the always bullish Jim Paulson got his reasoning for the rally.
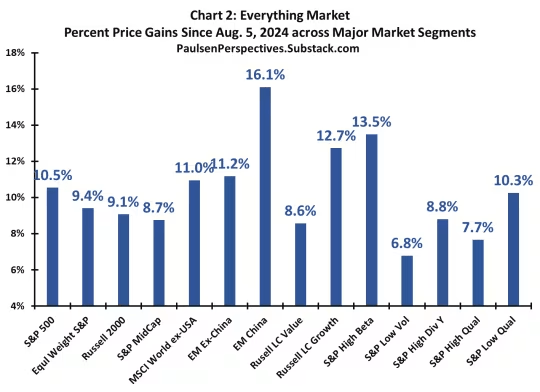
“It is this cocktail of ‘full support’ at the front end of a bull market which commonly has created an ‘Everything Market’ during the early part of a new bull. That is, for a period, almost everything simultaneously rises – value, growth, small, large, defensive, and cyclical stocks – and usually by a lot.
Short rates are falling, bond yields have declined, money growth is rising, fiscal stimulus has again expanded, and disinflation is still evident; and because of this new and overwhelming support, expectations for a soft landing should grow while both consumer and business confidence improves.” – Jim Paulson
But that isn’t the reason.
On the other side of the bull/bear argument are “gold bugs” enjoying soaring gold prices because “debts and deficits” are finally eroding the U.S. economy. As Michael Hartnet of BofA recently stated:
“Long-run returns in commodities are rising after the worst decade since the 1930s, led by gold, which is a hedge against the 3Ds: debt, deficit, debasement.”
The evidence doesn’t support that view. Historically, when deficits as a percentage of GDP increase, gold does very well as concerns about U.S. economic health increase (as per Michael Hartnett of BofA.) However, gold performs poorly as economic growth resumes and the deficit declines. Such is logical, except that since 2020, gold has soared in price even as economic health remains robust and the deficit as a percentage of GDP continues to decline.
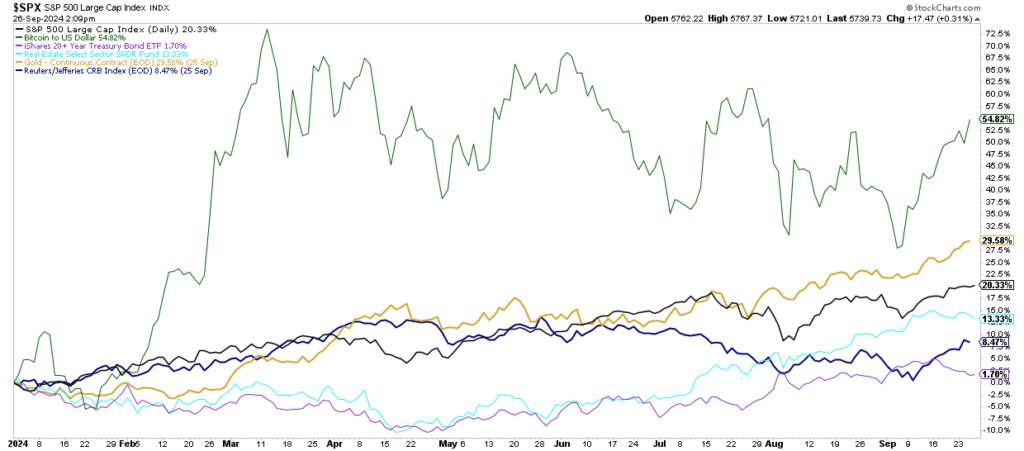
While stocks and gold have risen this year, bonds, commodities, real estate, and cryptocurrencies have also enjoyed gains.
In other words, whatever your “thesis” is for whatever asset you own, the price action currently supports that thesis. That does not mean your thesis is correct.
In an “everything rally,” rising asset prices cover investing mistakes.
Therefore, this analysis should elicit two important questions: 1) what drives the “everything rally,” and 2) when will it end?
Whatever Your Thesis Is – It’s Probably Wrong
When it comes to what is driving the “everything rally,” everyone has their thesis. The “stock jockeys” suggest that easier monetary accommodation by the Fed and improving earnings are the key drivers for equities. As noted above, the “gold bugs” are seduced by burgeoning government spending and expectations of a dollar decline to loft gold prices higher. Every asset class has its “reason” for going higher, but the real reason may be much simpler. This post will focus on stocks and gold as they garner the most headlines and have the most fervent of “true believers.”
In every market and asset class, the price is determined by supply and demand. If there are more buyers than sellers, then prices rise, and vice-versa. While economic, geopolitical, or financial data points may temporarily affect and shift the balance between those wanting to buy or sell, in the end, the price is solely determined by asset flows.
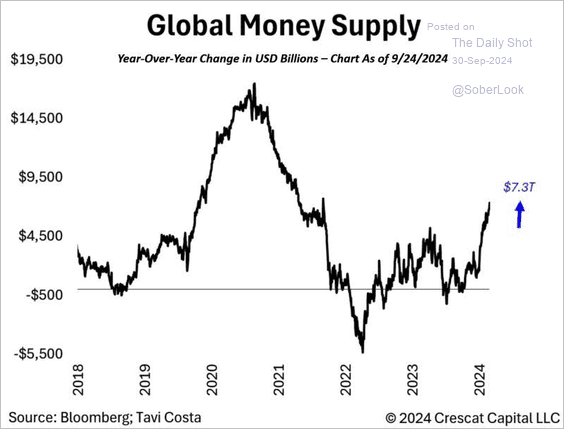
Notably, the amount of money flowing into assets has been remarkable since 2014. Despite many “concerns,” 2024 is on track to be the second-strongest year of monetary inflows since 2021. That statistic is amazing when considering the government was flooding the system with trillions in monetary and fiscal stimulus then versus contracting it currently.
Unsurprisingly, as asset prices increase during the “everything market,” more money is pulled into those assets, forcing prices to rise as demand outstrips supply. As we noted previously, for “every buyer, there is a seller…at a specific price.” That “demand” for stocks, gold, real estate, cryptocurrencies, etc., comes from many sources.
- Hedge funds
- Private equity funds
- Corporate share buyback programs
- Passive indexes
- Pension funds
- Institutional funds
- Mutual Funds
- Retirement plans
- Global investors
- Retail investors
Most important is the supply of capital from Central Banks.
Of course, a massive accumulation of cash in money market funds will face declining yields as the Federal Reserve cuts interest rates.
As noted, whatever your “thesis” for owning an asset probably isn’t the actual reason. There are three primary reasons why asset prices are rising in the “everything market.”
- Liquidity
- Liquidity
- Liquidity
In other words, in an “everything market,” there is too much money chasing too few assets.
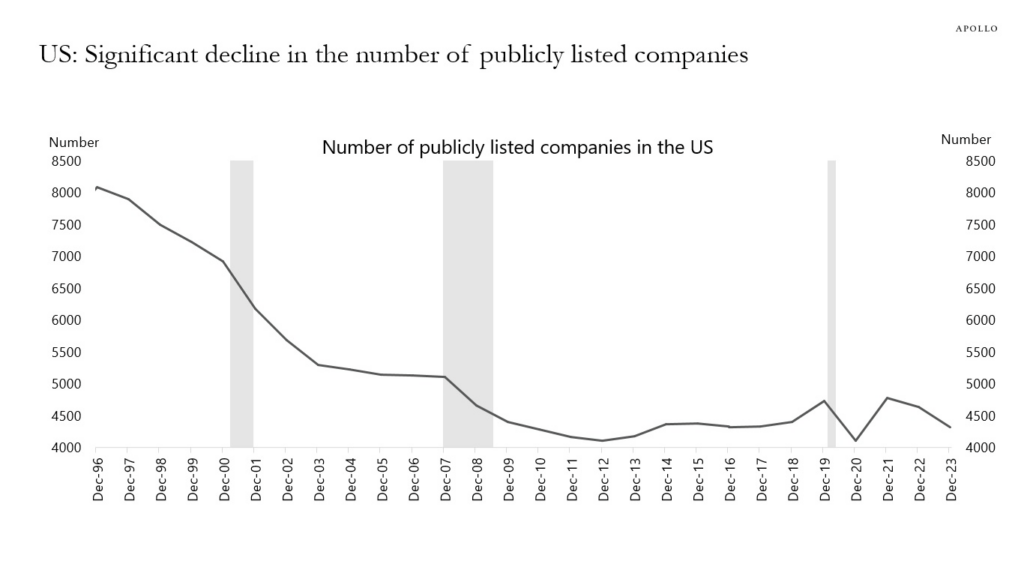
As noted, “money flows” are the “demand side” of the equation. As previously discussed, the “supply side,” or the amount of “assets available,” continues to decline. Such explains why managers continue to “chase stocks” despite high valuations.
“The number of publicly traded companies continues to decline, as shown in the following chart from Apollo. This decline has many reasons, including mergers and acquisitions, bankruptcy, leveraged buyouts, and private equity. For example, Twitter (now X) was once a publicly traded company before Elon Musk acquired it and took it private. Unsurprisingly, with fewer publicly traded companies, there are fewer opportunities as market capital increases. Such is particularly the case for large institutions that must deploy large amounts of capital over short periods.”
The same is true for gold. While the demand for gold increases as prices rise, the supply of gold has declined since 2019.
As such, gold is no longer a “risk-off ” asset with a negative correlation to equities but is now a risk-on asset, just like equities. The 4-year correlation to the S&P 500 is near previous peaks, with subsequent performance.
Of course, these “everything markets” can last much longer than logic suggests. However, they do end. What causes “everything markets” to end is whatever exogenous, unexpected event turns off the flow of liquidity.
Technically Speaking
As noted, “everything markets” can last longer than logic dictates. However, they eventually end, and we don’t know what will cause it or when. Take a look at the two charts below.
In each chart, I have denoted periods where three factors occurred:
- The market traded at 2-or more standard deviations above the 4-year moving average
- Relative Strength was overbought on a long-term basis
- The MACD was elevated and triggering a “sell signal.”
In both cases, these technical extremes marked short to long-term corrections and consolidations for stocks and gold. For the S&P 500 index, these periods also corresponded to more important headline events such as the “Crash of 1987,” the “Dot.com Crash,” and the “Financial Crisis.” Notably, like the S&P 500, the technical deviations for gold are also at levels that have denoted short to long-term corrective cycles.
As Paulsen noted in his interview, “everything markets” typically last only six months to a year. He expects this one to be in force at least for “the next several months.”
“Although the road ahead, even if some of my thinking proves correct, will still be interrupted by regular bouts of volatility, investors may want to consider staying bullish during the next several months, finally enjoying a mini restart to this bull market and perhaps witness what full support can do for your portfolio.”
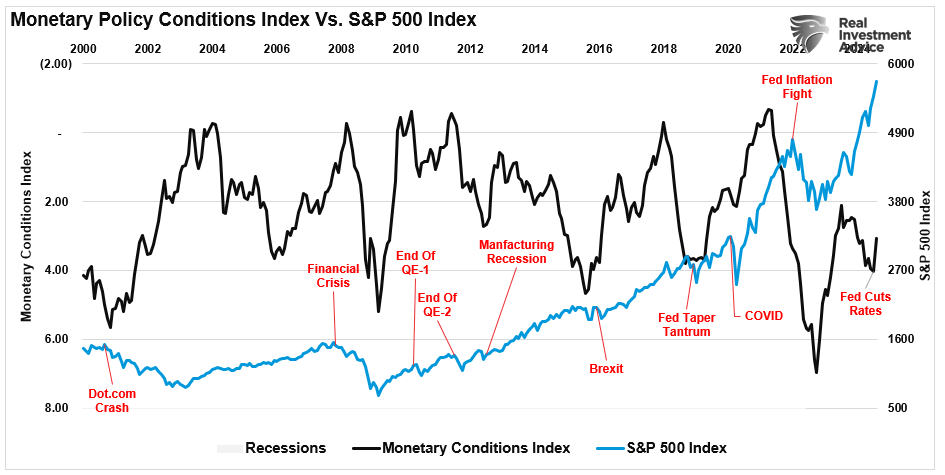
We have no idea what will eventually cause a shift in liquidity as the Federal Reserve and global central banks move back into easing mode. (The monetary conditions index combines interest rates, the dollar, and inflation. It is inverted to correspond to rising asset prices.)
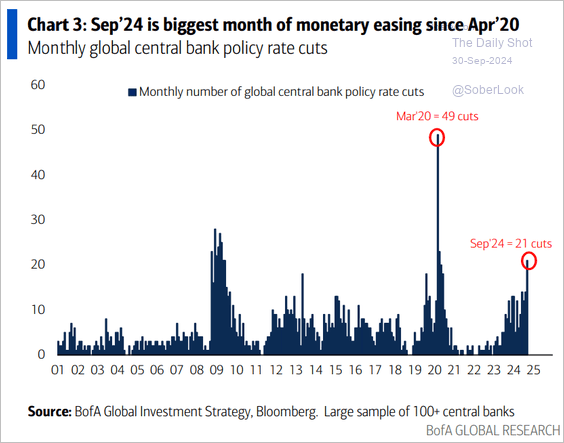
Critically, September was the biggest month of monetary easing since April 2020 amid the global pandemic crisis.
Notably, an eventual reversal could be caused by a “crisis event” or a reversal of monetary flows. The technical analysis tells us that it will occur and likely when the fewest investors expect it.
But that isn’t today.
Of course, this is always the case, so investors regularly “buy high and sell low.”
Remember Warren Buffett’s famous words when investing in an “everything market.”
“Investing is a lot like sex. It feels the best just before the end.”
Of course, maybe that is why Warren has been raising a lot of cash lately.
That’s it for today! If you want more insights like these, subscribe to our newsletter for regular updates on market trends and investing strategies.
Lance Roberts is a Chief Portfolio Strategist/Economist for RIA Advisors. He is also the host of “The Lance Roberts Podcast” and Chief Editor of the “Real Investment Advice” website and author of “Real Investment Daily” blog and “Real Investment Report“. Follow Lance on Facebook, Twitter, Linked-In and YouTube
© 2024 Benzinga.com. Benzinga does not provide investment advice. All rights reserved.
Insider Unloading: THOMAS LEONARD Sells $674K Worth Of Kadant Shares
A substantial insider sell was reported on September 30, by THOMAS LEONARD, Director at Kadant KAI, based on the recent SEC filing.
What Happened: LEONARD’s recent move involves selling 2,000 shares of Kadant. This information is documented in a Form 4 filing with the U.S. Securities and Exchange Commission on Monday. The total value is $674,796.
Kadant‘s shares are actively trading at $338.0, experiencing a down of 0.0% during Tuesday’s morning session.
Discovering Kadant: A Closer Look
Kadant Inc. supplies process and engineering equipment for papermaking, recycling, lumber manufacturing, and related industries. The company’s three reportable segments are the Flow Control segment which consists of the fluid-handling and doctoring, cleaning, & filtration product lines; the Industrial Processing segment which consists of the wood processing and stock-preparation product lines; and Material handling systems, which provides conveyor-belt equipment for industries such as mining, food processing, and packaging. The company has a geographic presence with sizable revenue from the U.S., Europe, Asia, and Canada.
Key Indicators: Kadant’s Financial Health
Revenue Growth: Over the 3 months period, Kadant showcased positive performance, achieving a revenue growth rate of 12.12% as of 30 June, 2024. This reflects a substantial increase in the company’s top-line earnings. As compared to competitors, the company surpassed expectations with a growth rate higher than the average among peers in the Industrials sector.
Key Profitability Indicators:
-
Gross Margin: The company excels with a remarkable gross margin of 44.36%, indicating superior cost efficiency and profitability compared to its industry peers.
-
Earnings per Share (EPS): Kadant’s EPS is significantly higher than the industry average. The company demonstrates a robust bottom-line performance with a current EPS of 2.66.
Debt Management: With a below-average debt-to-equity ratio of 0.43, Kadant adopts a prudent financial strategy, indicating a balanced approach to debt management.
Financial Valuation Breakdown:
-
Price to Earnings (P/E) Ratio: Kadant’s P/E ratio of 34.77 is below the industry average, suggesting the stock may be undervalued.
-
Price to Sales (P/S) Ratio: With a relatively high Price to Sales ratio of 3.95 as compared to the industry average, the stock might be considered overvalued based on sales performance.
-
EV/EBITDA Analysis (Enterprise Value to its Earnings Before Interest, Taxes, Depreciation & Amortization): A high EV/EBITDA ratio of 20.17 reflects market recognition of Kadant’s value, positioning it as more highly valued compared to industry peers.
Market Capitalization Analysis: Reflecting a smaller scale, the company’s market capitalization is positioned below industry averages. This could be attributed to factors such as growth expectations or operational capacity.
Now trade stocks online commission free with Charles Schwab, a trusted and complete investment firm.
Illuminating the Importance of Insider Transactions
Insider transactions, although significant, should be considered within the larger context of market analysis and trends.
From a legal standpoint, the term “insider” pertains to any officer, director, or beneficial owner holding more than ten percent of a company’s equity securities as outlined in Section 12 of the Securities Exchange Act of 1934. This encompasses executives in the c-suite and significant hedge funds. These insiders are mandated to inform the public of their transactions through a Form 4 filing, to be submitted within two business days of the transaction.
A company insider’s new purchase is a indicator of their positive anticipation for a rise in the stock.
While insider sells may not necessarily reflect a bearish view and can be motivated by various factors.
Unlocking the Meaning of Transaction Codes
When analyzing transactions, investors tend to focus on those in the open market, detailed in Table I of the Form 4 filing. A P in Box 3 denotes a purchase,while S signifies a sale. Transaction code C signals the conversion of an option, and transaction code A denotes a grant, award, or other acquisition of securities from the company.
Check Out The Full List Of Kadant’s Insider Trades.
Insider Buying Alert: Profit from C-Suite Moves
Benzinga Edge reveals every insider trade in real-time. Don’t miss the next big stock move driven by insider confidence. Unlock this ultimate sentiment indicator now. Click here for access.
This article was generated by Benzinga’s automated content engine and reviewed by an editor.
Market News and Data brought to you by Benzinga APIs
© 2024 Benzinga.com. Benzinga does not provide investment advice. All rights reserved.
Russell Shaller Exercises Options, Realizes $876K
A significant insider transaction involving the exercise of company stock options was reported on September 30, by Russell Shaller, President & CEO at Brady BRC, as per the latest SEC filing.
What Happened: Shaller, President & CEO at Brady, made a strategic move by exercising stock options for 21,128 shares of BRC as detailed in a Form 4 filing on Monday with the U.S. Securities and Exchange Commission. The transaction value amounted to $876,600.
The Tuesday morning market activity shows Brady shares down by 0.0%, trading at $76.63. This implies a total value of $876,600 for Shaller’s 21,128 shares.
Delving into Brady’s Background
Brady Corp provides identification solutions and workplace safety products. The company offers identification and healthcare products that are sold under the Brady brand to maintenance, repair, and operations as well as original equipment manufacturing customers. Products include safety signs and labeling systems, material identification systems, wire identification, patient identification, and people identification. Brady also provides workplace safety and compliance products such as safety and compliance signs, asset tracking labels, and first-aid products. The company is organized and managed on a geographic basis with two reportable segments: Americas & Asia which derives maximum revenue, and Europe & Australia.
Brady: Financial Performance Dissected
Decline in Revenue: Over the 3 months period, Brady faced challenges, resulting in a decline of approximately -0.73% in revenue growth as of 31 July, 2024. This signifies a reduction in the company’s top-line earnings. When compared to others in the Industrials sector, the company excelled with a growth rate higher than the average among peers.
Key Insights into Profitability Metrics:
-
Gross Margin: Achieving a high gross margin of 51.56%, the company performs well in terms of cost management and profitability within its sector.
-
Earnings per Share (EPS): Brady’s EPS is significantly higher than the industry average. The company demonstrates a robust bottom-line performance with a current EPS of 1.16.
Debt Management: Brady’s debt-to-equity ratio is below the industry average. With a ratio of 0.12, the company relies less on debt financing, maintaining a healthier balance between debt and equity, which can be viewed positively by investors.
Valuation Analysis:
-
Price to Earnings (P/E) Ratio: With a lower-than-average P/E ratio of 18.83, the stock indicates an attractive valuation, potentially presenting a buying opportunity.
-
Price to Sales (P/S) Ratio: With a higher-than-average P/S ratio of 2.77, Brady’s stock is perceived as being overvalued in the market, particularly in relation to sales performance.
-
EV/EBITDA Analysis (Enterprise Value to its Earnings Before Interest, Taxes, Depreciation & Amortization): With an impressive EV/EBITDA ratio of 12.55, Brady demonstrates exemplary market valuation, surpassing industry averages.
Market Capitalization: Positioned above industry average, the company’s market capitalization underscores its superiority in size, indicative of a strong market presence.
Now trade stocks online commission free with Charles Schwab, a trusted and complete investment firm.
Why Insider Transactions Are Important
Insider transactions, although significant, should be considered within the larger context of market analysis and trends.
Exploring the legal landscape, an “insider” is defined as any officer, director, or beneficial owner holding more than ten percent of a company’s equity securities, as stipulated by Section 12 of the Securities Exchange Act of 1934. This encompasses executives in the c-suite and major hedge funds. These insiders are required to report their transactions through a Form 4 filing, which must be submitted within two business days of the transaction.
Highlighted by a company insider’s new purchase, there’s a positive anticipation for the stock to rise.
But, insider sells may not necessarily indicate a bearish view and can be motivated by various factors.
A Deep Dive into Insider Transaction Codes
Navigating through the landscape of transactions, investors often prioritize those unfolding in the open market, precisely detailed in Table I of the Form 4 filing. A P in Box 3 denotes a purchase, while S signifies a sale. Transaction code C signals the conversion of an option, and transaction code A denotes a grant, award, or other acquisition of securities from the company.
Check Out The Full List Of Brady’s Insider Trades.
Insider Buying Alert: Profit from C-Suite Moves
Benzinga Edge reveals every insider trade in real-time. Don’t miss the next big stock move driven by insider confidence. Unlock this ultimate sentiment indicator now. Click here for access.
This article was generated by Benzinga’s automated content engine and reviewed by an editor.
© 2024 Benzinga.com. Benzinga does not provide investment advice. All rights reserved.


