Pharma Company Gets FDA Green Light For Next Phase Trial For Tourette Syndrome
SciSparc Ltd.SPRC, a clinical-stage pharmaceutical company, announced that the U.S. Food and Drug Administration (FDA) has approved its investigational new drug (IND), which enables the company to proceed to Phase IIb clinical trial for its medication to treat Tourette Syndrome (TS).
This FDA approval is a significant milestone for the company as it seeks to address unmet medical needs in managing TS.
SciSparc Targets Unmet Medical
Tourette Syndrome is a complex neurological disorder that affects patients worldwide, especially children and adolescents. Existing treatments often fall short of effectively managing symptoms. “As the currently used medications are managing only a small number of disease symptoms with limited efficacy and questionable safety, we believe there is a clear unmet medical need for the management of TS,” said SciSparc’s CEO, Oz Adler.
SciSparc’s drug candidate, SCI-110, has already shown promising results in earlier trials. A Phase IIa clinical trial at Yale University demonstrated a reduction in TS-related tics of 21% across patients with almost 40% of participants experiencing a greater than 25% reduction.
Read Also: CBD & THC Combined Helps Treat Tourette Syndrome Symptoms, New Study Finds
Global Clinical Trial To Start Soon
The upcoming Phase IIb trial will take place at three medical institutions: the Yale Child Study Center in Connecticut, the Hannover Medical School in Germany and the Tel Aviv Sourasky Medical Center in Israel.
This trial will focus on assessing the efficacy, safety, and tolerability in adult patients. “The therapy of choice should also have a favorable safety profile, allowing for high patient drug compliance,” Adler added.
Participants in the trial will be randomized at a 1:1 ratio to receive either SCI-110 or a placebo. The trial will measure changes using the Yale Global Tic Severity Scale at weeks 12 and 26, with the primary safety objective being to assess serious adverse events across the patient population.
Cannabinoids And The Broader Vision
SciSparc is specialized in cannabinoid-based treatments for neurological disorders.
Besides SCI-110 for TS, the company is also exploring its potential for Alzheimer’s disease and agitation. “We believe our innovative drug candidate SCI-110 has the potential to be this desired therapy,” Adler said.
Cover: AI generated image
Market News and Data brought to you by Benzinga APIs
© 2024 Benzinga.com. Benzinga does not provide investment advice. All rights reserved.
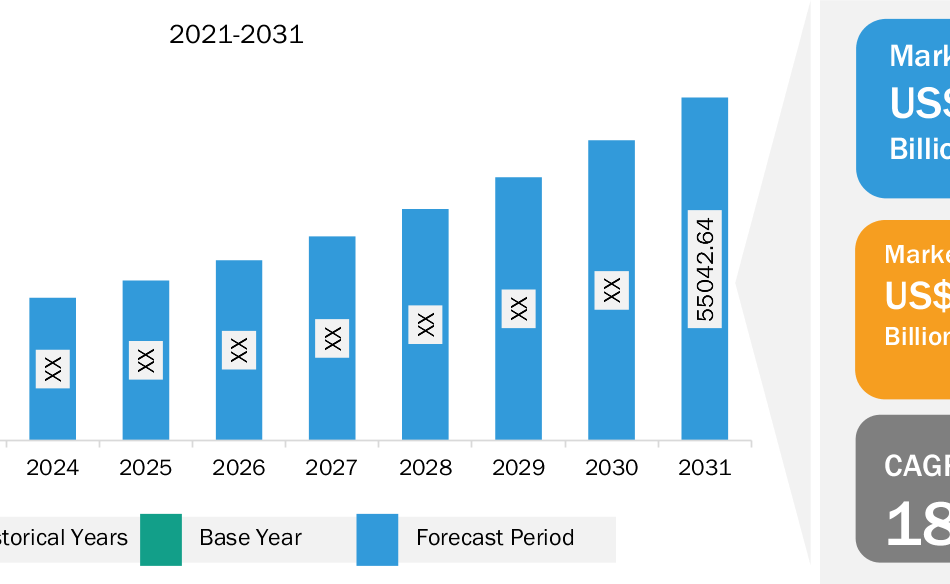
Multi-Factor Authentication Market Size Worth $55.04 Billion, Globally, by 2031 – Exclusive Report by The Insight Partners
US & Canada, Sept. 30, 2024 (GLOBE NEWSWIRE) — According to a new comprehensive report from The Insight Partners, the global multi-factor authentication market is observing significant growth owing to rising adoption of BYOD trends and stringent government regulations.
Global multi-factor authentication market experiences stringent government regulations. Browse More Insights: https://www.theinsightpartners.com/reports/multi-factor-authentication-market
The report runs an in-depth analysis of market trends, key players, and future opportunities. In general, the multi-factor authentication market comprises a vast array of software, hardware, and services that are expected to register strength during the coming years.
Download Sample Report: https://www.theinsightpartners.com/sample/TIPRE00003188/

Overview of Report Findings:
1. Market Growth: The multi-factor authentication market is expected to reach US$ 55.04 billion by 2031 from US 14.44 billion in 2023, at a CAGR of 18.2% during the forecast period. An increasing number of cyberattacks has driven the demand for multi-factor authentication systems in the market. Multi-factor authentication (MFA) is an authentication method that involves a multi-step account login process rather than just a password. A multi-factor authentication (MFA) solution needs the user to provide two or more verification parameters to gain access to their resources such as an application, online account, or a VPN.
Identify The Key Trends Affecting This Market – Download Sample PDF: https://www.theinsightpartners.com/sample/TIPRE00003188/
2. Technological Innovations: Usage of AI in multi factor authentication (MFA) has emerged as a powerful tool to bolster security measures and protect sensitive information. By leveraging AI technology, organizations can enhance the effectiveness and resilience of their multi-factor authentication solutions, thereby mitigating potential risks and fortifying their digital identities. Technologies such as AI can be used in many ways to improve the security of multi-factor authentication systems.
3. Increasing Volume of Online Transactions: The digital payments ecosystem has gained traction in recent years. The internet penetration and the rise in the usage of smartphones are a few of the prominent factors boosting the growth of digital payments. The rise in online shopping and the advancement of the e-commerce sector has significantly increased after the onset of the COVID-19 crisis, which has led to the growth of online financial transactions. According to the information by The World Bank in “Global Findex Database 2021,” ~40% of adults in the developing economies, excluding China, made a digital merchant payment by phone, card, or the internet; over one-third of adults in developing economies paid a utility bill directly from an account.
4. Geographical Insights: In 2023, North America led the market with a substantial revenue share, followed by Europe and APAC. North America is expected to register the highest CAGR during the forecast period.
Purchase Premium Copy of Multi-Factor Authentication Market Growth Report (2023-2031) at: https://www.theinsightpartners.com/buy/TIPRE00003188/
Market Segmentation:
- Based on components, the multi-factor authentication market is bifurcated into software, hardware, and services. The software segment held a larger share of the multi-factor authentication market in 2023.
- By authentication type, the multi-factor authentication market is segmented into password based authentication and passwordless authentication. The password based authentication segment held the largest share of the multi-factor authentication market in 2023.
- In terms of model type, the multi-factor authentication market is divided into two factor authentication, three factor authentication, four factor authentication, and five factor authentication. The two factor authentication segment held a larger share of the multi-factor authentication market in 2023.
- In terms of end user, the multi-factor authentication market is divided into IT and telecom, BFSI, education, government, healthcare, and others. The IT and telecom segment held a larger share of the multi-factor authentication market in 2023.
- The multi-factor authentication market is segmented into five major regions: North America, Europe, APAC, Middle East and Africa, and South and Central America.
Obtain Analysis of Key Geographic Markets – Download Report PDF: https://www.theinsightpartners.com/sample/TIPRE00003188/
Competitive Strategy and Development:
- Key Players: A few major companies operating in the multi-factor authentication market include Microsoft, Thales., Okta, OneSpan, HID Global Corporation, Cisco Systems, Inc., Ping Identity., RSA Security, and CyberArk Software Ltd.
- Trending Topics: Adaptive Authentication, Biometric advancements, Mobile authentication, Artificial Intelligence.
Global Headlines on Multi-factor Authentication:
- “OneSpan launched passwordless, phishing-resistant authentication for a secure workforce.”
- “Entrust Launched Zero Trust Ready Solutions for Passwordless Authentication, Next-Generation HSM, and Multi-Cloud Key Compliance”
- “Microsoft released system-preferred multi-factor authentication.”
- “Thales expanded passwordless authentication for Microsoft Azure active directory customers with new phishing-resistant hybrid authenticators.”
Want More Information about Competitors and Market Players? Get Sample PDF: https://www.theinsightpartners.com/sample/TIPRE00003188/
Conclusion:
Digital security is important in today’s business environment as businesses and users store crucial and sensitive information online. There is an increase in interaction with services, applications, and data that are stored over the Internet. A data breach or misuse of this online stored information could lead to serious financial theft, business disruption, and loss of privacy. In such a scenario, multi-factor authentication solutions can provide protection, creating an additional layer of security to block unauthorized users from accessing online accounts. Businesses use multi-factor authentication solutions to validate user identities and also to provide quick and convenient access to authorized users. The impact caused by the COVID-19 crisis forced many companies to adopt remote work solutions, making multi-factor authentication a requirement to protect the company’s data. A majority of companies have started to deploy multi-factor authentication solutions. Further, the adoption of MFA was largely driven by government regulations for enhanced cybersecurity to protect consumer data. Moreover, the growing number of cyberattacks and rising BYOD trends are significantly driving organizations to adopt and deploy multi-factor authentication solutions.
Require A Diverse Region or Sector? Customize Research to Suit Your Requirement: https://www.theinsightpartners.com/inquiry/TIPRE00003188/
The report from The Insight Partners, therefore, provides several stakeholders—including component providers, system technology integrators, system manufacturers and others—with valuable insights into how to successfully navigate this evolving market landscape and unlock new opportunities.
Related Report Titles:
- 3D Secure Authentication Market Analysis and Forecast by Size, Share, Growth, Trends 2031
- 3D Secure Payment Authentication Market Forecast 2031
- Passive Authentication Market Size and Forecasts (2021 – 2031)
- Advanced Authentication Market Size and Forecasts (2021 – 2031)
- Authentication Software Market Size and Forecasts (2021 – 2031)
- Risk-based Authentication Market Size and Forecasts (2021 – 2031)
- Authentication and Brand Protection Market Analysis, Size, Share, Growth, Trends, and Forecast by 2030
- Digital Payment Market Size, Share, Trends, Report 2028
- Digital Security Market Size and Forecasts (2021 – 2031)
- Payment Terminal Market Growth Analysis (2031)
- Biometric Payment Cards Market Forecast 2031
- In-Vehicle Payment Services Market Report (2031)
- Virtual Payment (POS) Market Forecast and Growth Report 2031
- Payment as a Service Market Growth and Size by 2031
- Payment HSMs Market Growth and Size by 2031
- Banking and Payment Smart Card Market Forecast and Growth 2031
- Freight Audit and Payment Market Forecast and Growth 2031
- Payment Security Market Forecast and Growth 2031
- QR Code Payment Market Overview, Growth, Trends, Analysis, Research Report (2021-2031)
- Payment Machine Mounting Systems Market Size and Growth 2031
About Us:
The Insight Partners is a one stop industry research provider of actionable intelligence. We help our clients in getting solutions to their research requirements through our syndicated and consulting research services. We specialize in industries such as Semiconductor and Electronics, Aerospace and Defense, Automotive and Transportation, Biotechnology, Healthcare IT, Manufacturing and Construction, Medical Device, Technology, Media and Telecommunications, Chemicals and Materials.
Contact Us:
If you have any queries about this report or if you would like further information, please contact us:
Contact Person: Ankit Mathur
E-mail: ankit.mathur@theinsightpartners.com
Phone: +1-646-491-9876
Press Release: https://www.theinsightpartners.com/pr/multi-factor-authentication-market

© 2024 Benzinga.com. Benzinga does not provide investment advice. All rights reserved.
Is Your Income Higher Than The Average Middle-Class Household? Here's What They're Earning
Curious about where your paycheck stands compared to the average middle-class American?
According to Pew Research, the median income for middle-class households reached $106,100 in 2022. That’s a 60% jump from the $66,400 median income in 1970. While that sounds impressive, it’s worth noting that upper-income households saw an even larger increase of 78%, while lower-income households only experienced a 55% bump. So, if you’re earning more than $106,100, congratulations – you’re ahead of the curve!
Don’t Miss:
However, it’s essential to recognize that the share of Americans living in middle-class households is shrinking. In 1971, 61% of Americans were classified as middle class. Fast forward to 2023, and that number has dropped to 51%, according to a Pew Research Center analysis of government data. This decline highlights the growing wealth gap and the challenges many face in achieving that once-coveted middle-class lifestyle.
But let’s not get too caught up in just the numbers. What matters is how you manage that income. A high salary means little if it’s not used wisely. Financial savvy can turn a modest paycheck into a wealth-building machine.
Trending: Founder of Personal Capital and ex-CEO of PayPal re-engineers traditional banking with this new high-yield account — start saving better today.
Making Your Income Work for You
Earning more or less than the average middle-class household is one thing, but maximizing what you have is another. Here are some straightforward strategies to help you boost your income and make the most of your earnings:
Network Effectively: Building a strong professional network can open doors to new job opportunities and career advancements. Stay connected and leverage your contacts for potential job leads.
Invest in Skills: Continuing education can significantly enhance your employability. Take advantage of workshops, online courses, and certifications to increase your skill set and value in the job market.
Trending: Amid the ongoing EV revolution, previously overlooked low-income communities now harbor a huge investment opportunity at just $500.
Seek Advancement Opportunities: If your employer offers training programs or leadership development, jump in. These opportunities can lead to promotions and raises.
Know Your Worth: Research industry standards to understand your role regarding salary. This information allows you to confidently negotiate your pay during job interviews or performance reviews.
Budget Wisely: A solid budget is essential regardless of your income level. Aim to save 20% of your earnings for retirement, vacations, or other financial goals. This discipline will pay dividends in the long run.
Trending: These five entrepreneurs are worth $223 billion – they all believe in one platform that offers a 7-9% target yield with monthly dividends
The Road to Financial Independence
Increasing your income while spending wisely is key to building wealth and achieving financial independence. The goal isn’t just about hitting a specific income number; it’s about creating a sustainable lifestyle that allows you to enjoy your money without financial uncertainty.
So, whether you are above or below that $106,100 threshold, remember that your financial habits will ultimately determine your success. It’s not just about how much you make – it’s about how you make it work for you.
Read Next:
UNLOCKED: 5 NEW TRADES EVERY WEEK. Click now to get top trade ideas daily, plus unlimited access to cutting-edge tools and strategies to gain an edge in the markets.
Get the latest stock analysis from Benzinga?
This article Is Your Income Higher Than The Average Middle-Class Household? Here’s What They’re Earning originally appeared on Benzinga.com
© 2024 Benzinga.com. Benzinga does not provide investment advice. All rights reserved.
3 High-Yield Dividend Stocks to Buy and Hold Forever
Dividends offer investors an incredible strategy to building long-term wealth, especially when those dividends are reinvested. Not only do the following stocks all offer a dividend yield exceeding 5%, they all have their own reasons to be held forever. Let’s dig in.
Heating up
Global renewable energy is on fire right now, in a good way. Global annual renewable capacity additions jumped by nearly 50% in 2023, which was the fastest growth rate over the past two decades. It was also the 22nd consecutive year that renewable capacity additions set a new record — this is a trend investors can get behind.
Those statistics leave a company like Clearway Energy (NYSE: CWEN) poised to benefit in the years ahead as renewable energy continues to boom. Clearway Energy is one of the largest owners of clean energy generation assets in the U.S. market and its fleet comprises roughly 9,000 MW of net owned generating capacity across 26 states. Those assets include wind, solar, energy storage assets, and environmentally sound natural gas generation facilities.
Not only does the Federal Reserve rate cut enable Clearway to more affordably fund acquisitions, the company has multiple investments in renewable energy projects lined up. The company also offers incredible transparency around its dividend, which boasts a yield of 5.5% currently, with a 5% to 8% target growth rate through 2026 and a payout ratio between 80% to 85%.
As renewable energy continues to boom, Clearway is a stock you can hold forever while reinvesting its robust dividend.
Acquisition and 5G
Verizon Communications (NYSE: VZ) is the largest American telecommunications business by revenue, and the company makes its living primarily off internet and phone subscriptions, as well as equipment sales. But a recent move brings a little more into the fold.
Early in September, Verizon announced it had entered into an agreement to acquire Frontier in an all-cash transaction valued at $20 billion. It’s a strategic move that will bring in one of the largest pure-play fiber internet providers and will expand Verizon’s fiber footprint significantly. The acquisition will also increase scale with 2.2 million fiber subscribers, and management believes it can generate at least $500 million in annual run-rate cost synergies.
The reason investors can hold Verizon forever, however, has more to do with its work in 5G. The barriers to entry are so high in the industry that Verizon is likely to remain one of only three companies to boast a nationwide 5G network.
Verizon recently increased its dividend, which marked the 18th consecutive year the company’s board approved a quarterly dividend increase. Currently Verizon’s dividend yield sits at a juicy 6%, and with its acquisition and work with 5G, the company can be held forever.
EV woes
Ford Motor Company‘s (NYSE: F) upside is almost addition by subtraction. While its Ford Blue and Ford Pro divisions are busy printing out profits, Ford’s model e unit, responsible for electric vehicles, is doing the opposite and is projected to lose up to $5.5 billion in 2024 alone.
The iconic automaker isn’t sitting by letting losses mount, however, and has delayed as much as $12 billion in EV investment. Management was spending 40% of capital expenditure on EVs, but that has been slashed down to 30%. Ford has canceled a line of EV SUVs, minimized plans of a battery factory, and attacked the cost structure of its EVs with a “skunkworks” team aiming to develop a low-cost platform targeting prices around $25,000.
The auto industry’s transition to a future of EVs has been slower than anticipated, and losses might drag on longer than investors would like. But eventually if Ford just breaks even with its model e division, it’ll be a huge boost to the bottom line and its ability to increase dividends going forward.
The automotive industry is cyclical and also going through an EV revolution, and investors would be wise to hold a stock like Ford long term as it works through its headwinds and reverses EV losses. At current prices Ford’s dividend sits at a yield of 5.7%, and often offers investors supplemental dividends when it has extra cash.
Buy and hold
These three stocks give investors a way to play the booming renewable energy industry, own limited access to the future of 5G, and profit as automakers bring down the prices of EVs. All three companies offer dividend yields that exceed 5%, and they are certainly stocks you can hold forever.
Should you invest $1,000 in Ford Motor Company right now?
Before you buy stock in Ford Motor Company, consider this:
The Motley Fool Stock Advisor analyst team just identified what they believe are the 10 best stocks for investors to buy now… and Ford Motor Company wasn’t one of them. The 10 stocks that made the cut could produce monster returns in the coming years.
Consider when Nvidia made this list on April 15, 2005… if you invested $1,000 at the time of our recommendation, you’d have $743,952!*
Stock Advisor provides investors with an easy-to-follow blueprint for success, including guidance on building a portfolio, regular updates from analysts, and two new stock picks each month. The Stock Advisor service has more than quadrupled the return of S&P 500 since 2002*.
*Stock Advisor returns as of September 23, 2024
Daniel Miller has positions in Ford Motor Company. The Motley Fool recommends Verizon Communications. The Motley Fool has a disclosure policy.
3 High-Yield Dividend Stocks to Buy and Hold Forever was originally published by The Motley Fool
Tradepulse Power Inflow Alert: Eli Lilly And Company Climbs 15 Points
STOCK RISES THOUGHT THE DAY AND HITS HIGH AT 3:55 PM EDT
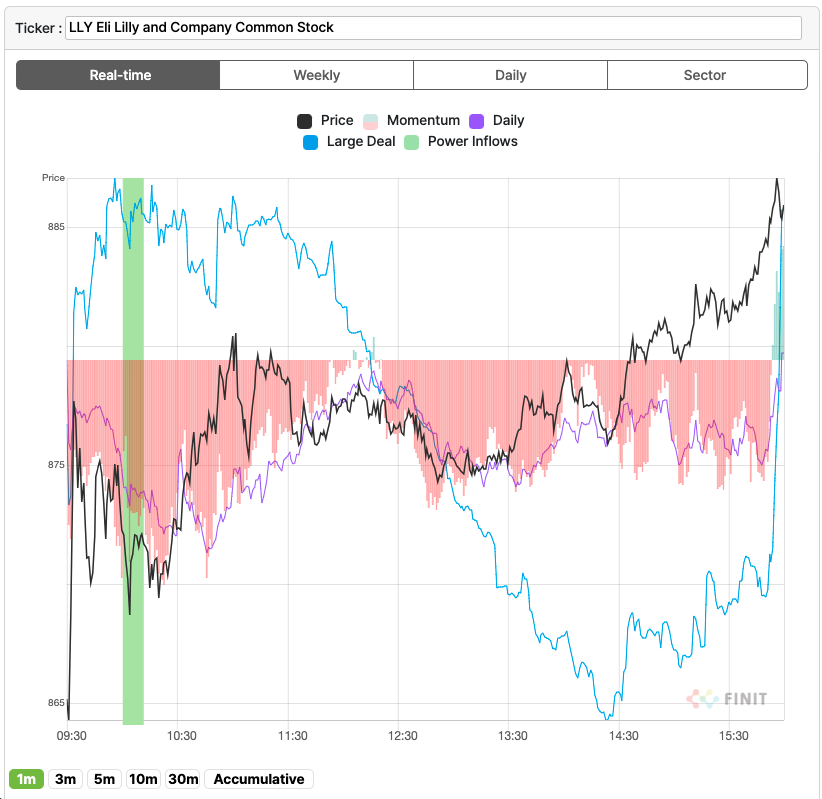
ELI LILLY Inc. LLY today experienced a Power Inflow, a significant event for those who follow where smart money goes and value order flow analytics in their trading decisions.
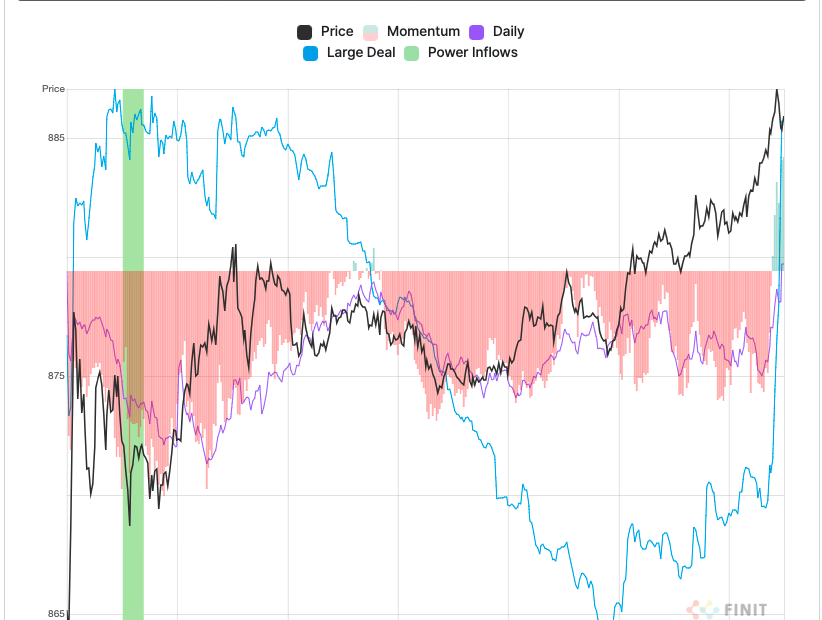
Today, at 10:10 AM on September 30th, a significant trading signal occurred for Eli Lilly, Inc. as it demonstrated a Power Inflow at $872. This indicator is crucial for traders who want to know directionally where institutions and so-called “smart money” moves in the market. They see the value of utilizing order flow analytics to guide their trading decisions. The Power Inflow points to a possible uptrend in Amazon’s stock, marking a potential entry point for traders looking to capitalize on the expected upward movement. Traders with this signal closely watch for sustained momentum in Amazon’s stock price, interpreting this event as a bullish sign.
Signal description
Order flow analytics, aka transaction or market flow analysis, separate and study both the retail and institutional volume rate of orders (flow). It involves analyzing the flow of buy and sell orders, along with size, timing, and other associated characteristics and patterns, to gain insights and make more informed trading decisions. This particular indicator is interpreted as a bullish signal by active traders.
The Power Inflow occurs within the first two hours of the market open and generally signals the trend that helps gauge the stock’s overall direction, powered by institutional activity in the stock, for the remainder of the day.
By incorporating order flow analytics into their trading strategies, market participants can better interpret market conditions, identify trading opportunities, and potentially improve their trading performance. But let’s not forget that while watching smart money flow can provide valuable insights, it is crucial to incorporate effective risk management strategies to protect capital and mitigate potential losses. Employing a consistent and effective risk management plan helps traders navigate the uncertainties of the market in a more controlled and calculated manner, increasing the likelihood of long-term success
If you want to stay updated on the latest options trades for LLY, Benzinga Pro gives you real-time options trades alerts.
Market News and Data brought to you by Benzinga APIs and include firms, like Finit USA, responsible for parts of the data within this article.
© 2024 Benzinga.com. Benzinga does not provide investment advice. All rights reserved.
After Market Close UPDATE:
The price at the time of the Power Inflow was $872. The returns on the High price ($887.07) and Close price ($885.94) after the Power Inflow are respectively 1.6% and 1.5%. The result underlines the importance of a trading plan that includes Profit Targets and Stop Losses that reflect your appetite for risk. The results were close today but that is not always the case.
Past results are not indicative of future results
Market News and Data brought to you by Benzinga APIs
© 2024 Benzinga.com. Benzinga does not provide investment advice. All rights reserved.
Bearish Monday For Marijuana Stocks – Australis Capital, Choom Holdings Among Top Gainers
GAINERS:
LOSERS:
This article was generated by Benzinga’s automated content engine and reviewed by an editor.
Market News and Data brought to you by Benzinga APIs
© 2024 Benzinga.com. Benzinga does not provide investment advice. All rights reserved.
Click on the image for more info.
Cannabis rescheduling seems to be right around the corner
Want to understand what this means for the future of the industry?
Hear directly for top executives, investors and policymakers at the Benzinga Cannabis Capital Conference, coming to Chicago this Oct. 8-9.
Get your tickets now before prices surge by following this link.
Alibaba's Sun Art suspends Hong Kong trading, sparking divestment speculation
China’s largest hypermarket operator has suspended the trading of its Hong Kong-listed stock since Friday pending an announcement on mergers and acquisitions, fanning speculation that Alibaba Group Holding may divest its controlling shares.
Alibaba took control of Sun Art Retail Group from the Mulliez, a wealthy French family, for HK$28 billion (US$3.6 billion) in October 2020, as the e-commerce giant sought to synergise online shopping and offline hypermarkets under a “new retail” model.
Sun Art shares traded most recently at HK$1.79, down about 78 per cent from the price per share of about HK$8.1 that Alibaba paid at the time of its investment. Alibaba is the owner of the South China Morning Post.
Do you have questions about the biggest topics and trends from around the world? Get the answers with SCMP Knowledge, our new platform of curated content with explainers, FAQs, analyses and infographics brought to you by our award-winning team.
Sun Art did not provide details about potential takeovers or mergers in its stock exchange filing. The company declined to comment further. Alibaba did not immediately respond to a request for comment on Monday.
An Alibaba office building in Beijing. Photo: Reuters alt=An Alibaba office building in Beijing. Photo: Reuters>
The wait has raised market speculation about a partial or complete sell-off of Alibaba’s Sun Art stake. The hypermarket operator has attracted “preliminary interest” from private equity firms, including DCP Capital and Hillhouse Investment, Bloomberg reported on Friday, citing unnamed sources.
A divestment by Alibaba is likely, according to analysts.
“There is a great chance that it will involve a change in equity, and in that case, the possibility of a change in Alibaba’s equity is relatively high,” said Kenny Ng, a strategist at Everbright Securities International.
“After all, Alibaba holds the majority of [Sun Art’s] shares.”
A sell-off by Alibaba would be in line with its recent moves to trim noncore assets and sharpen its focus on core businesses amid mounting challenges, including rising e-commerce competition and slow revenue growth.
“Now the big e-commerce platforms mainly concentrate on the lower-tier markets and operate under more competitive pressure, and it has become a general trend to shrink some noncore businesses,” said Ng.
A divestment could signal a change in Alibaba’s strategic positioning, according to Bai Wenxi, chief economist of China Enterprise Capital Union.
Sun Art’s stores, which mainly include supermarket brands RT-Mart and Auchan, have pursued a new retail strategy after coming under Alibaba’s control.
The hypermarket chain has connected its inventory with multiple Alibaba platforms, including on-demand delivery service Ele.me, fresh food delivery service Taoxianda and Tmall Supermarket.
An RT-Mart hypermarket in Shanghai. Photo: Bloomberg alt=An RT-Mart hypermarket in Shanghai. Photo: Bloomberg>
But past Covid-19 restrictions, as well as the “many trials and costs” involved in the integration process, have slowed development, according to Ng.
He expected things to get better after Alibaba said in August that most of its businesses other than e-commerce and cloud computing are expected to break even in a year or two.
The Hangzhou-based e-commerce giant has continued to consolidate its retail assets since last year, as the company seeks to refocus on its bread-and-butter e-commerce and cloud businesses amid a sprawling restructuring process unveiled in March 2023.
The company has been mulling the sales of many of its noncore operations, such as physical retail.
Sun Art’s revenue declined by 13.3 per cent year on year to 72.6 billion yuan (US$10.3 billion) during the financial year ended March 31, due in part to the contraction of its supply chain business and store closures.
This article originally appeared in the South China Morning Post (SCMP), the most authoritative voice reporting on China and Asia for more than a century. For more SCMP stories, please explore the SCMP app or visit the SCMP’s Facebook and Twitter pages. Copyright © 2024 South China Morning Post Publishers Ltd. All rights reserved.
Copyright (c) 2024. South China Morning Post Publishers Ltd. All rights reserved.
SolarBank Announces Fiscal Year End Results
217% increase in revenues to $58.4 million of revenue for the fiscal year 2024 compared to $18.4 million in fiscal year 2023
This news release constitutes a “designated news release” for the purposes of the Company’s prospectus supplement dated May 23, 2024 to its short form base shelf prospectus dated May 2, 2023
TORONTO, Sept. 30, 2024 /PRNewswire/ – SolarBank Corporation SUUN (Cboe CA: SUNN) GY (“SolarBank” or the “Company”) today reported results for the fiscal year ended June 30, 2024. All financial figures are in Canadian dollars and in accordance with International Financial Reporting Standards (“IFRS“) as presented in the interim consolidated financial statements.
Fiscal Year Highlights (All Amounts are for the Twelve Month Period ended June 30, 2024)
- 217% increase in revenue to $58.4 million of revenue compared to $18.4 million in 2023;
- 255% increase in cash flow from operating activities to $8.5 million compared to $2.4 million in 2023;
- Adjusted EBITDA(1) of $0.5 million compared to $(2.5) million for 2023;
- Net loss of $3.6 million, or ($0.13) per basic share, compared to net income of $2.2 million, or $0.11 per basic share in in 2023. The net loss includes major items below:
- Expense of $4.1 million for investor relations activities principally associated with the Cboe Canada Exchange and Nasdaq Global Market listing completed during the year;
- Expense of $0.7 million listing fees associated with the Cboe Canada Exchange and Nasdaq Global Market listing completed during the year, which is non-recurring;
- Expense of $1.9 million in professional fees that were higher due to M&A transactions, in particular the acquisition of Solar Flow-Through Funds Ltd. that closed shortly after year-end; and
- Impairment loss of $4.1 million related to acquisition and investment the company closed during the year, which is non-recurring; and
- The Company qualified for listing and commenced trading on the Nasdaq Global Market under the symbol “SUUN”.
“We reported a year of significant growth for SolarBank in fiscal 2024, starting with a tripling of revenues over the prior fiscal year,” stated Dr. Richard Lu, SolarBank Corporation Chief Executive Officer. “While the Company was not profitable at year-end, there were certain expenses that were at levels that are higher than usual and the non-recurring impairment loss. With the closing of the acquisition of Solar Flow-Through Funds Ltd., valued at $45 million, the Company has significantly expanded its IPP portfolio and it has several projects under development to continue its growth plans.”
“With a current operational capacity of 32 MWdc and a development pipeline of approximately 1 GW, including 100 MWdc in the advanced development stage expected to begin construction by 2025/2026, the Company is well-positioned to capitalize on the accelerating global energy transition,” concluded Dr. Lu
(1)EBITDA and Adjusted EBITDA are non-IFRS financial measures with no standardized meaning under IFRS, and therefore they may not be comparable to similar measures presented by other issuers. For further information and detailed reconciliations of Non-IFRS financial measures to the most directly comparable IFRS measures see “Non-IFRS Financial Measures” in this News Release.
Fourth Quarter Operational Highlights
During the quarter ended June 30, 2024, the Company achieved the following business objectives:
- The Company reached mechanical completion on the SB-1, SB-2 and SB-3 Community Solar Projects acquired by Honeywell International Inc. (“Honeywell”). The projects are being constructed under an EPC Contract with SolarBank. SolarBank also expects that it will retain an operations and maintenance contract for the projects following the completion of construction.
- Construction commenced on a 1.4 MW DC rooftop solar project in Alberta as a pilot project. This project received interconnection approval in December 2023, full permitting in March 2024, and is currently undergoing the process of engineering and final design. Construction is expected to be completed in the second fiscal quarter of FY2025.
- The Company partnered with TriMac Engineering of Sydney, Nova Scotia to develop a 10 MW DC community solar garden in the rural community of Enon, Nova Scotia, and three 7 MW DC projects in Sydney, Halifax and Annapolis, Nova Scotia respectively (the “NS Projects”). The NS Projects are being developed under a Community Solar Program that was announced by the Government of Nova Scotia on March 1, 2024 and owned by AI Renewable Fund.
- The Company announced that it intends to develop a 6.41 MW DC ground-mount solar power project know as the Rice Road project on a site located in Bloomfield, New York.
- The Company entered into a loan agreement with Seminole Financial Services, LLC for an initial US$2,600,000 construction to mini-perm loan that will be used to complete construction of the Geddes Project located in Upstate, New York.
Post Year-End Updates
Subsequent to June 30, 2024, the Company achieved the following business objectives:
- The Company closed its acquisition of Solar Flow-Through Funds Ltd. (“SFF”). This transaction values SFF at up to $45M but the consideration payable excludes the common shares of SFF currently held by the Company.
- Provided an update on its 3.25 MW DC ground-mount solar power project located in the Town of Camillus, New York on a closed landfill. The project has now received its plan approval and special use permit from the town of Camillus.
- The Company advanced construction on the 1.4MW DC rooftop solar project in Alberta. Construction of the project is expected to be completed in November 2024.
- The Company announced that it intends to develop a 7 MW DC ground-mount solar power project known as the Oak Orchard project located in Clay, New York.
- The Company announced that it intends to develop a 5.4 MW DC ground-mount solar power project known as the Boyle project located in Broome County, New York. The project is expected to employ agrivoltaics (the dual use of land for solar energy production and agriculture) including sheep grazing with a local agricultural partner.
- The Company announced that it intends to develop a 7 MW DC ground-mount solar power project known as the Hwy 28 project on a 45 acre site located in Middletown, New York.
- The Company submitted $1.5 million in grant applications for three fast electric vehicle (EV) charger projects located in Ontario, Canada. The actual amount of grant funding provided is subject to the final approval and discretion of the applicable government agencies.
Summary of Annual Results (All Amounts are for the Twelve Month Period)
|
Year Ended |
June 30, 2024 |
June 30, 2023 |
|
Statement of Income and Comprehensive Income |
||
|
Total Revenue |
$ 58,377,133 |
$ 18,397,509 |
|
Cash flow from operating activities |
$ 8,484,998 |
$ 2,390,915 |
|
Net income (loss) |
$ (3,577,144) |
$ 2,241,986 |
|
Adjusted EBITDA(1) |
$ 485,410 |
$ (2,525,423) |
|
Basic earnings (loss) per share |
$ (0.13) |
$ 0.11 |
|
Diluted earnings (loss) per share |
$ (0.13) |
$ 0.06 |
(1) EBITDA and Adjusted EBITDA are non-IFRS financial measures with no standardized meaning under IFRS, and therefore they may not be comparable to similar measures presented by other issuers. For further information and detailed reconciliations of Non-IFRS financial measures to the most directly comparable IFRS measures see “Non-IFRS Financial Measures” in this News Release.
The Company ended the 2024 fiscal year with $39.2 million in total assets, an increase of $14.3 million compared to year end June 30, 2023. The increase is mainly due to an increase of cash, inventory and prepaid expenses, PPE, development asset, intangible assets and investment, offset by decreased unbilled revenue, receivables and short-term investment.
Current liabilities increased from $7.1 million as of year ended June 30, 2023 to $13.4 million as of June 30, 2024, mainly due to an increase in unearned revenue, loan payables and tax payable.
For complete details please refer to the audited consolidated financial statements and associated Management Discussion and Analysis for the year ended June 30, 2024, available on SEDAR+ (www.sedarplus.ca).
The Company notes that the execution of the Company’s growth strategy depends upon the continued availability of third-party financing arrangements for the Company and its customers and the Company’s future success depends partly on its ability to expand the pipeline of its energy business in several key markets. In addition, governments may revise, reduce or eliminate incentives and policy support schemes for solar and battery storage power, which could cause demand for the Company’s services to decline. Further the forecasted MW capacity of a solar project may not be reached. Please refer to “Forward-Looking Statements” for additional discussion of the assumptions and risk factors associated with the statements in this press release.
Conference Call September 30, 2024 at 4:00PM ET
The Company will review financial results and provide a business update. Interested parties can register for the webinar using the information below:
After registering, you will receive a confirmation email containing information about joining the webinar.
Non-IFRS Financial Measures
The Company has disclosed certain non-IFRS financial measures and ratios in this press, as discussed below. These non-IFRS financial measures and non-IFRS ratios are widely reported in the renewable energy industry as benchmarks for performance and are used by management to monitor and evaluate the Company’s operating performance and ability to generate cash. The Company believes that, in addition to financial measures and ratios prepared in accordance with IFRS, certain investors use these non-IFRS financial measures and ratios to evaluate the Company’s performance. However, the measures do not have a standardized meaning under IFRS and may not be comparable to similar financial measures disclosed by other companies. Accordingly, non-IFRS financial measures and non-IFRS ratios should not be considered in isolation or as a substitute for measures and ratios of the Company’s performance prepared in accordance with IFRS.
Non-IFRS financial measures are defined in National Instrument 52-112 – Non-GAAP and Other Financial Measures Disclosure (“NI 52-112“) as a financial measure disclosed that (a) depicts the historical or expected future financial performance, financial position or cash flow of an entity, (b) with respect to its composition, excludes an amount that is included in, or includes an amount that is excluded from, the composition of the most directly comparable financial measure disclosed in the primary financial statements of the entity, (c) is not disclosed in the financial statements of the entity, and (d) is not a ration, fraction, percentage or similar representation.
A non-IFRS ratio is defined by NI 52-112 as a financial measure disclosed that (a) is in the form of a ratio, fraction, percentage, or similar representation, (b) has a non-IFRS financial measure as one or more of its components, and (c) is not disclosed in the financial statements.
Adjusted EBITDA
Adjusted EBITDA is a non-IFRS financial measure, which excludes the following from net earnings:
- Income tax expense;
- Finance costs;
- Amortization and depreciation.
- Non-operating income or expenses;
- Non-recurring gains or losses;
- Impairment charges or reversals;
- Listing fees or costs related to equity offerings;
- Foreign exchange gains or losses
Management believes Adjusted EBITDA is a valuable indicator of the Company’s ability to generate liquidity by producing operating cash flow to fund working capital needs, service debt obligations, and fund capital expenditures. Management uses Adjusted EBITDA for this purpose. EBITDA is also frequently used by investors and analysts for valuation purposes whereby Adjusted EBITDA is multiplied by a factor or “EBITDA multiple” based on an observed or inferred relationship between Adjusted EBITDA and market values to determine the approximate total enterprise value of a Company. Management also believes that Adjusted EBITDA provides useful information to investors and others in understanding and evaluating our operating results because it is consistent with the indicators management uses internally to measure the Company’s performance and is an indicator of the performance of the Company’s renewable energy project development and operations.
Adjusted EBITDA is intended to provide additional information to investors and analysts. It does not have any standardized definition under IFRS and should not be considered in isolation or as a substitute for measures of operating performance prepared in accordance with IFRS. Adjusted EBITDA excludes the impact of cash costs of financing activities and taxes, and the effects of changes in operating working capital balances, and therefore is not necessarily indicative of operating profit or cash flow from operations as determined by IFRS. Other companies may calculate Adjusted EBITDA differently.
|
As at |
June 30, 2024 |
June 30, 2023 |
|
|
$ |
$ |
||
|
Net income (loss) per financial statements |
(3,577,144) |
2,241,986 |
|
|
Add: |
|||
|
Depreciation expense |
78,937 |
49,209 |
|
|
Interest (income)/expense, net |
(35,967) |
(3,155) |
|
|
Income tax and Deferred income tax expense |
2,946,160 |
951,174 |
|
|
Listing Fee |
724,080 |
101,505 |
|
|
Impairment expense |
4,100,270 |
724,205 |
|
|
Fair value change (gain)/loss |
1,261,892 |
– |
|
|
Other (income)/expense |
(5,012,818) |
(6,590,347) |
|
|
Adjusted EBITDA |
485,410 |
(2,525,423) |
About SolarBank Corporation
SolarBank Corporation is an independent renewable and clean energy project developer and owner focusing on distributed and community solar projects in Canada and the USA. The Company develops solar, Battery Energy Storage System (BESS) and EV Charging projects that sell electricity to utilities, commercial, industrial, municipal and residential off-takers. The Company maximizes returns via a diverse portfolio of projects across multiple leading North America markets including projects with utilities, host off-takers, community solar, and virtual net metering projects. The Company has a potential development pipeline of over one gigawatt and has developed renewable and clean energy projects with a combined capacity of over 100 megawatts built. To learn more about SolarBank, please visit www.solarbankcorp.com.
FORWARD-LOOKING STATEMENTS
This press release contains forward-looking statements and forward-looking information within the meaning of Canadian securities legislation (collectively, “forward-looking statements”) that relate to the Company’s current expectations and views of future events. Any statements that express, or involve discussions as to, expectations, beliefs, plans, objectives, assumptions or future events or performance (often, but not always, through the use of words or phrases such as “will likely result”, “are expected to”, “expects”, “will continue”, “is anticipated”, “anticipates”, “believes”, “estimated”, “intends”, “plans”, “forecast”, ”projection”, “strategy”, “objective” and “outlook”) are not historical facts and may be forward-looking statements and may involve estimates, assumptions and uncertainties which could cause actual results or outcomes to differ materially from those expressed in such forward-looking statements. In particular and without limitation, this press release contains forward-looking statements pertaining to the Company’s expectations regarding its industry trends and overall market growth; the Company’s growth strategies; the expected energy production from the solar power project mentioned in this press release; the megawatt capacity and type of future solar projects; and the size of the Company’s development pipeline. No assurance can be given that these expectations will prove to be correct and such forward-looking statements included in this press release should not be unduly relied upon. These statements speak only as of the date of this press release.
Forward-looking statements are based on certain assumptions and analyses made by the Company in light of the experience and perception of historical trends, current conditions and expected future developments and other factors it believes are appropriate, and are subject to risks and uncertainties. In making the forward looking statements included in this press release, the Company has made various material assumptions, including but not limited to: obtaining the necessary regulatory approvals; that regulatory requirements will be maintained; general business and economic conditions; the Company’s ability to successfully execute its plans and intentions; the availability of financing on reasonable terms; the Company’s ability to attract and retain skilled staff; market competition; the products and services offered by the Company’s competitors; that the Company’s current good relationships with its service providers and other third parties will be maintained; and government subsidies and funding for renewable energy will continue as currently contemplated. Although the Company believes that the assumptions underlying these statements are reasonable, they may prove to be incorrect, and the Company cannot assure that actual results will be consistent with these forward-looking statements. Given these risks, uncertainties and assumptions, investors should not place undue reliance on these forward-looking statements.
Whether actual results, performance or achievements will conform to the Company’s expectations and predictions is subject to a number of known and unknown risks, uncertainties, assumptions and other factors, including those listed under “Forward-Looking Statements” and “Risk Factors” in the Company’s Annual Information Form, and other public filings of the Company, which include: the Company may be adversely affected by volatile solar power market and industry conditions; the execution of the Company’s growth strategy depends upon the continued availability of third-party financing arrangements; the Company’s future success depends partly on its ability to expand the pipeline of its energy business in several key markets; governments may revise, reduce or eliminate incentives and policy support schemes for solar and battery storage power; general global economic conditions may have an adverse impact on our operating performance and results of operations; the Company’s project development and construction activities may not be successful; developing and operating solar projects exposes the Company to various risks; the Company faces a number of risks involving Power Purchase Agreements (“PPAs”) and project-level financing arrangements; any changes to the laws, regulations and policies that the Company is subject to may present technical, regulatory and economic barriers to the purchase and use of solar power; the markets in which the Company competes are highly competitive and evolving quickly; an anti-circumvention investigation could adversely affect the Company by potentially raising the prices of key supplies for the construction of solar power projects; foreign exchange rate fluctuations; a change in the Company’s effective tax rate can have a significant adverse impact on its business; seasonal variations in demand linked to construction cycles and weather conditions may influence the Company’s results of operations; the Company may be unable to generate sufficient cash flows or have access to external financing; the Company may incur substantial additional indebtedness in the future; the Company is subject to risks from supply chain issues; risks related to inflation; unexpected warranty expenses that may not be adequately covered by the Company’s insurance policies; if the Company is unable to attract and retain key personnel, it may not be able to compete effectively in the renewable energy market; there are a limited number of purchasers of utility-scale quantities of electricity; compliance with environmental laws and regulations can be expensive; corporate responsibility may adversely impose additional costs; the future impact of any resurgence of COVID-19 on the Company is unknown at this time; the Company has limited insurance coverage; the Company will be reliant on information technology systems and may be subject to damaging cyberattacks; the Company may become subject to litigation; there is no guarantee on how the Company will use its available funds; the Company will continue to sell securities for cash to fund operations, capital expansion, mergers and acquisitions that will dilute the current shareholders; and future dilution as a result of financings. In addition, there are difficulties in forecasting the Company’s financial results and performance for future periods, particularly over longer periods, given changes in technology and the Company’s business strategy, evolving industry standards, intense competition and government regulation that characterize the industries in which the Company operates.
The Company undertakes no obligation to update or revise any forward-looking statements, whether as a result of new information, future events or otherwise, except as may be required by law. New factors emerge from time to time, and it is not possible for the Company to predict all of them, or assess the impact of each such factor or the extent to which any factor, or combination of factors, may cause results to differ materially from those contained in any forward-looking statement. Any forward-looking statements contained in this press release are expressly qualified in their entirety by this cautionary statement.
![]() View original content to download multimedia:https://www.prnewswire.com/news-releases/solarbank-announces-fiscal-year-end-results-302263097.html
View original content to download multimedia:https://www.prnewswire.com/news-releases/solarbank-announces-fiscal-year-end-results-302263097.html
SOURCE SolarBank Corporation
© 2024 Benzinga.com. Benzinga does not provide investment advice. All rights reserved.
European Stock Gains May Falter On Geopolitical, Economic Fears
Gains in European equities may falter on geopolitical and economic fears after receiving a boost from China’s stimulus plans and slowing inflation.
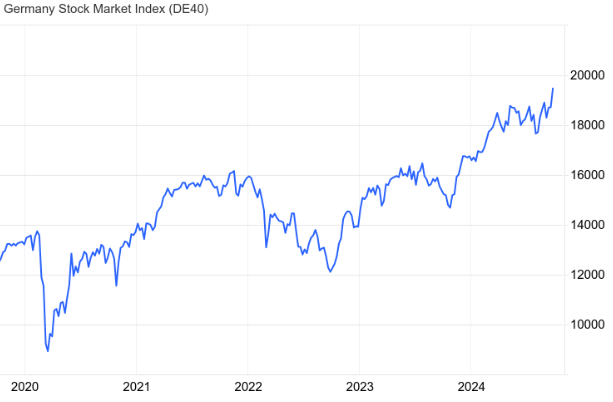
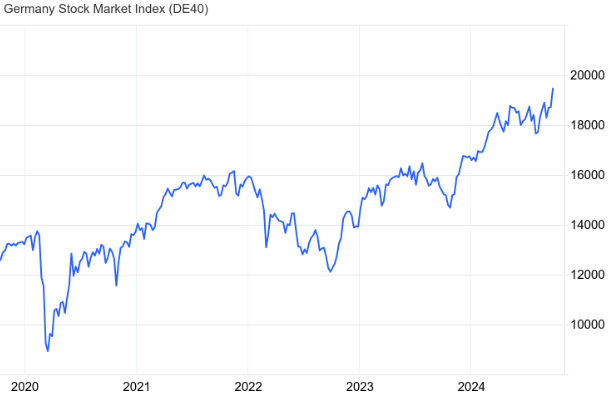
The Euro Area Stoxx 600 gained 2.69% in the week ending September 27 to a record, extending its year-to-date climb to 10.1%. Germany’s DAX40 closed the week at a record level, gaining 4% after increasing 1.22% on Friday.
Source: TradingEconomics
Slow economic growth, volatile natural gas prices, and inflation have hurt European economic sentiment. GDP is projected to end 2024 at 0.8%.
Geopolitical developments, including the war in Ukraine and the upcoming U.S. elections, have curbed European stock optimism. European policymakers have expressed concerns about issues from climate change, security and trade if Trump wins a second term.
Fears about a wider Middle East war escalated after Israel killed Hezbollah’s leader Hassan Nasrallah in airstrikes Friday in Beirut.
The EU “is extremely concerned” about the confrontation between Israel and Hezbollah,” Josep Borrell, EU’s High Representative for Foreign Affairs and Security Policy, said.
“Any further escalation would have dramatic consequences for the region and beyond.”
European Investors Welcome China’s ‘Stimulus Blitz
Despite the ongoing headwinds, investors welcomed the People’s Bank of China (PBOC) “stimulus blitz” to tackle the country’s economic headwinds.
China announced “a series of bold moves aimed at stabilizing both the economy and the stock market,” Charu Chanana, Head of FX Strategy at Saxo, wrote on September 25.
The package included a 50-basis-point cut to banks’ required reserve ratios (RRR) and a 20-basis-point cut to the seven-day reverse repurchase rate.
The PBOC announced a 500 billion yuan ($71.3 billion) liquidity support for stock buybacks.
European Fashion, Automobile Stocks See Most Gains
Although European equities rose immediately on the PBOC news, fashion and automobile stocks climbed the most.
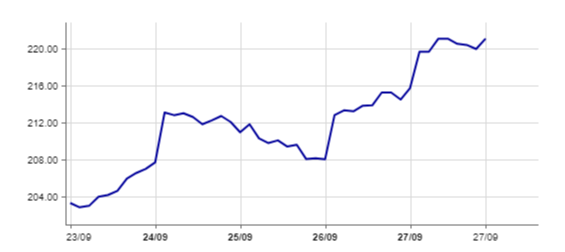
France’s LVMH LVMHF jumped 19.2% ,and Hermes HESAY rose 16.5% for the week.
German automobile makers also clocked gains. Volkswagen VWAGY rose by 7%, Mercedes-Benz Group MBGAF by 6.55 and BMW BMWYY by 6.6%.
Germany’s automobile index rose 8.70% for the week.
Source: Boerse-Frankfurt
European companies operating in China have worried that the slowdown in the world’s second-largest economy may hurt profitability.
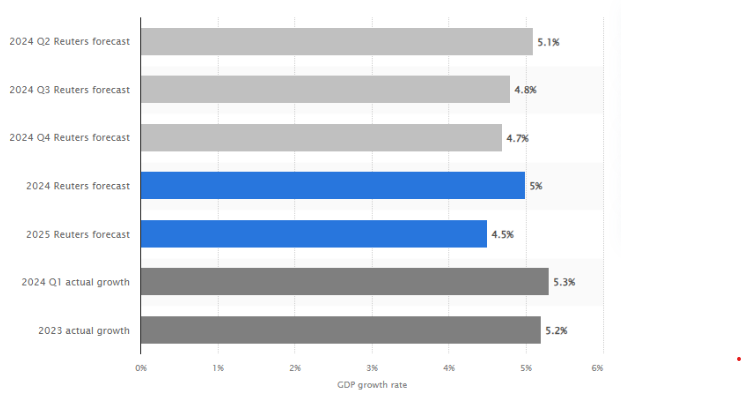
The Chinese economy grew 4.7% in the second quarter from April to June. This is the slowest pace since the first quarter of 2023 and below forecasts of 5% to 5.3%.
Source: Statista
The stimulus package “can help to repair some of the confidence levels in the economy and policymakers,” Chanana wrote.
European Equities Helped by Inflation Data
European equities received an added boost this week from inflation data.
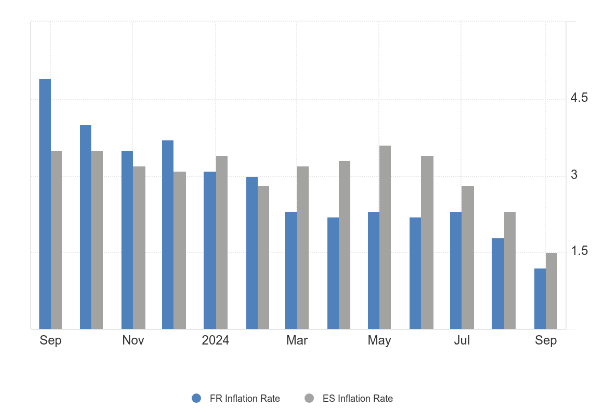
German preliminary data showed inflation slowing to1.6% in September, compared to 1.9% in August, the country’s Federal Statistical Office said on Monday. France and Spain reported on September 27 that inflation slowed below 2%, beating analysts expectations.
Investors now give the European Central Bank (ECB) a 70% chance of cutting rates next month.
Source: Tradingeconomics
Although the latest economic data has buoyed confidence, some investors have expressed caution.
Data is “looking quite shaky,” Anwiti Bahuguna, Northern Trust Asset Management’s chief investment officer of global allocation, told Bloomberg TV.
“Inflation is coming down, but not fast enough to think there would be very sharp relief on the rates front.”
European Consumer Sentiment Improves
Despite these concerns, European consumer sentiment has started to improve. It rose 0.5 points in the Euro Area in September to -12.9, which was in line with preliminary estimates.
“Consumers were markedly more optimistic about their households’ expected financial situation,” the European Commission said on September 27.
In Germany, France and Italy, Europe’s three largest economies, consumer confidence rose moderately, according to monthly surveys.
However, the Nuremberg Institute for Market Decisions (NIM) warned on September 26 that it was too early to conclude German consumer confidence had improved.
The improvement in Germany “can be interpreted more as a stabilization at a low level,” Rolf Bürkl, an expert at NIM, said.
“The slight increase cannot be interpreted as the beginning of a noticeable recovery.”
Disclaimer:
Any opinions expressed in this article are not to be considered investment advice and are solely those of the authors. European Capital Insights is not responsible for any financial decisions made based on the contents of this article. Readers may use this article for information and educational purposes only.
This article is from an unpaid external contributor. It does not represent Benzinga’s reporting and has not been edited for content or accuracy.
© 2024 Benzinga.com. Benzinga does not provide investment advice. All rights reserved.
ZK International Group Co., Ltd. Announces Record Revenue of $52.89 Million, an Increase of 6.5% for the First Half of Fiscal Year 2024
WENZHOU, China, Sept. 30, 2024 /PRNewswire/ — ZK International Group Co., Ltd. (ZKIN) (“ZK International” or the “Company”), a designer, engineer, manufacturer, and supplier of patented high-performance stainless steel and carbon steel pipe products primarily used for water and gas supplies, today announced its unaudited financial results for the six months ended March 31, 2024.
Financial Highlights for the First Half of Fiscal Year 2024
|
For the Six Months Ended March 31, |
|||||||||||
|
($ millions, except per share data) |
2024 |
2023 |
% Change |
||||||||
|
Revenue |
$ |
52.89 |
$ |
49.66 |
6.50 % |
||||||
|
Gross profit |
$ |
3.35 |
$ |
3.17 |
5.68 % |
||||||
|
Gross margin |
6.33 % |
6.38 % |
-0.05% pp* |
||||||||
|
Income (loss) from operations |
$ |
(0.16) |
$ |
0.14 |
(2.14) % |
||||||
|
Operating margin |
(0.31) % |
0.29 % |
0.60% pp* |
||||||||
|
Net loss |
$ |
(0.48) |
$ |
(0.06) |
– |
||||||
|
Diluted earnings per share |
$ |
(0.01) |
$ |
0.00 |
– |
||||||
|
* pp: percentage point(s) |
|||||||||||
- Revenue increased 6.50% to a record 52.89 million for the six months ended March 31, 2024 from approximately $49.66 million for the six months ended March 31, 2023. During the first fiscal half of 2024, we observed an increase of demand for our piping products, primarily attributable to the real estate market recovery during the fiscal period. Raw materials price, especially the price of nikel which is an important component of stainless steel, also increased. To minimize the impact the rise of raw material price, we increased our weighted average selling price (“ASP”) during the period.
- Gross profit increased by 5.68% to $3.35 million. Gross margin was 6.33%, compared to 6.38% for the same period of the prior fiscal period. The rising costs of raw materials, particularly for stainless steel coil which is a key component of our products, has ourpaced the increase of our ASP which led to a slight decline in gross margin.
- Loss from operations was $0.16 million, compared to income from operations of $0.14 million for the same period of the prior fiscal year. Operating margin was -0.31%, compared to 0.29% for the same period of the prior fiscal year.
- Net loss was $0.48 million. This compared to a net loss of $0.06 million for the same period of the prior fiscal year.
Financial Results for the First Half of Fiscal Year 2023
Revenue
Revenue increased by $3,231,757 or 6.50%, to $52,887,156 for the six months ended March 31, 2024 from $49,655,399 for the six months ended March 31, 2023. During the first fiscal half of 2024, we observed an increase of demand for our piping products, primarily attributable to the real estate market recovery during the fiscal period. Raw materials price, especially the price of nikel which is an important component of stainless steel, also increased. To minimize the impact the rise of raw material price, we increased our weighted average selling price (“ASP”) during the period.
Gross Profit
Our gross profit increased by 181,368, or 5.68%, to $3,350,010 for the six months ended March 31, 2024 from $3,168,642 for the six months ended March 31, 2023. Gross profit margin was 6.33% for the six months ended March 31, 2024, as compared to 6.38% for the six months ended March 31, 2023. The increase of our gross profit was mainly attributable to the recovery of domestic real estate market, however the rising costs of raw materials, particularly for stainless steel coil which is a key component of our products, has outpaced the increase of our ASP which led to a slight decline in gross margin.
Selling and Marketing Expenses
We incurred $880,824 in selling and marketing expenses for the six months ended March 31, 2024, compared to $ 963,655 for the six months ended March 31, 20223. Selling and marketing expenses decreased by $82,831, or 8.60%, during the six months ended March 31, 2024 compared to the six months ended March 31, 2023. This slight decrease is primarily due to decreased marketing expenses.
General and Administrative expenses
We incurred $ 2,010,566 in general and administrative expenses for the six months ended March 31, 2024, compared to $1,443,743 for the six months ended March 31, 2023. General and administrative expenses increased by $566,823 or 39.26%, for the six months ended March 31, 2024 compared to the same period in 2023. The increase is primarily due to increase in consulting expenses and employee salaries.
Research and Development Expenses
We incurred $622,805 in research and development expenses for the six months ended March 31, 2024, compared to $619,511 for the six months ended March 31, 2023. R&D expenses increased by $3294, or 0.53%, for the six months ended March 31, 2024 compared to the same period in 2023.
Income (loss) from Operations
As a result of the factors described above, we incurred operating loss of $164,185 for the six months ended March 31, 2024, compared to operating income of $141,734 for the six months ended March 31, 2023, a decrease of operating income of $305,919.
Other Income (Expenses)
Our interest income and expenses were $7,868 and $411,045, respectively, for the six months ended March 31, 2024, compared to interest income and expenses of $25,123 and $386,527, respectively, for the six months ended March 31, 2023.
Net Income (loss)
As a result of the factors described above, we incurred net loss of $481,753 for the six months ended March 31, 2024, compared to net income of $57,080 for the six months ended March 31, 2023, a decrease in profit of $424,673
Financial Condition
As of March 31, 2024, cash and cash equivalents, restricted cash and short-term investments totaled $5.06 million, compared to $5.05 million as of September 30, 2023. Short-term bank borrowings were $13.34 million as of March 31, 2024, compared to $9.39 million as of September 30, 2023.
Accounts receivable was $20.56 million as of March 31, 2024, compared to $14.97 million as of September 30, 2023. Inventories were $13.39 million as of March 31, 2024, compared to $17.94 million as of September 30, 2023. Accounts payable was $2.18 million as of March 31, 2024, compared to $2.61 million as of September 30, 2023.
Total current assets and current liabilities were $62.05 million and $40.03 million, respectively, leading to a current ratio of 1.55 as of March 31, 2024. This compared to total current assets and current liabilities were $43.25 million and $24.89 million, respectively, and current ratio of 1.74 as of September 30, 2023.
About ZK International Group Co., Ltd.
ZK International Group Co., Ltd. is a China-based designer, engineer, manufacturer, and supplier of patented high-performance stainless steel and carbon steel pipe products that require sophisticated water or gas pipeline systems. The Company owns 33 patents, 21 trademarks, 2 Technical Achievement Awards, and 10 National and Industry Standard Awards. ZK International is Quality Management System Certified (ISO9001), Environmental Management System Certified (ISO1401), and a National Industrial Stainless Steel Production Licensee that is focused on supplying steel piping for the multi-billion dollar industries of Gas and Water sectors. ZK has supplied stainless steel pipelines for over 2,000 projects, including the Beijing National Airport, the “Water Cube”, and “Bird’s Nest”, which were venues for the 2008 Beijing Olympics. Emphasizing superior properties and durability of its steel piping, ZK International is providing a solution for the delivery of high quality, highly sustainable, environmentally sound drinkable water not only to the China market but also to international markets such as Europe, East Asia, and Southeast Asia.
For more information please visit www.ZKInternationalGroup.com. Additionally, please follow the Company on Twitter, Facebook, YouTube, and Weibo. For further information on the Company’s SEC filings please visit www.sec.gov.
Safe Harbor Statement
This news release contains forward-looking statements within the meaning of Section 27A of the Securities Act of 1933, as amended, and Section 21E of the Securities Exchange Act of 1934, as amended, and as defined in the U.S. Private Securities Litigation Reform Act of 1995. Without limiting the generality of the foregoing, words such as “may,” “will,” “expect,” “believe,” “anticipate,” “intend,” “could,” “estimate” or “continue” or the negative or other variations thereof or comparable terminology are intended to identify forward-looking statements. In addition, any statements that refer to expectations, projections or other characterizations of future events or circumstances are forward-looking statements. These forward-looking statements are not guarantee of future performance and are subject to certain risks, uncertainties, and assumptions that are difficult to predict and many of which are beyond the control of ZK International. Actual results may differ from those projected in the forward-looking statements due to risks and uncertainties, as well as other risk factors that are included in the Company’s filings with the U.S. Securities and Exchange Commission. Although ZK International believes that the assumptions underlying the forward-looking statements are reasonable, any of the assumptions could prove inaccurate and, therefore, there can be no assurance that the results contemplated in forward-looking statements will be realized. In light of the significant uncertainties inherent in the forward-looking information included herein, the inclusion of such information should not be regarded as a representation by ZK International or any other person that their objectives or plans will be achieved. ZK International does not undertake any obligation to revise the forward-looking statements contained herein to reflect events or circumstances after the date hereof or to reflect the occurrence of unanticipated events.
|
ZK International Group Co., Ltd. and Subsidiaries |
||||||||
|
Consolidated Statements of Income and Comprehensive Income (Loss) |
||||||||
|
For the Six Months Ended March 31, 2024 and 2023 (Unaudited) |
||||||||
|
(IN U.S. DOLLARS, EXCEPT SHARE DATA) |
||||||||
|
For the Six Months Ended |
||||||||
|
2024 |
2023 |
|||||||
|
Revenues |
52,887,156 |
$ |
49,655,399 |
|||||
|
Cost of sales |
49,537,146 |
46,486,756 |
||||||
|
Gross profit |
3,350,010 |
3,168,642 |
||||||
|
Operating expenses: |
||||||||
|
Selling and marketing expenses |
880,824 |
963,655 |
||||||
|
General and administrative expenses |
2,010,566 |
1,443,743 |
||||||
|
Research and development costs |
622,805 |
619,511 |
||||||
|
Total operating expenses |
3,514,195 |
3,026,909 |
||||||
|
Operating Income |
164,185 |
141,734 |
||||||
|
Other income (expenses): |
||||||||
|
Interest expenses |
(411,045) |
(386,527) |
||||||
|
Interest income |
7,868 |
25,123 |
||||||
|
Other income (expenses), net |
92,816 |
162,590 |
||||||
|
Total other income (expenses), net |
(310,361) |
(198,814) |
||||||
|
Income (Loss) before income taxes |
(474,546) |
(57,080) |
||||||
|
Income tax provision |
– |
– |
||||||
|
Net income (loss) |
(481,753) |
$ |
(57,080) |
|||||
|
Net income (loss) attributable to non-controlling interests |
1,663 |
|||||||
|
Net income (loss) attributable to ZK International Group Co., Ltd. |
(481,753) |
$ |
(55,417) |
|||||
|
Net income (loss) |
(481,753) |
$ |
(57,080) |
|||||
|
Other comprehensive income: |
||||||||
|
Foreign currency translation adjustment |
(1,912,369) |
|||||||
|
Total comprehensive income (loss) |
(481,753) |
(1,969,449) |
||||||
|
Comprehensive income (loss) attributable to non-controlling interests |
(9,284) |
(10,076) |
||||||
|
Comprehensive income attributable to ZK International Group Co., Ltd. |
(472,468) |
(1,979,525) |
||||||
|
Basic and diluted earnings per share |
||||||||
|
Basic |
– |
– |
||||||
|
Diluted |
– |
– |
||||||
|
Weighted average number of shares outstanding |
||||||||
|
Basic |
31,445,962 |
30,392,940 |
||||||
|
Diluted |
31,445,962 |
30,518,893 |
||||||
|
ZK International Group Co., Ltd. and Subsidiaries |
||||||||
|
Consolidated Balance Sheets |
||||||||
|
As of March 31, 2024 and September 30, 2023 (Unaudited) |
||||||||
|
(IN U.S. DOLLARS) |
||||||||
|
2024 (Unaudited) |
2023 |
|||||||
|
Assets |
||||||||
|
Current assets |
||||||||
|
Cash and cash equivalents |
$ |
4,945,913 |
$ |
4,994,411 |
||||
|
Restricted cash |
65,379 |
50,995 |
||||||
|
Short-term Investment |
48,650 |
48,145 |
||||||
|
Accounts receivable, net of allowance for doubtful accounts of $6,686,864 and |
20,556,288 |
14,967,186 |
||||||
|
Notes receivable |
269,424 |
54,825 |
||||||
|
Other receivables |
6,022,949 |
383,413 |
||||||
|
Due from related parties |
1,532,776 |
– |
||||||
|
Inventories |
13,390,249 |
17,937,425 |
||||||
|
Advance to suppliers |
15,216,014 |
4,810,044 |
||||||
|
Total current assets |
62,047,642 |
43,246,444 |
||||||
|
Property, plant and equipment, net |
7,822,460 |
7,836,017 |
||||||
|
Right-of use asset |
18,573 |
43,840 |
||||||
|
Intangible assets, net |
1,446,461 |
1,437,384 |
||||||
|
Long-term accounts receivable |
5,585,636 |
5,527,682 |
||||||
|
Long-term investment |
302,760 |
285,540 |
||||||
|
TOTAL ASSETS |
$ |
77,223,532 |
$ |
58,668,977 |
||||
|
LIABILITIES AND SHAREHOLDERS’ EQUITY |
||||||||
|
Current liabilities: |
||||||||
|
Accounts payable |
$ |
2,178,436 |
$ |
2,611,220 |
||||
|
Accrued expenses and other current liabilities |
1,634,393 |
4,964,892 |
||||||
|
Lease liability – current portion |
21,977 |
21,749 |
||||||
|
Accrued payroll and welfare |
1,867,631 |
1,918,415 |
||||||
|
Advance from customers |
16,847,355 |
821,694 |
||||||
|
Due to related parties |
128,903 |
1,111,001 |
||||||
|
Convertible debentures |
4,011,224 |
4,011,224 |
||||||
|
Short-term bank borrowings |
13,336,426 |
9,388,706 |
||||||
|
Notes payables |
– |
41,118 |
||||||
|
Income tax payable |
– |
669 |
||||||
|
Total current liabilities |
40,026,345 |
24,890,689 |
||||||
|
Bank borrowings – non-current |
8,617,093 |
8,527,686 |
||||||
|
Lease liability – long term portion |
11,935 |
11,811 |
||||||
|
TOTAL LIABILITIES |
$ |
48,655,373 |
$ |
33,430,186 |
||||
|
Equity |
||||||||
|
Common stock, no par value, 50,000,000 shares |
||||||||
|
Additional paid-in capital |
76,386,898 |
72,886,898 |
||||||
|
Statutory surplus reserve |
3,176,556 |
3,176,556 |
||||||
|
Subscription receivable |
(125,000) |
(125,000) |
||||||
|
Retained earnings |
(48,140,252) |
(47,666,657) |
||||||
|
Accumulated other comprehensive income (loss) |
(2,878,739) |
(3,190,985) |
||||||
|
Total equity attributable to ZK International Group Co., Ltd. |
28,419,463 |
25,080,812 |
||||||
|
Equity attributable to non-controlling interests |
148,696 |
157,980 |
||||||
|
Total equity |
28,568,159 |
25,238,792 |
||||||
|
TOTAL LIABILITIES AND EQUITY |
$ |
77,223,532 |
$ |
58,668,977 |
||||
![]() View original content to download multimedia:https://www.prnewswire.com/news-releases/zk-international-group-co-ltd-announces-record-revenue-of-52-89-million-an-increase-of-6-5-for-the-first-half-of-fiscal-year-2024–302263010.html
View original content to download multimedia:https://www.prnewswire.com/news-releases/zk-international-group-co-ltd-announces-record-revenue-of-52-89-million-an-increase-of-6-5-for-the-first-half-of-fiscal-year-2024–302263010.html
SOURCE ZK International Group Co., Ltd.
© 2024 Benzinga.com. Benzinga does not provide investment advice. All rights reserved.


