Palatin Reports Fourth Quarter and Fiscal Year Ended 2024 Financial Results, Provides Update on Clinical Programs, Strategic Priorities, and Anticipated Milestones
- Obesity: Phase 2 Clinical Study with Melanocortin-4 Receptor (MC4R) Agonist plus Glucagon Like Peptide-1 (GLP-1)
- Patient Dosing Commenced 3Q Calendar Year 2024
- Patient Enrollment Expected to be Completed Early 4Q Calendar Year 2024
- Topline Results Expected 1Q Calendar Year 2025
- Dry Eye Disease (DED): PL9643
- MELODY-2 & MELODY-3 Phase 3 Pivotal Clinical Studies
- FDA Confirms Protocols and Endpoints
- Patient Enrollment Start Expected 1Q Calendar Year 2025
- Topline Results Anticipated 4Q Calendar Year 2025
- Potential Partner Collaboration and Funding Discussions Ongoing
- MELODY-2 & MELODY-3 Phase 3 Pivotal Clinical Studies
- Male Sexual Dysfunction: Bremelanotide Co-Formulated with a PDE5i for the Treatment of Erectile Dysfunction (ED) in Patients That Do Not Respond to PDE5i Monotherapy
- Pharmacokinetics Study Expected to Start 1Q Calendar Year 2025
- Patient Recruitment in Phase 2/3 Study Anticipated in 2H Calendar Year 2025
- Ulcerative Colitis (UC): Oral PL8177 Phase 2 Clinical Study in Active UC Patients
- Interim Analysis Readout Expected 4Q Calendar Year 2024
- Topline Results Anticipated 1Q Calendar Year 2025
- Potential Partner Collaboration and Funding Discussions Ongoing
- Diabetic Nephropathy: Phase 2 BMT 701 Study in Patients with Diabetic Kidney Disease
- Topline Results Expected 4Q Calendar Year 2024
- Teleconference and Webcast to be held on October 1, 2024, at 11:00 AM ET
CRANBURY, N.J., Oct. 1, 2024 /PRNewswire/ — Palatin Technologies, Inc. PTN, a biopharmaceutical company developing first-in-class medicines based on molecules that modulate the activity of the melanocortin receptor system, today announced financial results for its fiscal fourth quarter and fiscal year ended June 30, 2024.
“This is a very exciting time for Palatin. We executed on multiple operational and clinical development fronts on all of our programs and are anticipating several key milestones over the coming quarters,” said Carl Spana, Ph.D., President and Chief Executive Officer of Palatin. “We are on track to complete enrollment this month in our Phase 2 clinical study of our MC4R agonist plus a GLP-1 agonist in obese patients, with topline data expected early in the first quarter of calendar year 2025. Data to date of GLP-1 agonist monotherapy to treat obesity has shown incredible results, however data also shows that more than two-thirds of patients discontinue use due to side effects and a plateau effect in the first year, and often quickly regain the loss weight. This clearly suggests that a longer-term approach is needed. Our internal research and research by academic groups indicate that combining an MC4R agonist with a GLP-1, like tirzepatide, may result in synergistic effects on weight loss, allowing for increased and/or sustained weight loss at lower and more tolerated doses.”
Dr. Spana, commenting on Palatin’s other clinical development programs, noted, “We have agreement with the FDA on the remaining PL9643 Phase 3 DED trial protocols and endpoints. The MELODY-2 and MELODY-3 studies of PL9643 are expected to begin patient enrollment in the first quarter of calendar year 2025. Lastly, we are actively engaging in collaboration and funding discussions with potential partners that have the financial and operational resources to advance PL9643 for DED through development, approval, and into commercialization.”
Program Updates and Anticipated Milestones
Obesity Program:
- Phase 2 clinical study for the co-administration of melanocortin agonist bremelanotide (MC4R) with tirzepatide (GLP-1) in obese patients for the treatment of obesity:
- The study is designed to enroll approximately 60 patients at four sites in the U.S.
- Primary endpoint: Demonstrate the safety and increased efficacy of co-administration of bremelanotide with tirzepatide on reducing body weight
- Patients will be treated with tirzepatide-only for four weeks, have eligibility confirmed, then randomized to one of four treatment arms
- Patients will undergo multiple assessments of safety and efficacy to help profile the effectiveness of bremelanotide in treating general obesity as a stand-alone treatment or in conjunction with GLP-1 therapy
- Patient enrollment expected to be completed early 4Q calendar year 2024
- Topline results expected in 1Q calendar year 2025
- Additional trial information, including inclusion and exclusion criteria, can be found at https://clinicaltrials.gov via the identifier NCT06565611
- The study is designed to enroll approximately 60 patients at four sites in the U.S.
- Novel MC4R selective long-acting agonist:
- Potential for monotherapy or combination (with a GLP-1 agonist) therapy
- Initiation of investigational new drug (IND) enabling activities expected to commence 1Q calendar year 2025
- Filing of IND anticipated 2H of calendar year 2025
Ocular Programs (melanocortin receptor agonists):
- Phase 3 PL9643 clinical program for the treatment of dry eye disease (DED):
- Positive Phase 3 MELODY-1 pivotal study successfully completed
- Statistical significance (p<0.025) met for co-primary symptom endpoint of pain
- Statistical significance (p<0.05) met for 7 of 11 secondary symptom endpoints at the 12-week treatment period
- Rapid onset of efficacy in multiple symptom endpoints at 2 weeks and continued improvement to 12 weeks with statistical significance (p<0.05) met
- Statistical significance (p<0.05) met for multiple sign endpoints, including 4 fluorescein staining endpoints at the 2-week treatment period
- Corneal fluorescein staining is used to measure corneal epithelial damage and reductions in corneal fluorescein staining with treatments like PL9643, indicating improvement in corneal health
- Excellent safety and tolerability profile
- MELODY-2 & MELODY-3 Phase 3 pivotal clinical studies
- Concluded positive Type C meeting with the FDA and reached agreement on sign and symptom endpoints for remaining two Phase 3 pivotal trial protocols
- Patient enrollment anticipated to begin 1Q calendar year 2025
- Topline results anticipated 4Q calendar year 2025
- Potential NDA submission 1H calendar year 2026
- Potential collaboration and funding discussions ongoing
- Positive Phase 3 MELODY-1 pivotal study successfully completed
Male Sexual Dysfunction Program:
- Historical data show that approximately 35% of men with ED have an inadequate response to PDE5i treatments, which represents a large underserved market
- Palatin previously conducted clinical trials showing the synergistic effects of combining bremelanotide with a PDE5i as a treatment for ED
- Palatin initiated a clinical development program for the evaluation of bremelanotide co-formulated with a PDE5 inhibitor (PDE5i) for the treatment of ED in patients that do not respond to PDE5i monotherapy:
- Pharmacokinetics (PK) study expected to start 1Q of calendar year 2025
- Patient recruitment in Phase 2/3 clinical study anticipated 2H calendar year 2025
- Topline results targeted for 1H calendar year 2026
Ulcerative Colitis Program (melanocortin receptor agonist):
- Phase 2 PL8177 oral formulation for the treatment of ulcerative colitis (UC):
- Interim analysis expected 4Q calendar year 2024
- Topline results anticipated 1Q calendar year 2025
- Additional trial information, including inclusion and exclusion criteria, can be found at https://clinicaltrials.gov via the identifier NCT05466890
- Potential collaboration discussions ongoing
Diabetic Nephropathy Program – The BREAKOUT Study (melanocortin receptor agonist):
- Phase 2 BREAKOUT study of bremelanotide (BMT 701) study in patients with diabetic kidney disease:
- Topline results expected 4Q calendar year 2024
- Additional trial information, including inclusion and exclusion criteria, can be found at https://clinicaltrials.gov via the identifier NCT05709444.
Vyleesi® (bremelanotide injection) for Hypoactive Sexual Desire Disorder:
- Asset sale to Cosette Pharmaceuticals for up to $171 million closed in December 2023:
- Received $12 million upfront, plus potential milestones of up to $159 million based on annual net sales ranging from $15 million to $200 million
- Palatin retains rights to and use of bremelanotide for obesity and male ED
Other Corporate
Financings:
- During fiscal year ended June 30, 2024, Palatin raised total gross proceeds of $21 million in registered direct and warrant inducement offerings
Fourth Quarter and Fiscal Year Ended June 30, 2024 Financial Results
Revenue
Total revenue consists of gross product sales of Vyleesi, net of expenses, allowances and accruals, and license and contract revenue.
Pursuant to the completion of the sale of Vyleesi’s worldwide rights for female sexual dysfunction to Cosette Pharmaceuticals for up to $171 million in December 2023, Palatin did not record any product sales to pharmacy distributors, for the fourth quarter ended June 30, 2024. For the fourth quarter ended June 30, 2023, gross product sales were $4.1 million and net product revenue was $1.8 million.
Vyleesi gross product sales to pharmacy distributors for the fiscal year ended June 30, 2024, were $8.9 million, with net product revenue of $4.5 million, compared to gross product sales of $12.5 million, with net product revenue of $4.9 million, for the prior fiscal year.
Operating Expenses
Total operating expenses were $8.7 million for the fourth quarter ended June 30, 2024, compared to $12.6 million for the comparable quarter last year. The decrease was mainly the result of lesser spending on our MCR programs and secondarily the elimination of selling expenses related to Vyleesi.
Total operating expenses for the fiscal year ended June 30, 2024, were $27.0 million, compared to $37.3 million for the prior fiscal year. The decrease was mainly due to the $7.8 million gain recognized on the sale of Vyleesi and secondarily the elimination of related selling expenses.
Other Income / (Expense)
Total other income / (expense), net, consists mainly of offering expenses and the change in fair value of warrant liabilities, which Palatin had recorded as a liability on the consolidated financial statements, including the revisions of certain prior period amounts to correct a misstatement with respect to classifying warrants as equity instead of a liability. The statement of operations was adjusted each quarter to reflect changes in the fair value of these warrants. For the quarter ended June 30, 2023, Palatin recorded a fair value adjustment gain of $0.9 million.
Warrant Liabilities
Palatin assessed the impact of improperly classifying the warrants related to the October 2022 financing within equity, rather than as a warrant liability that is adjusted through charges or credits to the statement of operations to reflect changes in the fair value of the warrants, and determined the impact was not material to any prior period impacted. Accordingly, the Company adjusted prior periods as those financial statements are presented for comparative purposes in future filings.
On January 24, 2024, the Company and warrant holders amended the terms of the warrants related to the October 2022 and October 2023 financings. As a result, the $1.9 million of warrant liabilities as of June 30, 2023, was reclassified to additional paid-in capital upon amendment.
Cash Flows
Palatin’s net cash used in operations for the quarter ended June 30, 2024, was $6.5 million, compared to net cash used in operations of $9.6 million for the same period in 2023. The decrease in net cash used in operations is mainly due to the decrease in operating expenses and secondarily to working capital changes.
Palatin’s net cash used in operations for the fiscal year ended June 30, 2024, was $31.5 million, compared to net cash used in operations of $29.3 million, for the same period in 2023. The increase in net cash used in operations was a result of working capital changes, and increased payments made related to inventory purchase commitments.
Net Loss
Palatin’s net loss for the quarter and fiscal year ended June 30, 2024, was $8.6 million and $29.7 million, or $(0.51) and $(2.02) per basic and diluted common share, respectively, compared to a net loss of $9.8 million and $24.0 million, or $(0.84) and $(2.21) per basic and diluted common share, respectively, for the same periods in 2023.
The decrease in net loss for the quarter ended June 30, 2024, over the quarter ended June 30, 2023, was mainly due to the decrease in Vyleesi operating expenses, offset by the elimination of net product revenue of Vyleesi and the recognition of the change in fair value of warrant liabilities for the quarter ended June 30, 2023.
The increase in net loss for the fiscal year ended June 30, 2024, over the prior fiscal year, was mainly due to the recognition of an income tax benefit related to the sale of New Jersey Net Operating Losses, and the recognition of a gain on purchase commitments for the fiscal year ended June 30, 2023.
Cash Position
As of June 30, 2024, Palatin’s cash and cash equivalents were $9.5 million, compared to cash and cash equivalents of $10.0 million as of March 31, 2024, and $8.0 million with $3.0 million in marketable securities as of June 30, 2023.
The Company is actively engaged with multiple parties for potential funding sources for future operating cash needs.
Palatin’s audited financial statements for the year ended June 30, 2024, to be included in the Annual Report on Form 10-K include an audit report from its independent registered public accounting firm, KPMG LLP, that contains a going concern explanatory paragraph.
Conference Call / Webcast
Palatin will host a conference call and audio webcast on October 1, 2024, at 11:00 a.m. Eastern Time to discuss the results of operations in greater detail and provide an update on corporate developments. Individuals interested in listening to the conference call live can dial 1-888-506-0062 (US) or 1-973-528-0011 (International), conference ID 252326. The audio webcast and replay can be accessed by logging on to the “Investor-Webcasts” section of Palatin’s website at http://www.palatin.com. A telephone and audio webcast replay will be available one hour after the completion of the call. To access the telephone reply, dial 1-877-481-4010 (US) or 1-919-882-2331 (International), passcode 51290. The webcast and telephone replay will be available through October 15, 2024.
About Melanocortin Receptor Agonists
The melanocortin receptor (“MCR”) system has effects on inflammation, immune system responses, metabolism, food intake, and sexual function. There are five melanocortin receptors, MC1R through MC5R. Modulation of these receptors, through use of receptor-specific agonists, which activate receptor function, or receptor-specific antagonists, which block receptor function, can have medically significant pharmacological effects.
Many tissues and immune cells located in the eye (and other places, for example the gut and kidney) express melanocortin receptors, empowering our opportunity to directly activate natural pathways to resolve disease inflammation.
About Palatin
Palatin is a biopharmaceutical company developing first-in-class medicines based on molecules that modulate the activity of the melanocortin receptor systems, with targeted, receptor-specific product candidates for the treatment of diseases with significant unmet medical need and commercial potential. Palatin’s strategy is to develop products and then form marketing collaborations with industry leaders to maximize their commercial potential. For additional information regarding Palatin, please visit Palatin’s website at www.Palatin.com and follow Palatin on Twitter at @PalatinTech.
Forward-looking Statements
Statements in this press release that are not historical facts, including statements about future expectations of Palatin Technologies, Inc., such as statements about Palatin products in development, clinical trial results, potential actions by regulatory agencies including the FDA, regulatory plans, development programs, proposed indications for product candidates, and market potential for product candidates are “forward-looking statements” within the meaning of Section 27A of the Securities Act of 1933, Section 21E of the Securities Exchange Act of 1934 and as that term is defined in the Private Securities Litigation Reform Act of 1995. Palatin intends that such forward-looking statements be subject to the safe harbors created thereby. Such forward-looking statements involve known and unknown risks, uncertainties and other factors that could cause Palatin’s actual results to be materially different from its historical results or from any results expressed or implied by such forward-looking statements. Palatin’s actual results may differ materially from those discussed in the forward-looking statements for reasons including, but not limited to, results of clinical trials, regulatory actions by the FDA and other regulatory and the need for regulatory approvals, Palatin’s ability to fund development of its technology and establish and successfully complete clinical trials, the length of time and cost required to complete clinical trials and submit applications for regulatory approvals, products developed by competing pharmaceutical, biopharmaceutical and biotechnology companies, commercial acceptance of Palatin’s products, and other factors discussed in Palatin’s periodic filings with the Securities and Exchange Commission. Palatin is not responsible for updating events that occur after the date of this press release.
Palatin Technologies® is a registered trademark of Palatin Technologies, Inc.
(Financial Statement Data Follows)
|
PALATIN TECHNOLOGIES, INC. |
||||||||
|
and Subsidiary |
||||||||
|
Consolidated Statements of Operations |
||||||||
|
(unaudited) |
||||||||
|
Three Months Ended June 30, |
Year Ended June 30, |
|||||||
|
2024 |
2023 |
2024 |
2023 |
|||||
|
REVENUES |
||||||||
|
Product revenue, net |
$ – |
$ 1,758,933 |
$ 4,490,090 |
$ 4,850,678 |
||||
|
License and contract |
– |
3,000 |
– |
3,000 |
||||
|
Total revenues |
– |
1,761,933 |
4,490,090 |
4,853,678 |
||||
|
OPERATING EXPENSES |
||||||||
|
Cost of products sold |
– |
104,032 |
97,637 |
418,470 |
||||
|
Research and development |
4,671,856 |
7,405,681 |
22,400,372 |
22,630,577 |
||||
|
Selling, general and administrative |
4,003,779 |
5,070,318 |
12,270,046 |
15,290,836 |
||||
|
Gain on sale of Vyleesi |
16,436 |
– |
(7,781,844) |
– |
||||
|
Gain on purchase commiment |
– |
– |
– |
(1,027,322) |
||||
|
Total operating expenses |
8,692,071 |
12,580,031 |
26,986,211 |
37,312,561 |
||||
|
Loss from operations |
(8,692,071) |
(10,818,098) |
(22,496,121) |
(32,458,883) |
||||
|
OTHER INCOME (EXPENSE) |
||||||||
|
Investment income |
103,914 |
182,975 |
376,843 |
691,981 |
||||
|
Foreign currency (loss) gain |
(8,900) |
(77,850) |
59,753 |
(429,971) |
||||
|
Interest expense |
(3,373) |
(1,490) |
(17,114) |
(20,013) |
||||
|
Offering expenses |
– |
– |
(696,912) |
(1,115,765) |
||||
|
Change in fair value of warrant liabilities |
– |
895,016 |
(6,962,562) |
4,620,911 |
||||
|
Total other income (expense), net |
91,641 |
998,651 |
(7,239,992) |
3,747,143 |
||||
|
Loss before income taxes |
(8,600,430) |
(9,819,447) |
(29,736,113) |
(28,711,740) |
||||
|
Income tax benefit |
– |
– |
– |
4,674,999 |
||||
|
NET LOSS |
$ (8,600,430) |
$ (9,819,447) |
$ (29,736,113) |
$ (24,036,741) |
||||
|
Basic and diluted net loss per common share |
$ (0.51) |
$ (0.84) |
$ (2.02) |
$ (2.21) |
||||
|
Weighted average number of common shares outstanding used in computing basic and diluted net loss per common share |
16,761,856 |
11,727,401 |
14,697,096 |
10,890,159 |
||||
|
PALATIN TECHNOLOGIES, INC. |
|||
|
and Subsidiary |
|||
|
Consolidated Balance Sheets |
|||
|
(unaudited) |
|||
|
June 30, 2024 |
June 30, 2023 |
||
|
ASSETS |
|||
|
Current assets: |
|||
|
Cash and cash equivalents |
$ 9,527,396 |
$ 7,989,582 |
|
|
Marketable securities |
– |
2,992,890 |
|
|
Accounts receivable |
– |
2,915,760 |
|
|
Inventories |
– |
526,000 |
|
|
Prepaid expenses and other current assets |
242,272 |
1,897,281 |
|
|
Total current assets |
9,769,668 |
16,321,513 |
|
|
Property and equipment, net |
388,361 |
684,910 |
|
|
Right-of-use assets – operating leases |
527,321 |
876,101 |
|
|
Other assets |
56,916 |
56,916 |
|
|
Total assets |
$ 10,742,266 |
$ 17,939,440 |
|
|
LIABILITIES AND STOCKHOLDERS’ DEFICIENCY |
|||
|
Current liabilities: |
|||
|
Accounts payable |
$ 4,101,929 |
$ 4,303,527 |
|
|
Accrued expenses |
4,185,046 |
6,511,059 |
|
|
Short-term operating lease liabilities |
380,542 |
354,052 |
|
|
Short-term finance lease liabilities |
46,014 |
106,392 |
|
|
Other current liabilities |
944,150 |
3,856,800 |
|
|
Total current liabilities |
9,657,681 |
15,131,830 |
|
|
Long-term operating lease liabilities |
163,782 |
544,323 |
|
|
Long-term finance lease liabilities |
– |
46,014 |
|
|
Other long-term liabilities |
1,032,300 |
2,083,200 |
|
|
Warrant liabilities |
– |
1,850,544 |
|
|
Total liabilities |
10,853,763 |
19,655,911 |
|
|
Contingently redeemable warrants |
– |
263,400 |
|
|
Stockholders’ deficiency: |
|||
|
Preferred stock of $0.01 par value – authorized 10,000,000 shares: shares issued and |
|||
|
outstanding designated as follows: |
|||
|
Series A Convertible: authorized 4,030 shares as of June 30, 2024: issued and outstanding |
|||
|
4,030 shares as of June 30, 2024 and June 30, 2023 |
40 |
40 |
|
|
Common stock of $0.01 par value – authorized 300,000,000 shares: |
|||
|
issued and outstanding 17,926,640 shares as of June 30, 2024 and 11,656,714 shares |
|||
|
as of June 30, 2023 |
179,266 |
116,567 |
|
|
Additional paid-in capital |
441,475,747 |
409,933,959 |
|
|
Accumulated deficit |
(441,766,550) |
(412,030,437) |
|
|
Total stockholders’ deficiency |
(111,497) |
(1,979,871) |
|
|
Total liabilities and stockholders’ deficiency |
$ 10,742,266 |
$ 17,939,440 |
|
![]() View original content to download multimedia:https://www.prnewswire.com/news-releases/palatin-reports-fourth-quarter-and-fiscal-year-ended-2024-financial-results-provides-update-on-clinical-programs-strategic-priorities-and-anticipated-milestones-302263692.html
View original content to download multimedia:https://www.prnewswire.com/news-releases/palatin-reports-fourth-quarter-and-fiscal-year-ended-2024-financial-results-provides-update-on-clinical-programs-strategic-priorities-and-anticipated-milestones-302263692.html
SOURCE Palatin Technologies, Inc.
© 2024 Benzinga.com. Benzinga does not provide investment advice. All rights reserved.
Market Whales and Their Recent Bets on CMG Options
Whales with a lot of money to spend have taken a noticeably bullish stance on Chipotle Mexican Grill.
Looking at options history for Chipotle Mexican Grill CMG we detected 14 trades.
If we consider the specifics of each trade, it is accurate to state that 42% of the investors opened trades with bullish expectations and 42% with bearish.
From the overall spotted trades, 3 are puts, for a total amount of $307,320 and 11, calls, for a total amount of $495,855.
Projected Price Targets
Based on the trading activity, it appears that the significant investors are aiming for a price territory stretching from $36.0 to $58.7 for Chipotle Mexican Grill over the recent three months.
Volume & Open Interest Development
Looking at the volume and open interest is an insightful way to conduct due diligence on a stock.
This data can help you track the liquidity and interest for Chipotle Mexican Grill’s options for a given strike price.
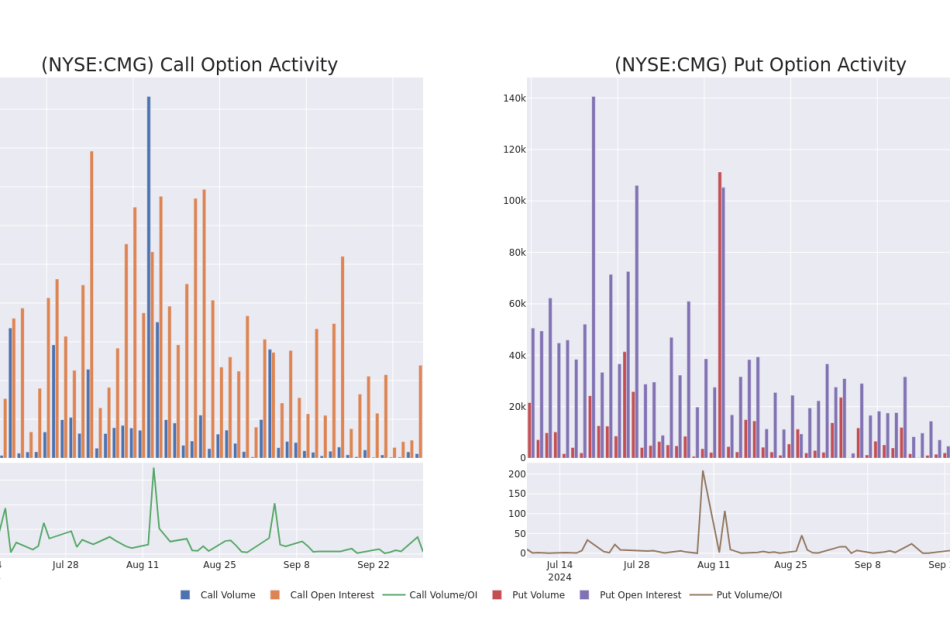
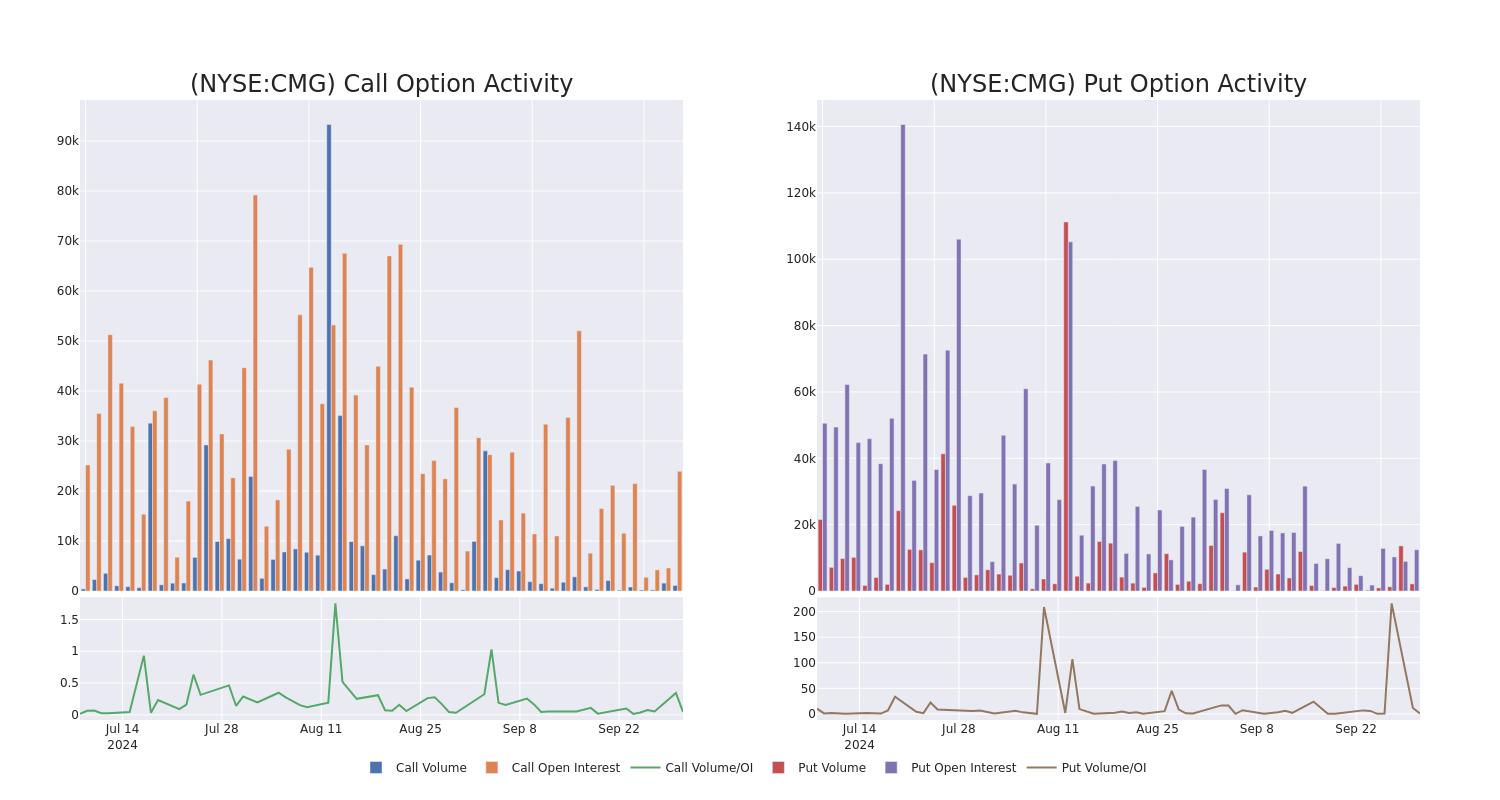
Below, we can observe the evolution of the volume and open interest of calls and puts, respectively, for all of Chipotle Mexican Grill’s whale activity within a strike price range from $36.0 to $58.7 in the last 30 days.
Chipotle Mexican Grill Call and Put Volume: 30-Day Overview
Largest Options Trades Observed:
| Symbol | PUT/CALL | Trade Type | Sentiment | Exp. Date | Ask | Bid | Price | Strike Price | Total Trade Price | Open Interest | Volume |
|---|---|---|---|---|---|---|---|---|---|---|---|
| CMG | PUT | SWEEP | BEARISH | 01/16/26 | $5.2 | $5.0 | $5.2 | $52.00 | $130.0K | 843 | 1 |
| CMG | PUT | SWEEP | BULLISH | 10/18/24 | $0.8 | $0.75 | $0.75 | $55.00 | $128.1K | 10.7K | 1.7K |
| CMG | CALL | SWEEP | BULLISH | 06/20/25 | $22.8 | $22.6 | $22.8 | $36.00 | $114.0K | 565 | 50 |
| CMG | CALL | SWEEP | BEARISH | 10/18/24 | $1.1 | $1.05 | $1.1 | $58.00 | $63.0K | 2.6K | 800 |
| CMG | CALL | SWEEP | BEARISH | 01/16/26 | $20.5 | $20.2 | $20.2 | $41.00 | $60.6K | 205 | 50 |
About Chipotle Mexican Grill
Chipotle Mexican Grill is the largest fast-casual chain restaurant in the United States, with systemwide sales of $9.9 billion in 2023. The Mexican concept is predominately company-owned, although it recently inked a development agreement with Alshaya Group in the Middle East. It had a footprint of nearly 3,440 stores at the end of 2023, heavily indexed to the United States, although it maintains a small presence in Canada, the UK, France, and Germany. Chipotle sells burritos, burrito bowls, tacos, quesadillas, and beverages, with a selling proposition built around competitive prices, high-quality food sourcing, speed of service, and convenience. The company generates its revenue entirely from restaurant sales and delivery fees.
Chipotle Mexican Grill’s Current Market Status
- With a trading volume of 3,426,707, the price of CMG is down by -1.29%, reaching $56.88.
- Current RSI values indicate that the stock is may be approaching overbought.
- Next earnings report is scheduled for 28 days from now.
Professional Analyst Ratings for Chipotle Mexican Grill
Over the past month, 2 industry analysts have shared their insights on this stock, proposing an average target price of $65.0.
Unusual Options Activity Detected: Smart Money on the Move
Benzinga Edge’s Unusual Options board spots potential market movers before they happen. See what positions big money is taking on your favorite stocks. Click here for access.
* An analyst from Oppenheimer has revised its rating downward to Outperform, adjusting the price target to $65.
* An analyst from TD Cowen has revised its rating downward to Buy, adjusting the price target to $65.
Options are a riskier asset compared to just trading the stock, but they have higher profit potential. Serious options traders manage this risk by educating themselves daily, scaling in and out of trades, following more than one indicator, and following the markets closely.
If you want to stay updated on the latest options trades for Chipotle Mexican Grill, Benzinga Pro gives you real-time options trades alerts.
Market News and Data brought to you by Benzinga APIs
© 2024 Benzinga.com. Benzinga does not provide investment advice. All rights reserved.
Charlie Munger Gave His Family Fortune To 'Chinese Warren Buffett' – He Flipped It Into $400 Million: 'Backed Up The Truck And Made A Killing'
In the early 2000s, Charlie Munger–Warren Buffett’s longtime business partner – made an unexpected decision. He handed almost $90 million of his family’s fortune to a 38-year-old investor named Li Lu.
At the time, Li was a rising star in the investment world, often called the “Chinese Warren Buffett.” What followed was remarkable. That initial investment grew into about $400 million, showing just how successful that decision was.
Don’t Miss:
Li Lu, the founder of Himalaya Capital, had a reputation for applying the value investing principles of Ben Graham, similar to Munger and Buffett. Instead of focusing on the crowded American market, Li turned his attention to Chinese stocks, where he saw immense potential. Munger once remarked, “We made unholy good returns for a long, long time,” reflecting on the success of his decision to entrust Li with his family’s wealth. Munger noted that the initial $88 million investment had grown four or five times.
Trending: The global games market is projected to generate $272B by the end of the year — for $0.55/share, this VC-backed startup with a 7M+ userbase gives investors easy access to this asset market.
One of Li’s most notable moves was his early investment in Kweichow Moutai, a brand of distilled liquor that became China’s national drink after the communist revolution. Li recognized its potential while it was trading cheaply, at just four to five times its earnings. He went all in, buying as much stock as possible – a decision that paid off tremendously as Moutai became one of China’s largest listed companies. In a Financial Times article, Munger praised Li’s foresight: “He just backed up the truck, bought all he could and made a killing.”
Li’s relationship with Munger goes beyond just money management. In a 2019 Daily Journal Corporation meeting, Munger reflected on how rare it was to trust an outsider with his money, saying, “I’m 95 years old. I’ve given Munger money to some outsider to run once in 95 years. That’s Li Lu.” Munger saw something unique in Li, a combination of strategic thinking and an ability to seize opportunities others might overlook.
Li’s investment journey wasn’t without challenges. He fled China after the Tiananmen Square protests and eventually found refuge in the U.S., where he earned degrees from Columbia University. His early struggles shaped his investment philosophy, but what set him apart was his ability to turn adversity into opportunity. Despite the obstacles, Li built Himalaya Capital into one of the most successful China-focused investment funds, headquartered in Seattle.
Li often praised Munger’s mindset, saying that even in the face of challenges, Munger never seemed pessimistic or defeated. He admired Munger’s ability to remain rational and composed, embodying the Chinese saying, “One should neither be pleased by external gains nor saddened by personal losses.”
Trending: These five entrepreneurs are worth $223 billion – they all believe in one platform that offers a 7-9% target yield with monthly dividends
With Munger’s guidance, Li reorganized his fund and eliminated many of the flaws typical of hedge funds. This allowed him to focus on long-term investments without the constant pressure to show monthly returns. From 2004 to 2009, Li’s fund achieved an annual compound growth rate of 36%; over 12 years, the capital grew more than 20 times.
The partnership between Charlie Munger and Li Lu is a prime example of what can happen when trust and shared values come together in investing. Munger’s choice to entrust a significant chunk of his family fortune to Li Lu, an “outsider” by most standards, might have seemed like a gamble to some, but it turned out to be a brilliant move. Their collaboration highlights that true success goes beyond just crunching numbers – it’s about long-term vision and trusting the right person to steer the ship.
Read Next:
Up Next: Transform your trading with Benzinga Edge’s one-of-a-kind market trade ideas and tools. Click now to access unique insights that can set you ahead in today’s competitive market.
Get the latest stock analysis from Benzinga?
This article Charlie Munger Gave His Family Fortune To ‘Chinese Warren Buffett’ – He Flipped It Into $400 Million: ‘Backed Up The Truck And Made A Killing’ originally appeared on Benzinga.com
© 2024 Benzinga.com. Benzinga does not provide investment advice. All rights reserved.
Carnival Q3 Earnings: 15% Topline Growth, Record Operating Income, Guidance Boost And More (CORRECTED)
Editor’s Note: This story has been updated to correct an error in the reported estimate for Carnival’s fourth-quarter earnings.
Carnival Corp CCL stock slid Monday following the third-quarter print.
The company reported third-quarter adjusted EPS of $1.27, beating the analyst consensus estimate of $1.16.
Carnival reported quarterly sales of $7.90 billion, up 15.2% year over year, beating the street view of $7.83 billion.
Also Read: Cruise Stocks To Sail Smoothly Into 2025: Analyst Sees ‘Zero Signs Of Softening’
The company registered an operating income of $2.2 billion, up by 34% Y/Y. Adjusted EBITDA in the quarter under review pegs at $2.8 billion, up 25% Y/Y.
The company continues to experience strong bookings momentum driven by booking volumes for 2025 sailings. The company ended the quarter with $4.5 billion of liquidity.
“Our strong improvements were led by high-margin, same-ship yield growth, driving a 26 percent improvement in unit operating income, the highest level we have reached in fifteen years,” commented Carnival Corporation & plc’s Chief Executive Officer Josh Weinstein.
Outlook: Carnival projects fourth-quarter net yields (in constant currency) up approximately 5.0%.
It expects fourth-quarter adjusted EPS of $0.05, versus the estimate of $0.07. It expects fourth-quarter adjusted EBITDA of approximately $1.14 billion, up 20% Y/Y.
For 2024, the company expects net yields (in constant currency) up approximately 10.40% Y/Y (prior view: 10.25%). Carnival expects adjusted EPS of $1.33 (prior view: $1.18), above the consensus of $1.21. It projects adjusted EBITDA of approximately $6.0 billion, up 40% Y/Y (prior view: $5.83 billion).
Carnival stock is up over 32% in the last 12 months. Investors can gain exposure to the stock through Vanguard Mid-Cap Growth ETF VOT and iShares Russell Mid-Cap ETF IWR.
Price Action: CCL stock is down 2.08% to $18.16 at last check Monday.
Image: Viola from Pixabay
Also Read:
Market News and Data brought to you by Benzinga APIs
© 2024 Benzinga.com. Benzinga does not provide investment advice. All rights reserved.
Wall Street Analysts Think Cadence Is a Good Investment: Is It?
The recommendations of Wall Street analysts are often relied on by investors when deciding whether to buy, sell, or hold a stock. Media reports about these brokerage-firm-employed (or sell-side) analysts changing their ratings often affect a stock’s price. Do they really matter, though?
Before we discuss the reliability of brokerage recommendations and how to use them to your advantage, let’s see what these Wall Street heavyweights think about Cadence Design Systems CDNS.
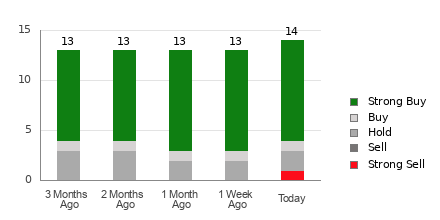
Cadence currently has an average brokerage recommendation of 1.64, on a scale of 1 to 5 (Strong Buy to Strong Sell), calculated based on the actual recommendations (Buy, Hold, Sell, etc.) made by 14 brokerage firms. An ABR of 1.64 approximates between Strong Buy and Buy.
Of the 14 recommendations that derive the current ABR, 10 are Strong Buy and one is Buy. Strong Buy and Buy respectively account for 71.4% and 7.1% of all recommendations.
Brokerage Recommendation Trends for CDNS
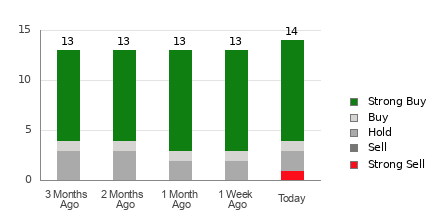
The ABR suggests buying Cadence, but making an investment decision solely on the basis of this information might not be a good idea. According to several studies, brokerage recommendations have little to no success guiding investors to choose stocks with the most potential for price appreciation.
Do you wonder why? As a result of the vested interest of brokerage firms in a stock they cover, their analysts tend to rate it with a strong positive bias. According to our research, brokerage firms assign five “Strong Buy” recommendations for every “Strong Sell” recommendation.
In other words, their interests aren’t always aligned with retail investors, rarely indicating where the price of a stock could actually be heading. Therefore, the best use of this information could be validating your own research or an indicator that has proven to be highly successful in predicting a stock’s price movement.
Zacks Rank, our proprietary stock rating tool with an impressive externally audited track record, categorizes stocks into five groups, ranging from Zacks Rank #1 (Strong Buy) to Zacks Rank #5 (Strong Sell), and is an effective indicator of a stock’s price performance in the near future. Therefore, using the ABR to validate the Zacks Rank could be an efficient way of making a profitable investment decision.
ABR Should Not Be Confused With Zacks Rank
Although both Zacks Rank and ABR are displayed in a range of 1-5, they are different measures altogether.
The ABR is calculated solely based on brokerage recommendations and is typically displayed with decimals (example: 1.28). In contrast, the Zacks Rank is a quantitative model allowing investors to harness the power of earnings estimate revisions. It is displayed in whole numbers — 1 to 5.
Analysts employed by brokerage firms have been and continue to be overly optimistic with their recommendations. Since the ratings issued by these analysts are more favorable than their research would support because of the vested interest of their employers, they mislead investors far more often than they guide.
In contrast, the Zacks Rank is driven by earnings estimate revisions. And near-term stock price movements are strongly correlated with trends in earnings estimate revisions, according to empirical research.
Furthermore, the different grades of the Zacks Rank are applied proportionately across all stocks for which brokerage analysts provide earnings estimates for the current year. In other words, at all times, this tool maintains a balance among the five ranks it assigns.
Another key difference between the ABR and Zacks Rank is freshness. The ABR is not necessarily up-to-date when you look at it. But, since brokerage analysts keep revising their earnings estimates to account for a company’s changing business trends, and their actions get reflected in the Zacks Rank quickly enough, it is always timely in indicating future price movements.
Is CDNS Worth Investing In?
In terms of earnings estimate revisions for Cadence, the Zacks Consensus Estimate for the current year has declined 0.1% over the past month to $5.88.
Analysts’ growing pessimism over the company’s earnings prospects, as indicated by strong agreement among them in revising EPS estimates lower, could be a legitimate reason for the stock to plunge in the near term.
The size of the recent change in the consensus estimate, along with three other factors related to earnings estimates, has resulted in a Zacks Rank #4 (Sell) for Cadence.
Therefore, it could be wise to take the Buy-equivalent ABR for Cadence with a grain of salt.
© 2024 Benzinga.com. Benzinga does not provide investment advice. All rights reserved.
US Stocks Set For Shaky Start Ahead Of JOLTS Data, Nike Earnings: Strategist Says These 3 Structural Drivers Support 'Buying The Dip'
Stocks are gearing up for another nervy start on Tuesday after they scrapped through in the previous session to finish a seasonally weak September on a high. Some strategists point to the unusual September gains as a testament to the market’s resilience. The unequivocal belief is the gains could continue into the fourth quarter and beyond only if the economy can skirt a recession.
Each incoming economic data, including the job opening and manufacturing activity data due Tuesday, would offer evidence regarding the economy’s strength or lack thereof. This being the presidential election year, traders brace for more volatility at least until Nov. 5. The market may also have to contend with earnings as they begin to roll out in the second half of the month.
| Futures | Performance (+/-) |
| Nasdaq 100 | +0.07% |
| S&P 500 | -0.09% |
| Dow | -0.27% |
| R2K | -0.23% |
In premarket trading on Tuesday, the SPDR S&P 500 ETF Trust SPY eased 0.02% to $573.63 and the Invesco QQQ ETF QQQ rose 0.09% to $488.50, according to Benzinga Pro data.
Cues From Last Week:
U.S. stocks survived a bout of selling pressure and closed Monday’s session higher. The overbought levels and a slump in some major global markets introduced caution right at the start of the session, and the major indices moved mostly below the unchanged line for much of the session. The selling intensified after Fed Chair Jerome Powell poured cold water on hopes of rapid downward adjustment of rates during his speech.
The major indices staged a late-hour recovery to end September firmly in the green, with the S&P 500 and Dow Industrials closing at fresh highs. Nine of the 11 S&P 500 sector classes closed in the green, with communication services, energy and real estate stocks seeing strong buying interest. On the other hand, material and consumer discretionary stocks pulled back.
| Index | Day’s Performance (+/) | Value | September Performance |
Q3 Performance |
| Nasdaq Composite | +0.38% | 18,189.17 | +2.69% | +2.58% |
| S&P 500 Index | +0.42% | 5,762.48 | +2.02% | +5.53% |
| Dow Industrials | +0.04% | 42,330.15 | +1.85% | +8.21% |
| Russell 2000 | +0.24% | 2,229.97 | +0.56% | +8.90% |
Insights From Analysts:
Fed’s larger-than-expected rate cut can buy more time for high-quality stocks to remain expensive and even help lower-quality cyclical stocks, especially after recent China actions, said Morgan Stanley’s US Equity Strategist Mike Wilson. “However, I believe labor data and other growth indicators need to improve to justify these conditions continuing into year-end and beyond – i.e., a soft landing with growth reaccelerating, inflation stabilizing above 2%, and the Fed continuing to cut rates, ” the strategist said.
The market is entering a seasonally strong period after being up for eight of the nine months. Fund Strat’s Head of Research Tom Lee said in the firm’s weekly commentary that the following three favorable structural drivers for equities support “buy the dip:”
- Fed launches easing cycle + “no landing”
- China PBOC bazooka
- Post-election and cash on sidelines dynamics
He noted that when the Fed cuts rate and the US economy is not in recession, the S&P 500 Index has risen seven out of seven times both three and six months later.
See also: Best Futures Trading Software
Upcoming Economic Data:
- S&P Global is due to release the final manufacturing purchasing managers’ index for September at 9:45 a.m. EDT. Economists, on average, expect the final manufacturing PMI to come in at 47, down from 47.9 in August.
- The Institute for Supply Management will release its national manufacturing PMI at 10 a.m. EDT, with the consensus calling for a reading of 47.5 for September, slightly up from 47.2 in August.
- The Labor Department is scheduled to release the results of its August Job Openings and Labor Turnover Survey at 10 a.m. EDT. Economists, on average, estimate job openings to remain unchanged with the July level, at 7.7 million.
- The Commerce Department’s construction spending report for August, due at 10 a.m. EDT, will likely show flattish spending relative to July, which saw a 0.3% month-over-month drop.
- Federal Reserve Governor Lisa Cook will make a public appearance at 11:10 a.m. EDT.
- Richmond Fed President Tom Barkin, Atlanta Fed President Raphael Bostic and Boston Fed President Susan Collins are scheduled to participate in a joint panel discussion about technology-enabled disruption at 6:15 p.m. EDT.
Stocks In Focus:
- Trump Media & Technology Group Corp. DJT rallied nearly 7.50% in premarket trading after the company said it has expanded its TV streaming delivery network to multi-site operation.
- Ford Motor Co. F climbed over 2% on a positive analyst action.
- Acuity Brands, Inc. AYI, McCormick & Company, Inc. MKC, Paychex, Inc. PAYX and United Natural Foods, Inc. UNFI are among the notable companies due to report their quarterly results before the market open.
- Those reporting after the close are NIKE, Inc. NKE, Resources Connection, Inc. RGP and Cal-Maine Foods, Inc. CALM.
Commodities, Bonds And Global Equity Markets:
Crude oil futures pulled back sharply, while gold futures advanced moderately. Bitcoin BTC/USD traded slightly higher under the $64K level. The yield on the 10-year benchmark Treasury note fell 5.7 basis points to 3.745%.
In Asia, the Japanese market rebounded, although sentiment elsewhere remained muted. The Chinese, Hong Kong and South Korean markets remained closed for public holidays. European stocks showed tentativeness in early trading ad traders digested the preliminary September consumer price inflation data for the eurozone.
Read Next:
Image Via Shutterstock
Market News and Data brought to you by Benzinga APIs
© 2024 Benzinga.com. Benzinga does not provide investment advice. All rights reserved.
Intel (INTC) Stock Looks Cheaper than NVDA & AMD on a Forward Basis, but I’m Cautious
Intel (INTC) has found itself in a world of trouble in 2024 after years of innovation failures left it significantly lagging behind its peers. A lot has happened in recent months, and there are many more developments possible before the end of the year. Interestingly, analysts still see the business recovering to the extent that the stock becomes quite affordable compared to peers in upcoming years. Despite this, I’m concerned the company will struggle to catch up, and as such, I’m neutral on INTC.
What Happened at Intel?
Intel remains a global chip giant, with operations in both the design and manufacturing of chipsets. However, the decline from its once-dominant position in the semiconductor industry is evident, and can be attributed to a variety of factors that have unfolded over the past decade. Those pressures continue, and so I have a neutral rating on the stock.
The company’s struggle to maintain its technological edge began around 2015 when it simply stopped innovating as quickly as its peers. As the innovation cycles failed to deliver material improvements and other companies transitioned to smaller, more efficient chip manufacturing processes, Intel continued making profits as it produced its less advanced chips en masse.
This lack of innovation eventually caught up with Intel. The company’s reliance on its x86 architecture also left it vulnerable as the industry shifted towards more energy-efficient ARM-based (ARM) designs, particularly in mobile and emerging artificial intelligence (AI) applications. Intel’s weaknesses were laid bare during the pandemic as supply chain disruptions and increased demand for computing power highlighted the company’s manufacturing limitations.
Intel’s Catch-Up Strategy
In response to falling behind, Intel brought in CEO Pat Gelsinger in 2021 to spearhead a turnaround strategy, which included massive investments in new fabrication facilities and a renewed focus on technological leadership.
Gelsinger kicked things off by announcing his ambitious “five nodes in four years” strategy, with the aim of rebounding as quickly as possible. However, the road to recovery has been challenging, with Intel facing intense competition and a tough climb to regain customer confidence in its ability to deliver cutting-edge products on schedule.
To date, there’s very little evidence of Intel catching up. The company’s struggles are particularly evident in the Data Center business, where it lags behind competitors AMD (AMD) and Nvidia (NVDA). Intel’s Q2’24 results produced a 1% year-over-year revenue decline; a sharp contrast to its peers.
Does Intel’s Future Include Divestments or a Buyout?
To address its financial issues, Intel has implemented a $10 billion cost reduction program and recently converted its foundry business into a subsidiary. This restructuring aims to drive greater transparency, cost savings, and growth, but it hasn’t led me to adopt a bullish view of Intel stock yet.
The stock gained on this announcement in September, and then further by a deal with Amazon (AMZN) Web Services to co-invest in a custom AI semiconductor. The company also received $3 billion of U.S. government funding to make chips for the military.
Moreover, recent reports have suggested that a potential $5 billion investment from Apollo Global Management (APO) could be on the cards, and there have also been reports of discussions with Qualcomm (QCOM) about a possible partial or full acquisition.
While the $5 billion investment may sound lofty, some analysts have suggested that it would amount to little more than a drop in the ocean given the capital needed in the sector. That may be especially true for Intel, given its technological lag versus peers like TSMC.
Intel Seems Cheaper than Nvidia & AMD
Despite all these issues, reports, and turbulence, Intel appears cheaper than its peers Nvidia and AMD. While INTC stock trades at 91x forward earnings, according to analysts EPS will improve significantly in the coming years. Resultantly, the estimated forward price-to-earnings (P/E) ratio falls to 20.3x for the year ending December 2025 and to 12.6x in 2026.
By comparison, Nvidia is trading at 43x forward earnings, and 30.9x earnings for the year ending January 2026. This figure falls to 26.3x for the year to January 2027 and 24.3x for 2028. AMD’s valuation metrics are also higher, with the stock trading at 31x forward earnings for the year ending December 2025, and 21.8x forward earnings for the year ending December 2026. That suggests Intel is actually significantly cheaper than its peers, albeit without taking account of cash positions.
Is Intel Stock a Buy According to Analysts?
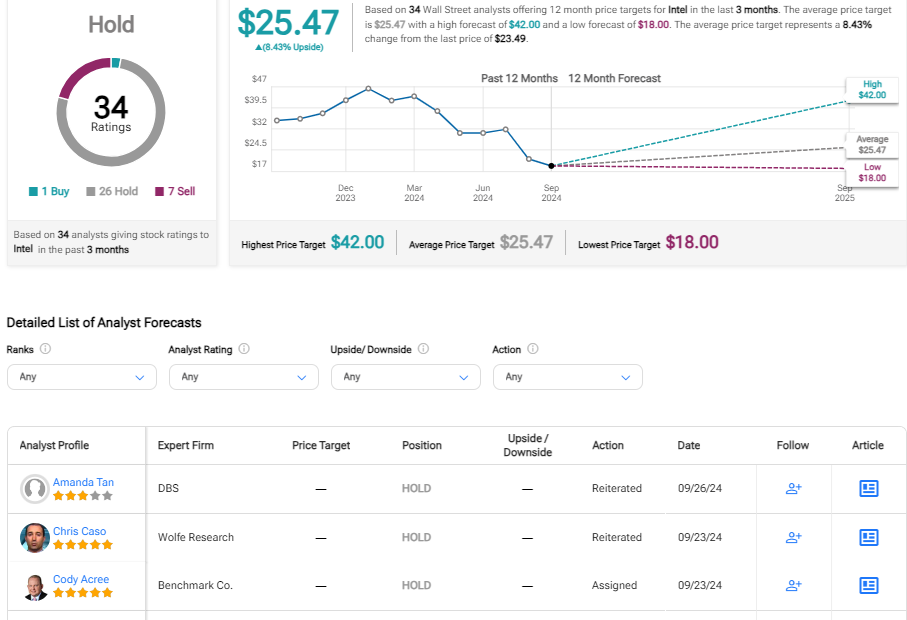
On TipRanks, INTC comes in as a Hold based on one Buy, 26 Holds, and seven Sell ratings assigned by analysts in the past three months. The average Intel stock price target is $25.47, implying almost 10% potential upside.
The Bottom Line on Intel Stock
Intel’s recent rally on acquisition rumors has the stock trading within 10% of its share price target. It’s interesting to see that most analysts are neutral despite consensus forecasts that predict a strong recovery in earnings and very competitive forward valuation multiples. I believe the ongoing concerns about Intel’s industry relevancy compound existing concerns. It remains uncertain how much support the business might require to effectively compete with TSMC from a foundry perspective. I have a neutral view of INTC stock.
2 Unstoppable Warren Buffett Stocks That Are Screaming Buys for the Remainder of 2024 (and Beyond)
For the better part of the last six decades, Berkshire Hathaway (NYSE: BRK.A)(NYSE: BRK.B) CEO Warren Buffett has been lapping Wall Street’s broadest-based index, the S&P 500. Whereas the S&P 500 has delivered an aggregate return, including dividends, of around 38,000% since the mid-1960s, the aptly named “Oracle of Omaha” has overseen a 5,544,952% cumulative return in his company’s Class A shares (BRK.A), as of the closing bell on Sept. 27.
Warren Buffett is generally an open book and has been more than willing to share the traits and characteristics he looks for when investing in so-called “wonderful companies.” For example, he tends to focus on profitable, time-tested businesses with sustained competitive advantages and rock-solid management teams.
Additionally, a majority of the 43 stocks found in Berkshire’s roughly $315 billion investment portfolio pays a dividend.
But no two Buffett stocks are created equally. As we enter the fourth quarter of 2024, two unstoppable stocks in Berkshire’s $315 billion portfolio stand out as screaming buys — and are likely to remain so for the foreseeable future.
Sirius XM Holdings
The first magnificent Buffett stock that makes for a no-brainer buy in the fourth quarter (and beyond) is satellite-radio operator Sirius XM Holdings (NASDAQ: SIRI).
Sirius XM may have represented an intriguing arbitrage opportunity for the Oracle of Omaha and his investment team.
In December 2023, Sirius XM unveiled plans to merge with Liberty Media’s Sirius XM tracking stock, Liberty Sirius XM Group. Liberty Media had been Sirius XM’s largest shareholder by a mile, and its various tracking stock classes (Berkshire Hathaway held shares in two of these three classes) were often valued at head-scratching discounts to the share price of Sirius XM.
Merging into a single class of shares, which occurred after the closing bell on Sept. 9, and effecting a 1-for-10 reverse stock split to make shares more attractive to institutional investors, may be the lure that Buffett and his investing lieutenants, Todd Combs and Ted Weschler, found enticing.
But there’s much more to appreciate about Sirius XM Holdings than just its simplified share structure and the prospect of institutional investors finding it more attractive following its unique split.
For instance, it’s the only licensed satellite-radio operator. Although this doesn’t mean it’s free of competition, being a legal monopoly does afford the company strong subscription pricing power. With Spotify Technology recently raising its subscription cost, Sirius XM has a golden opportunity to follow suit in the near future and boost its sales.
Unlike traditional radio operators, Sirius XM also has a somewhat transparent and predictable cost structure. While royalties and talent acquisition expenses are going to deviate from one quarter to the next, transmission and equipment costs generally don’t. If Sirius XM can grow its subscriber count over time, some of its expenses should remain level and provide an opportunity for margin expansion.
However, the biggest competitive edge Sirius XM brings to the table is its revenue diversity. Advertising accounts for the bulk of the revenue generated by terrestrial and online radio providers. For Sirius XM, ad revenue via Pandora, which it acquired in February 2019, makes up less than 20% of its net sales.
Lengthy economic expansions tend to help ad-driven businesses. But when recessions do occur, ad-based radio providers struggle mightily. Since Sirius XM brings in about 77% of its net sales from subscriptions, its operating cash flow is far more predictable and less susceptible to wild swings during economic downturns.
What makes Sirius XM such a screaming buy is its valuation. The company’s forward price-to-earnings (P/E) ratio of 7.5 is more or less an all-time low since the company went public 30 years ago. Tack on a 4.4% annual yield and you have a standout bargain!
Visa
The second unstoppable Warren Buffett stock that makes for a screaming buy for the remainder of 2024 (and beyond) is payment processor Visa (NYSE: V).
Visa found itself in the headlines for all the wrong reasons last week. The leading domestic payment facilitator will reportedly be sued by the U.S. Justice Department for violating antitrust law concerning its dominance in the debit card market. Although Visa has denied any wrongdoing, legal issues may weigh on sentiment in the near term.
Something else this potential DOJ antitrust suit has done is create a price dislocation that investors shouldn’t pass up.
Although the DOJ’s focus is on Visa’s debit card operations, Visa is also a juggernaut when it comes to processing credit transactions. Based on data from eMarketer, Visa accounted for $6.45 trillion in credit card network purchase volume domestically in 2023, which is more than double the $2.73 trillion that Mastercard handled. Being the go-to payment processor in the world’s No. 1 market for consumption isn’t a bad thing.
But there’s also a huge opportunity for Visa beyond domestic borders. It’s consistently reported double-digit growth in cross-border payment volume, which is reflective of most fast-paced emerging markets being chronically underbanked. Visa has deep enough pockets and strong enough cash flow to organically enter these markets, and will occasionally lean on acquisitions as a means to expand its reach (e.g., the purchase of Visa Europe in 2016).
Although it’s a subtle difference to some of its peers, Visa has avoided becoming a lender. Being able to double dip and generate fees from merchants and interest income/fees from cardholders has propelled American Express higher for decades. But lending also exposes AmEx and its peers to credit delinquencies and loan losses during economic downturns. Since Visa isn’t a lender, it’s not required to set capital aside to cover loan losses, which is a subtle but significant competitive advantage.
Time is also very much on Visa’s side. It’s a highly cyclical company that benefits from an increase in consumer and enterprise spending during lengthy periods of economic expansion. Though recessions are a perfectly normal and inevitable part of the economic cycle, they’re historically short-lived. Patience has paid off handsomely for Visa’s shareholders since it went public in March 2008.
The final puzzle piece that makes Visa a screaming buy is, naturally, its historically cheap valuation. Shares can be purchased right now for less than 25 times forward-year earnings per share, which represents a 13% discount to its average forward P/E over the trailing-five-year period.
Further, with the exception of the brief COVID-19 crash in February-March 2020, Visa hasn’t been cheaper over the last half-decade. This is what makes this market-leading Buffett stock a clear-cut buy.
Should you invest $1,000 in Sirius XM right now?
Before you buy stock in Sirius XM, consider this:
The Motley Fool Stock Advisor analyst team just identified what they believe are the 10 best stocks for investors to buy now… and Sirius XM wasn’t one of them. The 10 stocks that made the cut could produce monster returns in the coming years.
Consider when Nvidia made this list on April 15, 2005… if you invested $1,000 at the time of our recommendation, you’d have $743,952!*
Stock Advisor provides investors with an easy-to-follow blueprint for success, including guidance on building a portfolio, regular updates from analysts, and two new stock picks each month. The Stock Advisor service has more than quadrupled the return of S&P 500 since 2002*.
*Stock Advisor returns as of September 30, 2024
American Express is an advertising partner of The Ascent, a Motley Fool company. Sean Williams has positions in Mastercard, Sirius XM, and Visa. The Motley Fool has positions in and recommends Berkshire Hathaway, Mastercard, Spotify Technology, and Visa. The Motley Fool has a disclosure policy.
2 Unstoppable Warren Buffett Stocks That Are Screaming Buys for the Remainder of 2024 (and Beyond) was originally published by The Motley Fool
Acuity Brands, Nike And 3 Stocks To Watch Heading Into Tuesday
With U.S. stock futures trading lower this morning on Tuesday, some of the stocks that may grab investor focus today are as follows:
- Wall Street expects Acuity Brands, Inc. AYI to report quarterly earnings at $4.28 per share on revenue of $1.02 billion before the opening bell, according to data from Benzinga Pro. Acuity Brands shares gained 1.7% to $279.94 in after-hours trading.
- ReposiTrak, Inc. TRAK reported better-than-expected fourth-quarter financial results and increased its quarterly dividend by 10%. ReposiTrak shares gained 4.6% to $19.32 in the after-hours trading session.
- Analysts expect McCormick & Company, Incorporated MKC to post earnings at 67 cents per share on revenue of $1.67 million for the latest quarter. The company will release earnings before the markets open. McCormick shares gained 0.4% to $82.60 in the after-hours trading session.
Check out our premarket coverage here
- Biohaven Ltd. BHVN reported a proposed $250 million public offering of common shares. Biohaven shares fell 1.9% to $49.00 in the after-hours trading session.
- Analysts expect NIKE, Inc. NKE to post quarterly earnings at 52 cents per share on revenue of $11.65 million after the closing bell. Nike shares fell 0.1% to $88.31 in after-hours trading.
Check This Out:
Photo courtesy: Shutterstock
Market News and Data brought to you by Benzinga APIs
© 2024 Benzinga.com. Benzinga does not provide investment advice. All rights reserved.
Is It Worth Investing in Take-Two Based on Wall Street's Bullish Views?
The recommendations of Wall Street analysts are often relied on by investors when deciding whether to buy, sell, or hold a stock. Media reports about these brokerage-firm-employed (or sell-side) analysts changing their ratings often affect a stock’s price. Do they really matter, though?
Before we discuss the reliability of brokerage recommendations and how to use them to your advantage, let’s see what these Wall Street heavyweights think about Take-Two Interactive TTWO.
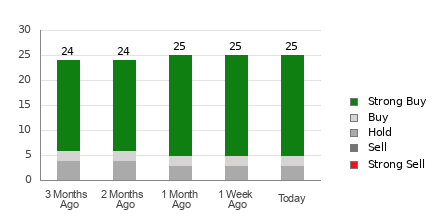
Take-Two currently has an average brokerage recommendation of 1.32, on a scale of 1 to 5 (Strong Buy to Strong Sell), calculated based on the actual recommendations (Buy, Hold, Sell, etc.) made by 25 brokerage firms. An ABR of 1.32 approximates between Strong Buy and Buy.
Of the 25 recommendations that derive the current ABR, 20 are Strong Buy and two are Buy. Strong Buy and Buy respectively account for 80% and 8% of all recommendations.
Brokerage Recommendation Trends for TTWO
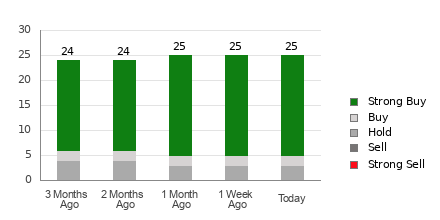
While the ABR calls for buying Take-Two, it may not be wise to make an investment decision solely based on this information. Several studies have shown limited to no success of brokerage recommendations in guiding investors to pick stocks with the best price increase potential.
Are you wondering why? The vested interest of brokerage firms in a stock they cover often results in a strong positive bias of their analysts in rating it. Our research shows that for every “Strong Sell” recommendation, brokerage firms assign five “Strong Buy” recommendations.
In other words, their interests aren’t always aligned with retail investors, rarely indicating where the price of a stock could actually be heading. Therefore, the best use of this information could be validating your own research or an indicator that has proven to be highly successful in predicting a stock’s price movement.
Zacks Rank, our proprietary stock rating tool with an impressive externally audited track record, categorizes stocks into five groups, ranging from Zacks Rank #1 (Strong Buy) to Zacks Rank #5 (Strong Sell), and is an effective indicator of a stock’s price performance in the near future. Therefore, using the ABR to validate the Zacks Rank could be an efficient way of making a profitable investment decision.
ABR Should Not Be Confused With Zacks Rank
Although both Zacks Rank and ABR are displayed in a range of 1-5, they are different measures altogether.
The ABR is calculated solely based on brokerage recommendations and is typically displayed with decimals (example: 1.28). In contrast, the Zacks Rank is a quantitative model allowing investors to harness the power of earnings estimate revisions. It is displayed in whole numbers — 1 to 5.
Analysts employed by brokerage firms have been and continue to be overly optimistic with their recommendations. Since the ratings issued by these analysts are more favorable than their research would support because of the vested interest of their employers, they mislead investors far more often than they guide.
On the other hand, earnings estimate revisions are at the core of the Zacks Rank. And empirical research shows a strong correlation between trends in earnings estimate revisions and near-term stock price movements.
In addition, the different Zacks Rank grades are applied proportionately to all stocks for which brokerage analysts provide current-year earnings estimates. In other words, this tool always maintains a balance among its five ranks.
There is also a key difference between the ABR and Zacks Rank when it comes to freshness. When you look at the ABR, it may not be up-to-date. Nonetheless, since brokerage analysts constantly revise their earnings estimates to reflect changing business trends, and their actions get reflected in the Zacks Rank quickly enough, it is always timely in predicting future stock prices.
Is TTWO a Good Investment?
In terms of earnings estimate revisions for Take-Two, the Zacks Consensus Estimate for the current year has increased 6.7% over the past month to $2.53.
Analysts’ growing optimism over the company’s earnings prospects, as indicated by strong agreement among them in revising EPS estimates higher, could be a legitimate reason for the stock to soar in the near term.
The size of the recent change in the consensus estimate, along with three other factors related to earnings estimates, has resulted in a Zacks Rank #2 (Buy) for Take-Two.
Therefore, the Buy-equivalent ABR for Take-Two may serve as a useful guide for investors.
© 2024 Benzinga.com. Benzinga does not provide investment advice. All rights reserved.

