Decoding Cava Group's Options Activity: What's the Big Picture?
Financial giants have made a conspicuous bearish move on Cava Group. Our analysis of options history for Cava Group CAVA revealed 11 unusual trades.
Delving into the details, we found 18% of traders were bullish, while 72% showed bearish tendencies. Out of all the trades we spotted, 2 were puts, with a value of $84,462, and 9 were calls, valued at $1,730,287.
Expected Price Movements
Taking into account the Volume and Open Interest on these contracts, it appears that whales have been targeting a price range from $60.0 to $140.0 for Cava Group over the last 3 months.
Analyzing Volume & Open Interest
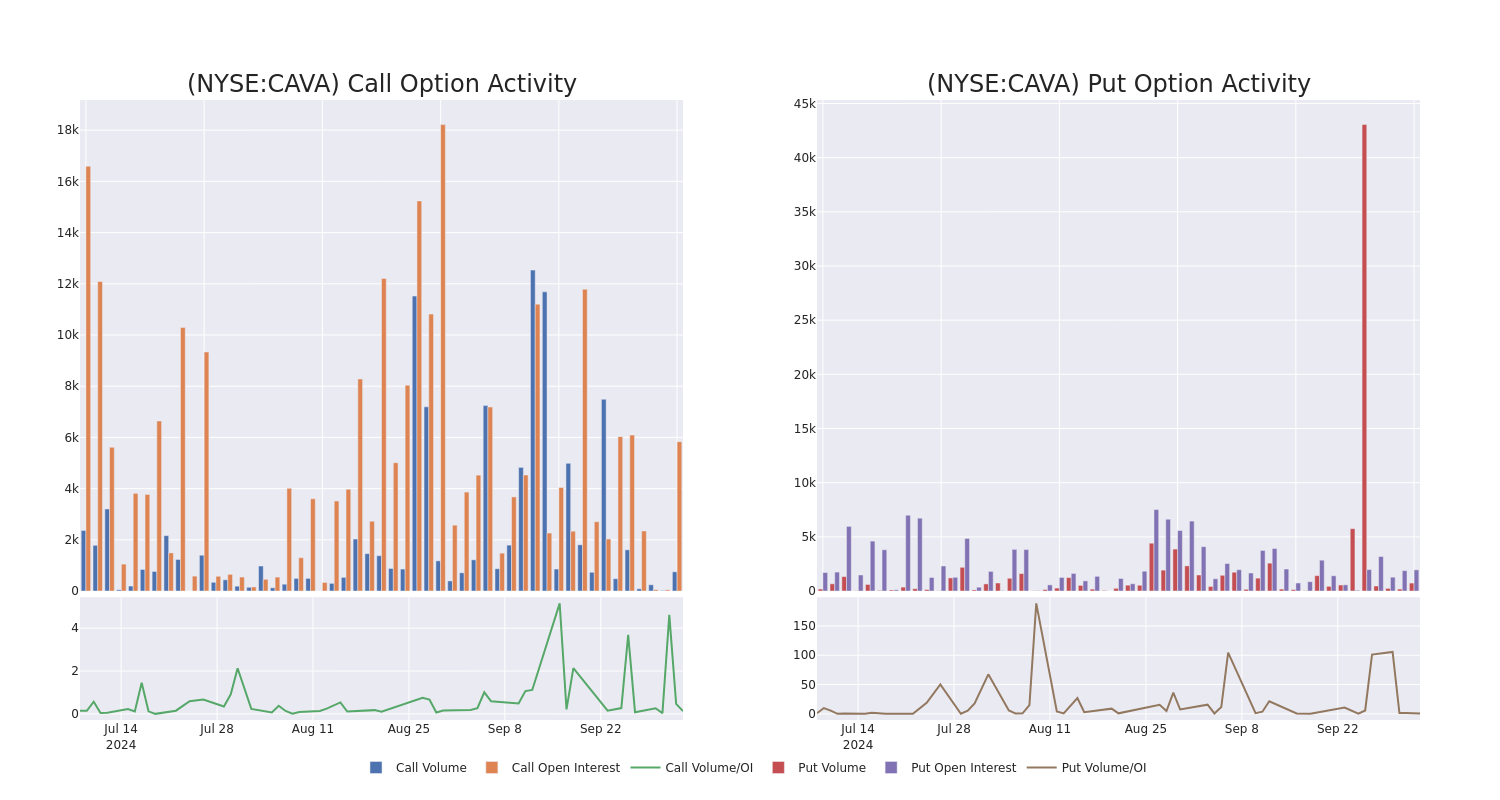
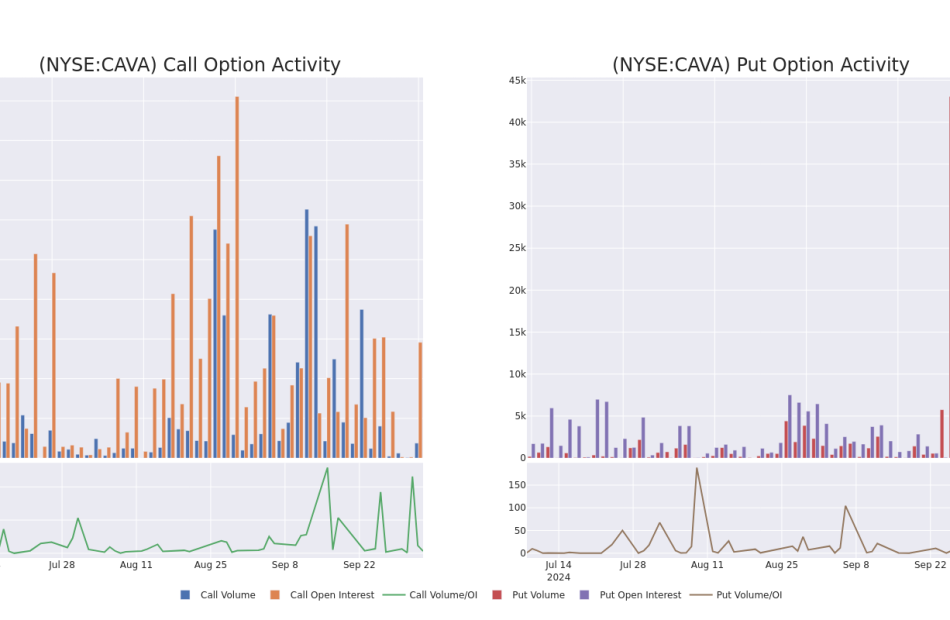
Looking at the volume and open interest is a powerful move while trading options. This data can help you track the liquidity and interest for Cava Group’s options for a given strike price. Below, we can observe the evolution of the volume and open interest of calls and puts, respectively, for all of Cava Group’s whale trades within a strike price range from $60.0 to $140.0 in the last 30 days.
Cava Group Option Activity Analysis: Last 30 Days

Biggest Options Spotted:
| Symbol | PUT/CALL | Trade Type | Sentiment | Exp. Date | Ask | Bid | Price | Strike Price | Total Trade Price | Open Interest | Volume |
|---|---|---|---|---|---|---|---|---|---|---|---|
| CAVA | CALL | SWEEP | BEARISH | 11/15/24 | $64.9 | $64.8 | $64.8 | $60.00 | $1.2M | 0 | 200 |
| CAVA | CALL | SWEEP | BEARISH | 01/17/25 | $12.1 | $12.0 | $12.0 | $135.00 | $114.0K | 547 | 0 |
| CAVA | CALL | SWEEP | BULLISH | 10/11/24 | $3.6 | $3.3 | $3.57 | $126.00 | $71.9K | 237 | 234 |
| CAVA | CALL | SWEEP | BEARISH | 12/20/24 | $14.9 | $14.2 | $14.1 | $125.00 | $70.5K | 909 | 51 |
| CAVA | CALL | SWEEP | BEARISH | 10/11/24 | $2.95 | $2.65 | $2.65 | $128.00 | $53.0K | 56 | 241 |
About Cava Group
Cava Group Inc owns and operates a chain of restaurants. It is the category-defining Mediterranean fast-casual restaurant brand, bringing together healthful food and bold, satisfying flavors at scale. The company’s dips, spreads, and dressings are centrally produced and sold in grocery stores. The company’s operations are conducted as two reportable segments: CAVA and Zoes Kitchen. The company generates the majority of its revenue from the CAVA segment.
In light of the recent options history for Cava Group, it’s now appropriate to focus on the company itself. We aim to explore its current performance.
Current Position of Cava Group
- Currently trading with a volume of 1,895,183, the CAVA’s price is up by 1.38%, now at $126.65.
- RSI readings suggest the stock is currently may be approaching overbought.
- Anticipated earnings release is in 32 days.
Professional Analyst Ratings for Cava Group
In the last month, 5 experts released ratings on this stock with an average target price of $127.6.
Turn $1000 into $1270 in just 20 days?
20-year pro options trader reveals his one-line chart technique that shows when to buy and sell. Copy his trades, which have had averaged a 27% profit every 20 days. Click here for access.
* Consistent in their evaluation, an analyst from TD Securities keeps a Buy rating on Cava Group with a target price of $130.
* An analyst from TD Cowen downgraded its action to Buy with a price target of $115.
* An analyst from TD Cowen has decided to maintain their Buy rating on Cava Group, which currently sits at a price target of $130.
* Maintaining their stance, an analyst from Argus Research continues to hold a Buy rating for Cava Group, targeting a price of $128.
* In a cautious move, an analyst from UBS downgraded its rating to Neutral, setting a price target of $135.
Options are a riskier asset compared to just trading the stock, but they have higher profit potential. Serious options traders manage this risk by educating themselves daily, scaling in and out of trades, following more than one indicator, and following the markets closely.
If you want to stay updated on the latest options trades for Cava Group, Benzinga Pro gives you real-time options trades alerts.
Market News and Data brought to you by Benzinga APIs
© 2024 Benzinga.com. Benzinga does not provide investment advice. All rights reserved.


Leave a Reply