This Chinese Real Estate Stock Just Made A Golden Cross
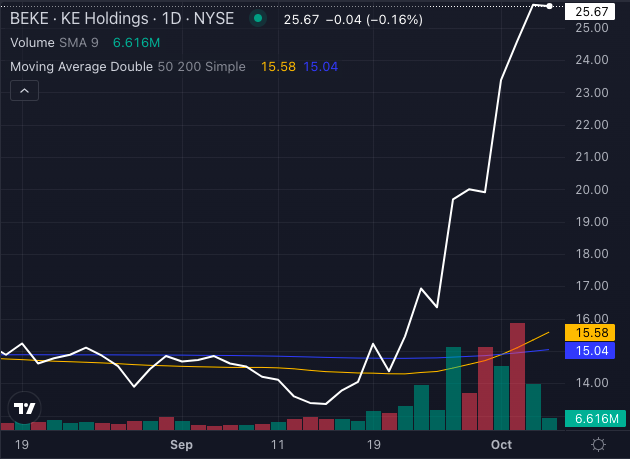
KE Holdings Inc. – ADR BEKE is turning heads in the market, and for good reason. This powerhouse in the Chinese real estate sector has surged 60.69% year to date and 71.60% in the past month alone.
As the largest online real estate transaction platform in China, KE Holdings is experiencing a robust bullish trend, but it’s the recent Golden Cross that’s getting everyone talking.
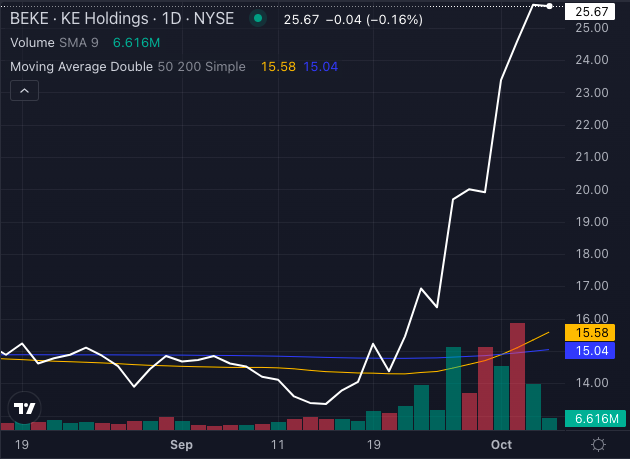
Chart created using Benzinga Pro
In technical analysis, a Golden Cross occurs when a short-term moving average crosses above a long-term moving average. For KE Holdings, this signifies a potential for continued upward momentum, capturing the attention of both traders and investors alike.
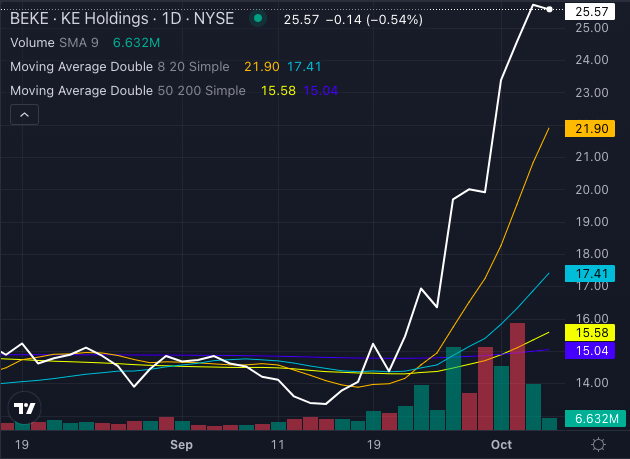
Chart created using Benzinga Pro
Currently, the stock price stands at $25.57, comfortably above its key moving averages:
- Eight-day simple moving average (SMA) is at $21.90
- 20-day SMA sits at $17.41
- 50-day SMA is $15.58
- 200-day SMA is at $15.04
These figures indicate that KE Holdings is not just on a bullish trend; it’s riding a powerful wave of buying pressure, reinforcing the bullish sentiment.
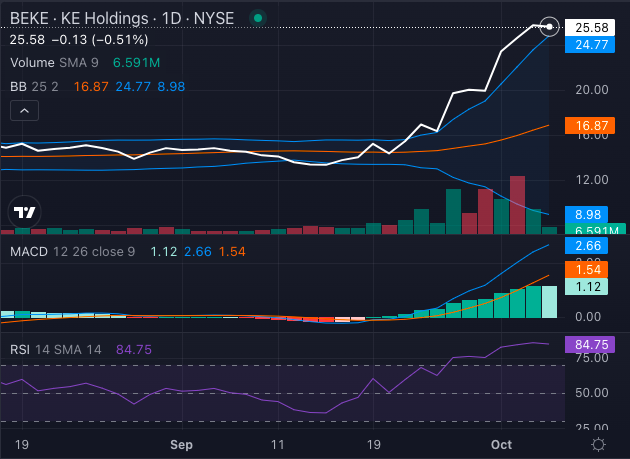
Chart created using Benzinga Pro
While the stock’s Moving Average Convergence Divergence (MACD) of 2.66 suggests bullish momentum, the Relative Strength Index (RSI) is sitting at 84.75, implying overbought conditions.
This could mean that, while bullish trends are evident, investors should brace for possible corrections ahead.
Adding to the stock’s allure, KE Holdings recently announced a series of share repurchases, including 435,000 shares on Sept. 20. This move not only demonstrates the company’s confidence in its stock value but also its commitment to enhancing shareholder returns.
With a buyback mandate in place that restricts new share issues until Oct. 20, KE Holdings is clearly signaling that it believes in its growth trajectory.
The company’s financials from the second quarter of 2024 further bolster this bullish narrative.
With total net revenues rising 19.9% year-over-year and a staggering 46.2% increase in net income, KE Holdings showcases resilience in a competitive landscape.
Particularly noteworthy is the sharp growth in its non-housing transaction services, with home renovation and furnishing revenue climbing 53.9%, and home rental services skyrocketing 167.1%.
With the recent Golden Cross signaling a potentially strong bullish trend, coupled with robust financial performance and strategic buybacks, KE Holdings’ stock presents a compelling opportunity for investors.
While the stock may currently be overbought, its solid market position and promising outlook suggest that this is one real estate player that’s not just surviving but thriving.
Read Next:
Photo: IOCool via Shutterstock
Market News and Data brought to you by Benzinga APIs
© 2024 Benzinga.com. Benzinga does not provide investment advice. All rights reserved.
A Lifetime of Passive Income Is Hiding in Plain Sight With This ETF and These 2 No-Brainer Dividend Kings
This has been another great year for the broader stock market, with the S&P 500 and Nasdaq Composite both up over 20% year to date. And with just one quarter left in 2024, the broader indexes could go nowhere or even fall slightly, and it would still be an excellent result seeing as the long-term average annual return in the S&P 500 is around 10%.
New all-time highs are great if you already have a good amount of money invested in the market, but it’s challenging if you’re looking to put new capital to work without overpaying. The good news is that there are plenty of dividend-paying stocks and exchange-traded funds (ETFs) that are still a good value.
PepsiCo (NASDAQ: PEP) and American States Water (NYSE: AWR) are two Dividend Kings that have paid and raised their dividends for over 50 consecutive years, while the Global X SuperDividend ETF (NYSEMKT: SDIV) has international exposure to a variety of high-yield names. Here’s why these three fool.com contributors think they are worth a closer look.
A buy even though its results have failed to impress
Daniel Foelber (PepsiCo): The price-to-earnings (P/E) ratio of the S&P 500 is 29.9, suggesting the market is expensive compared to historical averages. As stock prices have outpaced dividend growth, the yield of the S&P 500 has tumbled to just 1.3%.
Investors looking for value and passive income can often rely on safe and stodgy sectors like consumer staples, healthcare, and utilities. But even those sectors are hitting all-time highs, which has pushed up their valuations and lowered their yields.
PepsiCo is a rare blend of reliability, high yield, and value. It has 52 consecutive years of dividend increases, currently yields 3.2%, and has a P/E of 24.7. By comparison, a consumer staples sector ETF has a yield of 2.6% and a P/E of 28.3.
When a well-known blue chip stock is noticeably undervalued relative to its peers, chances are it’s not a fluke. Although PepsiCo has done a good job navigating inflation and cost-conscious consumers, its sales and earnings growth have been fairly disappointing. As you can see in the following chart, PepsiCo’s dividend has more than doubled over the past decade, but sales and earnings growth have been relatively poor.
The stock price has gone essentially nowhere for three years compared to solid gains in the consumer staples sector. So, some investors might be waiting for a noticeable improvement in the underlying business before buying the stock.
This fiscal year, PepsiCo is targeting earnings-per-share growth of at least 8% on a constant-currency basis, which would be a step in the right direction. But the company likely still has a long way to go before it can begin exceeding investor expectations.
PepsiCo might be off its game right now, but the company’s supply chain, marketing, and distribution give it a major advantage in growing existing brands and innovating or acquiring new brands.
Now is an excellent time for patient investors to buy PepsiCo if they are confident in the company’s international portfolio of food and beverage products, which includes Frito-Lay and Quaker Oats.
This utility’s reign as a dividend king is unlikely to end anytime soon
Scott Levine (American States Water): Companies that have earned the title of Dividend King count themselves among an elite group that has demonstrated impressive commitments to shareholders. Among this group, American States Water is a utility that reigns supreme, having amassed the longest streak of consecutive annual dividend raises: 70 years.
Those looking to generate a reliable stream of passive income for decades will certainly want to consider dipping their toes in American States Water and soaking up its 2.3% forward-yielding dividend.
A key reason the utility is so alluring for its dividend potential is its business model. Operating primarily in regulated markets, it is guaranteed certain rates of return on its investments. It provides water and wastewater services under 50-year contracts to 12 U.S. military bases — another encouraging sign for the company’s prosperity. And since many military bases aren’t privatized, management recognizes ample opportunity to achieve growth with this sort of business.
Examining its recent performance, investors will find allure in the reliable nature of the utility’s business. Over the past five years, its adjusted earnings per share had a 9.8% compound annual growth rate (CAGR), from $1.72 in 2018 to $2.75 in 2023.
And management’s focus on hiking the payout at the same rate demonstrates a financially responsible approach to rewarding shareholders. During the same five-year period, American States Water boosted its dividend at an 8.8% CAGR, a period during which it averaged a 56.5% payout ratio.
American States Water deserves serious attention for those eager to find a conservative approach to generating a lifetime stream of passive income.
A dividend ETF yielding 6.1%
Lee Samaha (Global X SuperDividend ETF): Picking winners in the high-yield equities sector is never easy. After all, there’s often a reason why the market assigns an equity a high yield, and it usually reflects a concern that the dividend isn’t sustainable. As such, it makes sense to diversify the stock-specific risk by holding multiple equities.
While that might prove costly in practice, buying into a high-yield exchange-traded fund (ETF) like the Global X SuperDividend ETF is always possible.
The fund’s strategy is to buy 50 of the highest-yielding U.S. equities and pay a monthly distribution to investors. Currently yielding 6.1% and with a reasonable 0.45% expense ratio, the fund offers a good way to get exposure to high-yield stocks.
As always, any mechanical-based strategy tends to result in an unintentional style or sector bias. In this case, following a high-yield strategy results in almost 67% of the ETF’s holdings being in utilities, real estate, energy, and consumer staples.
In contrast, just 2% is in information technology and 1.7% in consumer discretionary. Still, if you want high-yield stocks, monthly income, and exposure to interest-rate sensitive stocks, then the Global X SuperDividend ETF is a good option and capable of generating solid returns over the long term.
Should you invest $1,000 in PepsiCo right now?
Before you buy stock in PepsiCo, consider this:
The Motley Fool Stock Advisor analyst team just identified what they believe are the 10 best stocks for investors to buy now… and PepsiCo wasn’t one of them. The 10 stocks that made the cut could produce monster returns in the coming years.
Consider when Nvidia made this list on April 15, 2005… if you invested $1,000 at the time of our recommendation, you’d have $728,325!*
Stock Advisor provides investors with an easy-to-follow blueprint for success, including guidance on building a portfolio, regular updates from analysts, and two new stock picks each month. The Stock Advisor service has more than quadrupled the return of S&P 500 since 2002*.
*Stock Advisor returns as of September 30, 2024
Daniel Foelber has no position in any of the stocks mentioned. Lee Samaha has no position in any of the stocks mentioned. Scott Levine has no position in any of the stocks mentioned. The Motley Fool has no position in any of the stocks mentioned. The Motley Fool has a disclosure policy.
A Lifetime of Passive Income Is Hiding in Plain Sight With This ETF and These 2 No-Brainer Dividend Kings was originally published by The Motley Fool
Here's How Much You'd Have If You Invested $1000 in Eaton a Decade Ago
For most investors, how much a stock’s price changes over time is important. Not only can it impact your investment portfolio, but it can also help you compare investment results across sectors and industries.
The fear of missing out, or FOMO, also plays a factor in investing, especially with particular tech giants, as well as popular consumer-facing stocks.
What if you’d invested in Eaton ETN ten years ago? It may not have been easy to hold on to ETN for all that time, but if you did, how much would your investment be worth today?
Eaton’s Business In-Depth
With that in mind, let’s take a look at Eaton’s main business drivers.
Dublin, Ireland-based Eaton Corporation plc is a diversified power management company and a global technology leader in electrical components and systems. It sells products in more than 175 countries and has in excess of 85,000 employees. The company was founded in 1911.
Eaton’s current reportable segments are Electrical Americas, Electrical Global, Aerospace, Vehicle and eMobility.
The Electrical Americas segment includes sales contracts that are primarily for electrical and industrial components, power distribution and assemblies, residential products, single and three-phase power quality, wiring devices, circuit protection, utility power distribution, power reliability equipment, as well as services that are primarily produced and sold in North and South America. The Electrical Global segment consists of the same activities as mentioned in Electrical Americas but is primarily produced and sold outside of North and South America.
The Vehicle segment includes the Truck and Automotive subsegments. The truck segment designs, manufactures and markets powertrain systems and other components for commercial vehicle markets. The aerospace segment is a supplier of aerospace fuel and hydraulic and pneumatic systems for commercial and military use.
The eMobility segment focuses on two technologies within electric vehicles, namely Power electronics & conversion and Power distribution & circuit protection.
Eaton’s segments — Electrical Americas, Electrical Global, Aerospace, Vehicle and eMobility — contributed 44.8%, 25.4%, 15%, 12% and 2.8%, respectively, to 2023 revenues.
Bottom Line
Anyone can invest, but building a successful investment portfolio takes a combination of a few things: research, patience, and a little bit of risk. So, if you had invested in Eaton a decade ago, you’re probably feeling pretty good about your investment today.
According to our calculations, a $1000 investment made in October 2014 would be worth $5,177.51, or a gain of 417.75%, as of October 4, 2024, and this return excludes dividends but includes price increases.
The S&P 500 rose 189.65% and the price of gold increased 114.20% over the same time frame in comparison.
Going forward, analysts are expecting more upside for ETN.
Eaton benefits from its research and development work that allows to develop new products. Eaton is aided by rising demand from the new AI data center and contributions from its organic assets. Eaton is expanding via acquisitions and its strategy to manufacture in the region of its end market has helped the company to reduce expenses. Reindustrialization and megatrends will create more opportunities for Eaton. Its shares have outperformed the industry in the past year. Our model projects revenues to increase in 2024-26 period. Yet, Eaton’s global operations expose it to unpredictable currency translation, cyber security threats, changes in tax rates and security breaches, which might impact operations. The shortage of raw materials and supplier insolvencies might impact production and operations.
Shares have gained 14.43% over the past four weeks and there have been 6 higher earnings estimate revisions for fiscal 2024 compared to none lower. The consensus estimate has moved up as well.
© 2024 Benzinga.com. Benzinga does not provide investment advice. All rights reserved.
Medicare shake-up sends Humana stock down 23% in a week for its worst drop since 2009
-
Humana’s stock is down 23% in its worst weekly drop since 2020 and biggest two-day decline since 2009.
-
The drop comes as Medicare downgraded ratings on some of Humana’s health insurance plans.
-
The move is expected to be a drag on the company’s revenue and customer base.
It’s been a tough week for Humana.
The health insurer’s shares are down 23% since the start of the week, marking its biggest weekly drop since 2020 and its biggest two-day decline in 15 years.
The shares were up about 2% on Friday to trade at $246.80. They began the week at around $320 a share.
The tailspin comes as Medicare plans to downgrade several of Humana’s key health insurance plans, which will limit the extra revenue those plans pull in from government payouts starting next year.
The news first circulated on Tuesday, and on Wednesday, the company confirmed the news in a statement, sending the stock down 24% in the first five minutes of trading.
Over those days, the stock declined 22%, the biggest two-day drop since the financial crisis in 2009. The shares are on track for their worst week since 2020.
Medicare’s quality ratings are crucial revenue drivers for Medicare Advantage insurers like Humana, which receive government bonus payments for higher star ratings. Lower ratings, on the other hand, deter customers. The ratings fall on a scale of one to five.
With the new ratings shake-up, now only 25% of Humana’s customers will fall under its four-star or higher plans, down from 94%, the company said in a statement.
In a Wednesday note, UBS analysts led by AJ Rice said Humana’s downgrades are the “worse case scenario for stars.”
The company says it is working to regain its ratings, and is appealing the changes.
Bank of America analysts say that full recovery could take longer than expected, though. The analysts downgraded the stock to underperform on Wednesday, cutting its price objective by 34% to $247.
They said Medicare Advantage plans could see further pressure if Democrats win in the upcoming elections, which would hinder Humana’s recovery.
“The timing of the recovery is far from guaranteed, particularly if the election results in a win for Democrats and MA plans are pressured as they are demonstrating here with lower Stars,” the analysts said, adding that Humana faces tough competition with peers like UNH.
“We think there is a risk that HUM loses some market share,” the analysts said.
Read the original article on Business Insider
Decoding Cava Group's Options Activity: What's the Big Picture?
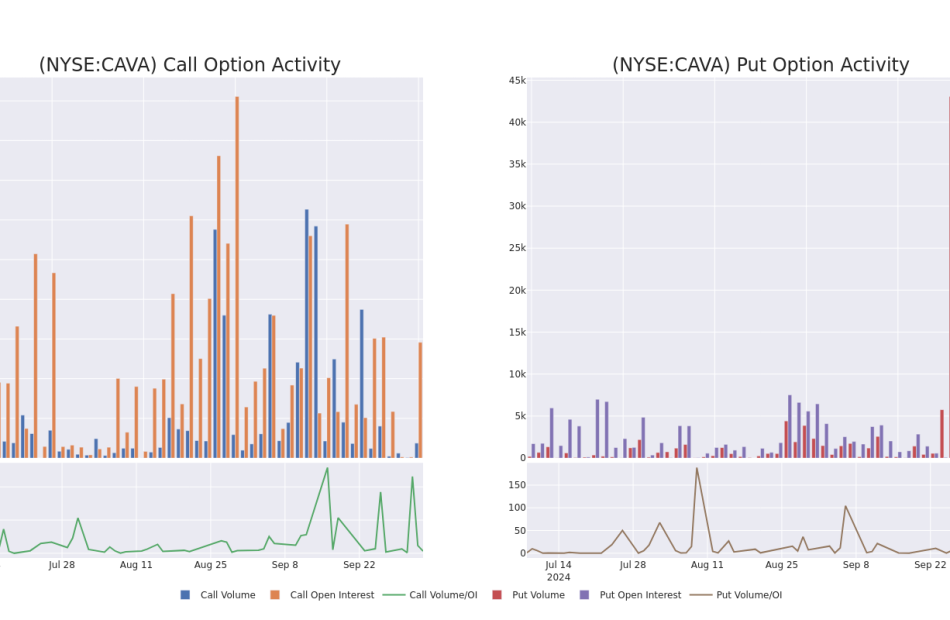
Financial giants have made a conspicuous bearish move on Cava Group. Our analysis of options history for Cava Group CAVA revealed 11 unusual trades.
Delving into the details, we found 18% of traders were bullish, while 72% showed bearish tendencies. Out of all the trades we spotted, 2 were puts, with a value of $84,462, and 9 were calls, valued at $1,730,287.
Expected Price Movements
Taking into account the Volume and Open Interest on these contracts, it appears that whales have been targeting a price range from $60.0 to $140.0 for Cava Group over the last 3 months.
Analyzing Volume & Open Interest
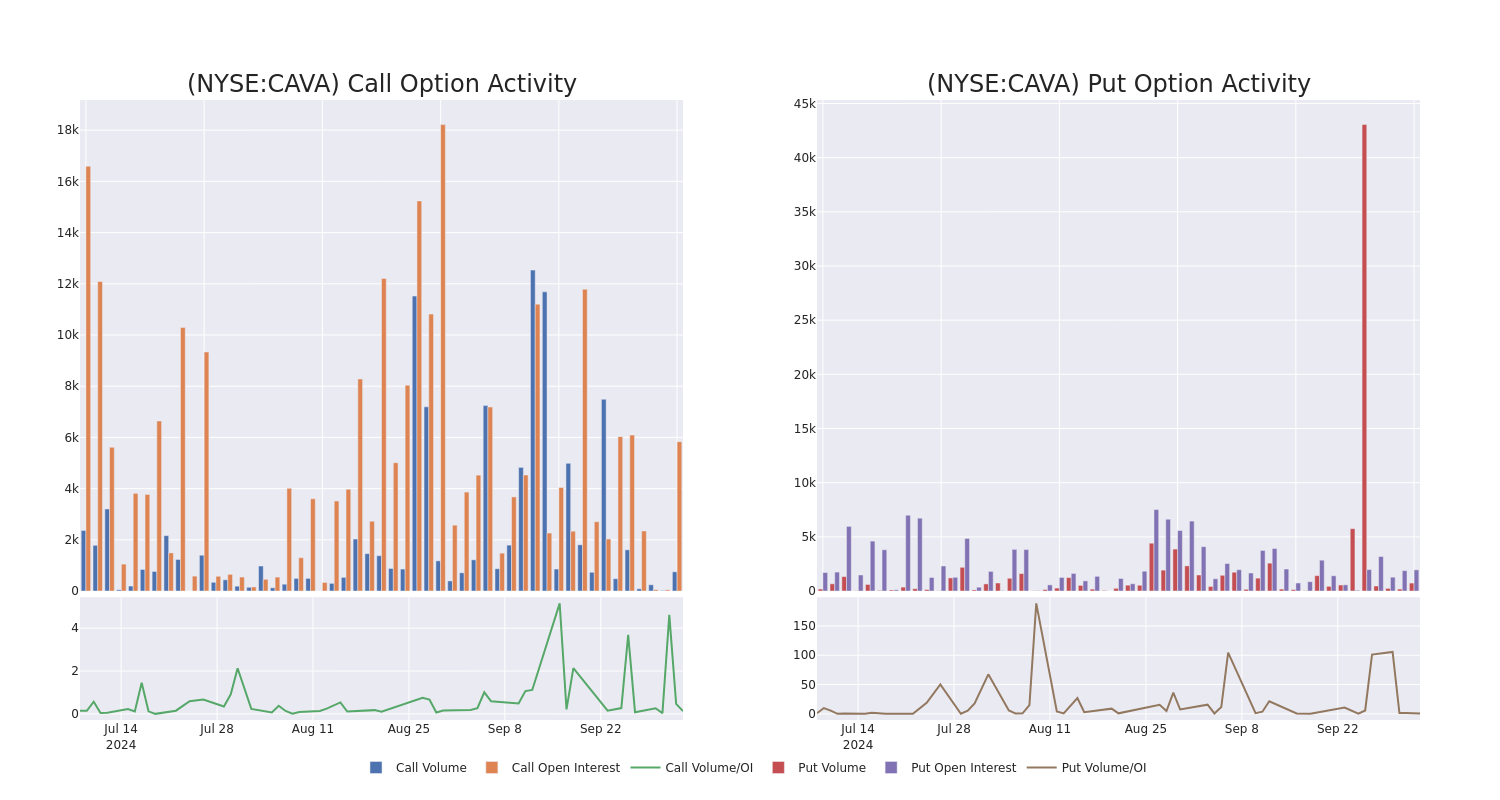
Looking at the volume and open interest is a powerful move while trading options. This data can help you track the liquidity and interest for Cava Group’s options for a given strike price. Below, we can observe the evolution of the volume and open interest of calls and puts, respectively, for all of Cava Group’s whale trades within a strike price range from $60.0 to $140.0 in the last 30 days.
Cava Group Option Activity Analysis: Last 30 Days
Biggest Options Spotted:
| Symbol | PUT/CALL | Trade Type | Sentiment | Exp. Date | Ask | Bid | Price | Strike Price | Total Trade Price | Open Interest | Volume |
|---|---|---|---|---|---|---|---|---|---|---|---|
| CAVA | CALL | SWEEP | BEARISH | 11/15/24 | $64.9 | $64.8 | $64.8 | $60.00 | $1.2M | 0 | 200 |
| CAVA | CALL | SWEEP | BEARISH | 01/17/25 | $12.1 | $12.0 | $12.0 | $135.00 | $114.0K | 547 | 0 |
| CAVA | CALL | SWEEP | BULLISH | 10/11/24 | $3.6 | $3.3 | $3.57 | $126.00 | $71.9K | 237 | 234 |
| CAVA | CALL | SWEEP | BEARISH | 12/20/24 | $14.9 | $14.2 | $14.1 | $125.00 | $70.5K | 909 | 51 |
| CAVA | CALL | SWEEP | BEARISH | 10/11/24 | $2.95 | $2.65 | $2.65 | $128.00 | $53.0K | 56 | 241 |
About Cava Group
Cava Group Inc owns and operates a chain of restaurants. It is the category-defining Mediterranean fast-casual restaurant brand, bringing together healthful food and bold, satisfying flavors at scale. The company’s dips, spreads, and dressings are centrally produced and sold in grocery stores. The company’s operations are conducted as two reportable segments: CAVA and Zoes Kitchen. The company generates the majority of its revenue from the CAVA segment.
In light of the recent options history for Cava Group, it’s now appropriate to focus on the company itself. We aim to explore its current performance.
Current Position of Cava Group
- Currently trading with a volume of 1,895,183, the CAVA’s price is up by 1.38%, now at $126.65.
- RSI readings suggest the stock is currently may be approaching overbought.
- Anticipated earnings release is in 32 days.
Professional Analyst Ratings for Cava Group
In the last month, 5 experts released ratings on this stock with an average target price of $127.6.
Turn $1000 into $1270 in just 20 days?
20-year pro options trader reveals his one-line chart technique that shows when to buy and sell. Copy his trades, which have had averaged a 27% profit every 20 days. Click here for access.
* Consistent in their evaluation, an analyst from TD Securities keeps a Buy rating on Cava Group with a target price of $130.
* An analyst from TD Cowen downgraded its action to Buy with a price target of $115.
* An analyst from TD Cowen has decided to maintain their Buy rating on Cava Group, which currently sits at a price target of $130.
* Maintaining their stance, an analyst from Argus Research continues to hold a Buy rating for Cava Group, targeting a price of $128.
* In a cautious move, an analyst from UBS downgraded its rating to Neutral, setting a price target of $135.
Options are a riskier asset compared to just trading the stock, but they have higher profit potential. Serious options traders manage this risk by educating themselves daily, scaling in and out of trades, following more than one indicator, and following the markets closely.
If you want to stay updated on the latest options trades for Cava Group, Benzinga Pro gives you real-time options trades alerts.
Market News and Data brought to you by Benzinga APIs
© 2024 Benzinga.com. Benzinga does not provide investment advice. All rights reserved.
Artificial Urinary Sphincter Implantation Device Market to Reach $1.1 Billion, Globally, by 2033 at 7.2% CAGR: Allied Market Research
Wilmington, Delaware, Oct. 04, 2024 (GLOBE NEWSWIRE) — Allied Market Research published a report, titled, “Artificial Urinary Sphincter Implantation Device Market by Type (AMS 800 and Other), by Gender (Male and Female), and End User (Hospitals, Specialty Clinics and Ambulatory Surgery Centers): Global Opportunity Analysis and Industry Forecast, 2024-2033″. According to the report, the artificial urinary sphincter implantation device market was valued at $0.5 billion in 2023, and is estimated to reach $1.1 billion by 2033, growing at a CAGR of 7.2% from 2024 to 2033.
Request Sample of the Report on Artificial Urinary Sphincter Implantation Device Market 2033 – https://www.alliedmarketresearch.com/request-sample/A324368
Prime Determinants of Growth
Major factor driving the growth of the artificial urinary sphincter implantation device market are increasing rising prevalence of urinary incontinence, particularly among the geriatric population, technological advancement and increase in healthcare expenditure. As the geriatric population increases, the incidence of urinary incontinence increases, thereby boosting the demand for effective incontinence management solutions. Technological advancements in artificial urinary sphincter implantation devices, such as improvements in device durability, miniaturization, and patient-friendly features, are also propelling market growth. Enhanced designs that reduce complications and improve patient outcomes make these devices more appealing to both patients and healthcare providers.
Moreover, increasing awareness and acceptance of artificial urinary sphincter implantation device implantation as a viable treatment option for severe incontinence are contributing to market expansion. Healthcare professionals are more frequently recommending AUS devices due to their proven efficacy and the growing body of positive clinical evidence supporting their use. Reimbursement policies in developed regions like North America and Europe are another significant factor, as favorable insurance coverage reduces out-of-pocket expenses for patients, thereby encouraging more individuals to opt for the procedure.
Report Coverage & Details
| Repot Coverage | Details |
| Forecast Period | 2024–2033 |
| Base Year | 2023 |
| Market Size in 2023 | $0.5 billion |
| Market Size in 2033 | $1.1 billion |
| CAGR | 7.2% |
| No. of Pages in Report | 280 |
| Segments Covered | Type, Gender, End User and Region |
| Drivers |
|
| Opportunities |
|
| Restraint |
|
Want to Explore More, Connect to our Analyst – https://www.alliedmarketresearch.com/connect-to-analyst/A324368
Segment Highlights
The AMS 800 segment dominated market share in 2023
By type, AMS 800 segment dominated the market share in 2023. This is attributed to the fact that AMS 800 device is widely recognized for its high efficacy and reliability in treating urinary incontinence, particularly in patients with severe or recurrent incontinence following prostate surgery. Its long-standing presence in the market, backed by extensive clinical data and positive patient outcomes, has established it as the gold standard among artificial urinary sphincter implantation devices.
Female segment dominated the market share in 2023
By gender, female segment dominated the market share in 2023. This is attributed to high prevalence of urinary incontinence among women. Urinary incontinence often arises due to childbirth, menopause, and other gynecological issues, creating a substantial demand for effective treatment options like artificial urinary sphincter implantation devices. Additionally, there has been a growing awareness and acceptance of medical interventions to address incontinence among women, leading to increased adoption of these devices.
Hospital segment dominated market share in 2023
By end user, hospital segment dominated the market share in 2023. This is attributed to the fact that hospitals serve as primary settings for complex surgical procedures like artificial urinary sphincter implantation, which require advanced medical infrastructure and highly skilled urologists. The comprehensive care offered in hospitals, including preoperative assessments, sophisticated surgical facilities, and postoperative monitoring, ensures a higher success rate for such intricate procedures.
Regional Outlook
North America holds a dominant position in the market, attributed to high adoption of the artificial urinary sphincter implantation device, advanced healthcare infrastructure, supportive regulatory frameworks, and increasing prevalence of urinary incontinence. In addition, the strong presence of major key players and high research and development activities in the region for development of advanced artificial urinary sphincter implantation device is expected to contribute in the growth of the market. However, Asia-Pacific region is expected to register highest CAGR in the forecast period. This is attributed to technological advancements, rise in geriatric population, and developing healthcare infrastructure.
For Purchase Related Queries/Inquiry – https://www.alliedmarketresearch.com/purchase-enquiry/A324368
Key Players
- Boston Scientific Corporation
- Zephyr Surgical Implants
- Rules-Based Medicine
- GT Urological LLC
- Uromedica, Inc
- MyoPowers Medical Technologies SAS
- Promedon SA
- UroMems, Inc
- CooperSurgical Inc
- Laborie Medical Technologies Inc
The report provides a detailed analysis of these key players in the global artificial urinary sphincter implantation device market. These players have adopted different strategies such as acquisition and product development to increase their market share and maintain dominant shares in different regions. The report is valuable in highlighting business performance, operating segments, product portfolio, and strategic moves of market players to showcase the competitive scenario.
Get Customized Reports with your Requirements – https://www.alliedmarketresearch.com/request-for-customization/A324368
Recent Developments in Artificial Urinary Sphincter Implantation Device Market Worldwide
- In January 2022, ICU Medical, Inc. acquired Smith’s Medical, a medical device company. This helped the company gain a strong position on a global level in the medical industry & technology sector.
- In February 2024, UroMems announced that it has successfully met the six-month primary endpoint for the first-ever female patient implanted with the UroActive System, the first smart automated artificial urinary sphincter (AUS) to treat stress urinary incontinence.
- In March 2024, Affluent Medical announced the successful first-in-human implantation of the minimally invasive medical device Artus for the treatment of urinary incontinence.
Trending Reports in Healthcare Industry:
Automated Liquid Handling Market – Global Opportunity Analysis and Industry Forecast, 2023-2032
Hearing Care Devices Market – Global Opportunity Analysis and Industry Forecast, 2023-2032
Implantable Defibrillators Market – Global Opportunity Analysis and Industry Forecast, 2023-2032
Animal Vaccines Market – Global Opportunity Analysis and Industry Forecast, 2023-2032
AVENUE- A Subscription-Based Library (Premium on-demand, subscription-based pricing model) Offered by Allied Market Research:
AMR introduces its online premium subscription-based library Avenue, designed specifically to offer cost-effective, one-stop solution for enterprises, investors, and universities. With Avenue, subscribers can avail an entire repository of reports on more than 2,000 niche industries and more than 12,000 company profiles. Moreover, users can get an online access to quantitative and qualitative data in PDF and Excel formats along with analyst support, customization, and updated versions of reports.
Get an access to the library of reports at any time from any device and anywhere. For more details, follow the link: https://www.alliedmarketresearch.com/library-access
About Allied Market Research:
Allied Market Research (AMR) is a full-service market research and business-consulting wing of Allied Analytics LLP based in Wilmington, Delaware. Allied Market Research provides global enterprises as well as medium and small businesses with unmatched quality of “Market Research Reports” and “Business Intelligence Solutions.” AMR has a targeted view to provide business insights and consulting to assist its clients to make strategic business decisions and achieve sustainable growth in their respective market domains. AMR offers its services across 11 industry verticals including Life Sciences, Consumer Goods, Materials & Chemicals, Construction & Manufacturing, Food & Beverages, Energy & Power, Semiconductor & Electronics, Automotive & Transportation, ICT & Media, Aerospace & Defense, and BFSI.
We are in professional corporate relations with various companies and this helps us in digging out market data that helps us generate accurate research data tables and confirms utmost accuracy in our market forecasting. Allied Market Research CEO Pawan Kumar is instrumental in inspiring and encouraging everyone associated with the company to maintain high quality of data and help clients in every way possible to achieve success. Each and every data presented in the reports published by us is extracted through primary interviews with top officials from leading companies of domain concerned. Our secondary data procurement methodology includes deep online and offline research and discussion with knowledgeable professionals and analysts in the industry.
Contact
David Correa
1209 Orange Street,
Corporation Trust Center,
Wilmington, New Castle,
Delaware 19801 USA.
Toll Free: +1-800-792-5285
Int’l: +1-503-894-6022
UK: +44-845-528-1300
Hong Kong: +852-301-84916
India (Pune): +91-20-66346060
Fax: +1-855-550-5975
Web: https://www.alliedmarketresearch.com
Follow Us on: LinkedIn Twitter

© 2024 Benzinga.com. Benzinga does not provide investment advice. All rights reserved.
Intel Declines 56% YTD: Should You Rethink Investing in INTC Stock?
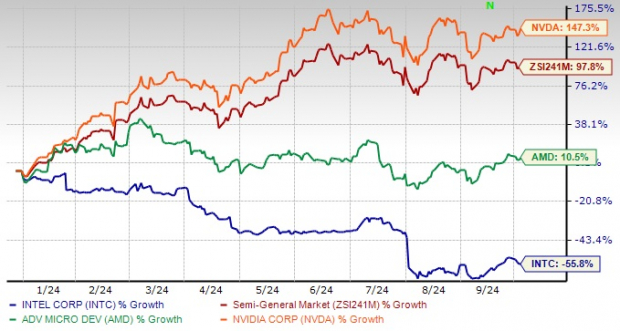
Intel Corporation INTC has plunged 55.8% year to date against the industry’s growth of 97.8%, lagging its peers Advanced Micro Devices, Inc. and NVIDIA Corporation. Much of this underperformance is due to severe financial difficulties and operational challenges, which have forced management to undertake a comprehensive review of its businesses.
Intel is mulling various options, including the potential split of its product design and manufacturing divisions and evaluating which factory projects should be terminated. It also plans to establish Intel Foundry as an independent subsidiary to unlock strategic benefits and improve capital efficiency with clearer separation and independence from the rest of Intel. The division incurred an operating loss of $2.8 billion in the last reported quarter.
YTD Price Performance

Image Source: Zacks Investment Research
INTC Plagued by Margin Woes
Intel is expanding its artificial intelligence footprint to edge devices and PCs with its Core Ultra processors, supporting more than 100 software vendors and 300 AI models. The new Lunar Lake architecture, featuring advanced graphics and AI processing power, promises significant performance and energy efficiency improvements. Additionally, Intel’s updates on next-generation products across all segments of enterprise AI, including the new Intel Xeon 6 processors and Intel Core Ultra client processors, further solidify its position as a frontrunner in the AI revolution.
The company has introduced the Intel Gaudi 3 accelerator and a suite of open, scalable systems for AI adoption across various sectors. Equipped with up to tens of thousands of accelerators interconnected through Ethernet, the Gaudi 3 accelerator promises a substantial boost in AI training and inference capabilities, enabling global enterprises to deploy AI at scale with ease.
However, an accelerated ramp-up of AI PCs for an early-mover advantage has significantly affected its short-term margins, as Intel shifted production to its high-volume facility in Ireland, where wafer costs are typically higher. Margins were also adversely impacted by higher charges related to non-core businesses, charges associated with unused capacity and an unfavorable product mix. Competitive pricing pressures from rivals have further dented its profitability.

Image Source: Zacks Investment Research
Soft China Market, Frigid Trade Ties Hurt INTC
China accounted for more than 27% of Intel’s total revenues in 2023, making it the single largest market for the company. However, the communist nation’s purported move to replace U.S.-made chips with domestic alternatives significantly affected its revenue prospects. The recent directive to phase out foreign chips from key telecom networks by 2027 underscores Beijing’s accelerating efforts to reduce reliance on Western technology amid escalating U.S.-China tensions.
As Washington tightens restrictions on high-tech exports to China, Beijing has intensified its push for self-sufficiency in critical industries. This shift poses a dual challenge for Intel, as it faces potential market restrictions and increased competition from domestic chipmakers. The second-quarter 2024 revenues were adversely impacted by the revocation of certain licenses for exports of consumer-related items to a customer in China.
Moreover, weaker spending across consumer and enterprise markets, especially in China, resulted in elevated customer inventory levels. Management expects customers to reduce inventory over the second half of the year, resulting in soft demand trends. Strict export control measures are further likely to affect the market dynamics, leading to below-par revenue growth in the near term, with the client business flat to down and modest growth in data center and edge markets.
Estimate Revision Trend of INTC
Earnings estimates for Intel for 2024 have moved down 83.9% to 27 cents over the past year, while the same for 2025 has declined 41.1% to $1.09. The negative estimate revision depicts bearish sentiments for the stock.

Image Source: Zacks Investment Research
End Note
Intel’s innovative AI solutions hold immense promise for the broader semiconductor ecosystem. By addressing the challenges of scalability, performance and interoperability, it is paving the way for widespread AI adoption across enterprises worldwide.
However, with a Zacks Rank #4 (Sell), it appears that the recent product launches are “too little too late” for Intel. In addition, margin woes amid strict export restrictions, unfavorable product mix and elevated customer inventory levels weigh on its bottom line. With declining earnings estimates and abysmal price performance compared with its peers, the stock is witnessing a negative investor perception. Consequently, it might not be prudent to bet on the stock at the moment.
Market News and Data brought to you by Benzinga APIs
© 2024 Benzinga.com. Benzinga does not provide investment advice. All rights reserved.
Unpacking the Latest Options Trading Trends in Texas Instruments
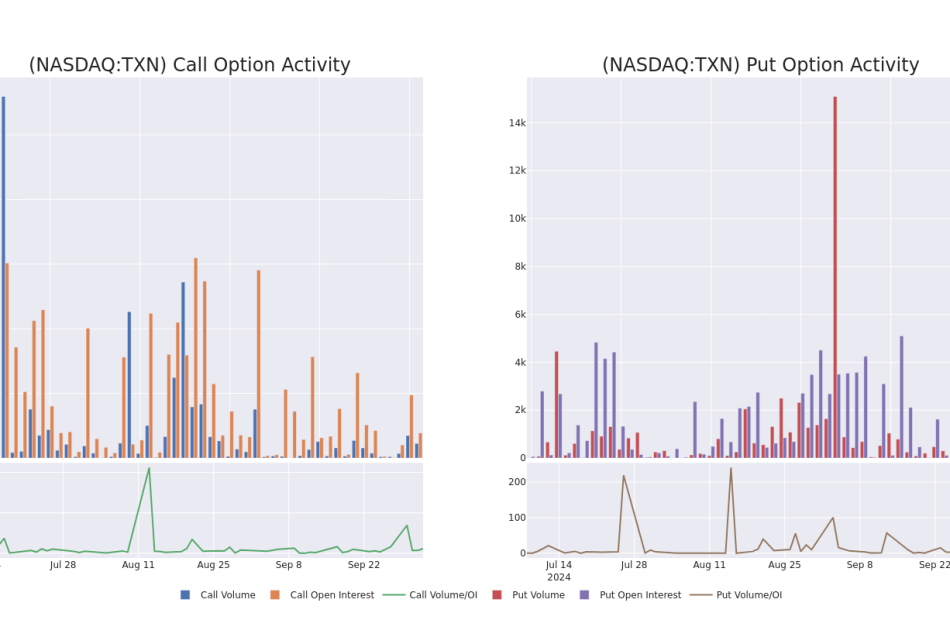
Deep-pocketed investors have adopted a bearish approach towards Texas Instruments TXN, and it’s something market players shouldn’t ignore. Our tracking of public options records at Benzinga unveiled this significant move today. The identity of these investors remains unknown, but such a substantial move in TXN usually suggests something big is about to happen.
We gleaned this information from our observations today when Benzinga’s options scanner highlighted 9 extraordinary options activities for Texas Instruments. This level of activity is out of the ordinary.
The general mood among these heavyweight investors is divided, with 44% leaning bullish and 55% bearish. Among these notable options, 5 are puts, totaling $337,703, and 4 are calls, amounting to $406,592.
Expected Price Movements
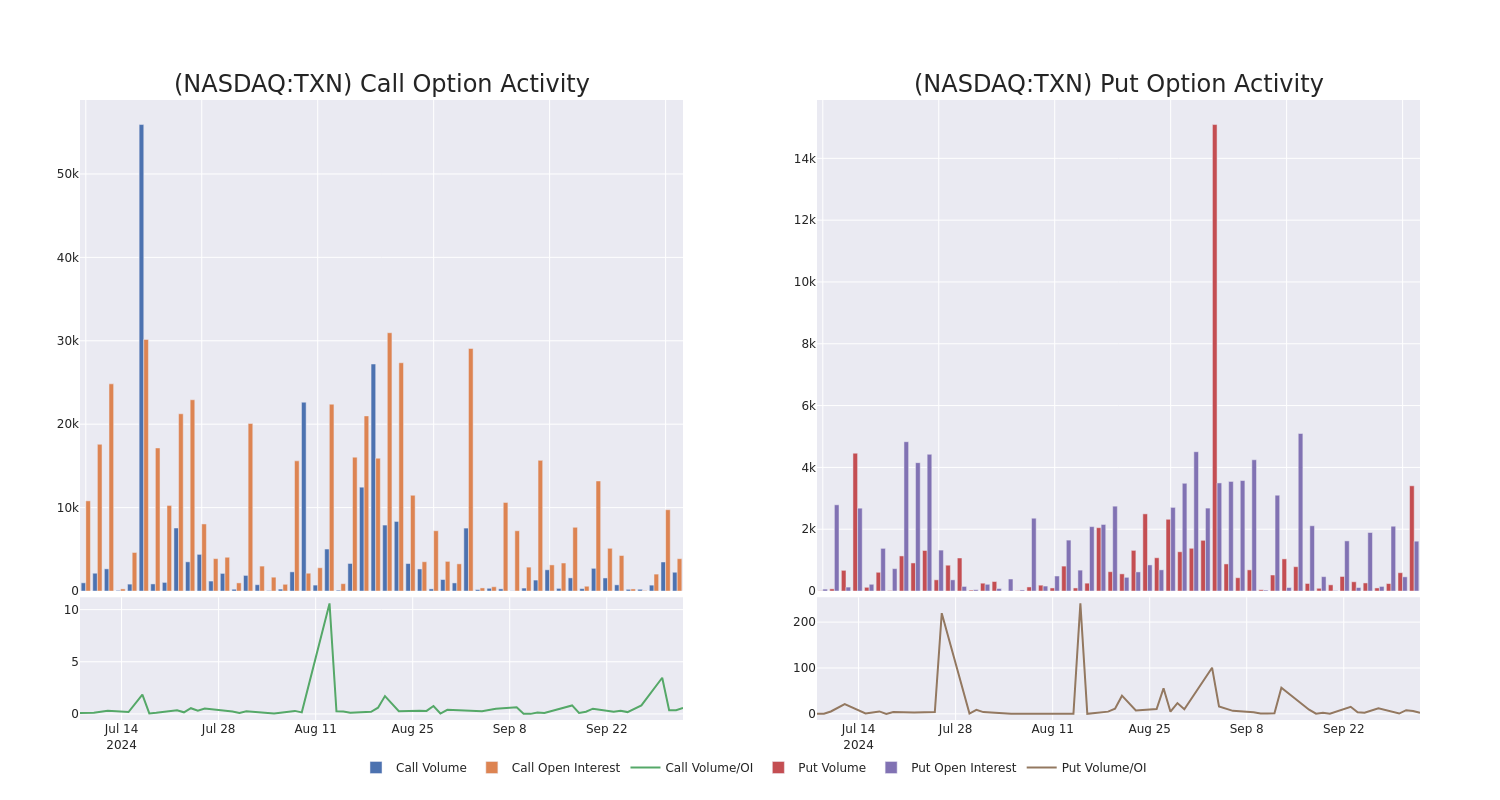
Taking into account the Volume and Open Interest on these contracts, it appears that whales have been targeting a price range from $200.0 to $215.0 for Texas Instruments over the last 3 months.
Analyzing Volume & Open Interest
Assessing the volume and open interest is a strategic step in options trading. These metrics shed light on the liquidity and investor interest in Texas Instruments’s options at specified strike prices. The forthcoming data visualizes the fluctuation in volume and open interest for both calls and puts, linked to Texas Instruments’s substantial trades, within a strike price spectrum from $200.0 to $215.0 over the preceding 30 days.
Texas Instruments Call and Put Volume: 30-Day Overview
Significant Options Trades Detected:
| Symbol | PUT/CALL | Trade Type | Sentiment | Exp. Date | Ask | Bid | Price | Strike Price | Total Trade Price | Open Interest | Volume |
|---|---|---|---|---|---|---|---|---|---|---|---|
| TXN | CALL | SWEEP | BULLISH | 10/11/24 | $2.65 | $2.64 | $2.65 | $205.00 | $198.8K | 1.3K | 614 |
| TXN | PUT | SWEEP | BEARISH | 03/21/25 | $18.95 | $18.6 | $18.95 | $210.00 | $117.4K | 184 | 123 |
| TXN | CALL | SWEEP | BULLISH | 11/15/24 | $11.7 | $11.65 | $11.7 | $200.00 | $117.0K | 909 | 0 |
| TXN | PUT | SWEEP | BEARISH | 03/21/25 | $18.95 | $18.65 | $18.95 | $210.00 | $115.5K | 184 | 61 |
| TXN | CALL | SWEEP | BULLISH | 11/08/24 | $3.85 | $3.8 | $3.85 | $215.00 | $47.3K | 5 | 138 |
About Texas Instruments
Dallas-based Texas Instruments generates over 95% of its revenue from semiconductors and the remainder from its well-known calculators. Texas Instruments is the world’s largest maker of analog chips, which are used to process real-world signals such as sound and power. Texas Instruments also has a leading market share position in processors and microcontrollers used in a wide variety of electronics applications.
Having examined the options trading patterns of Texas Instruments, our attention now turns directly to the company. This shift allows us to delve into its present market position and performance
Present Market Standing of Texas Instruments
- With a trading volume of 1,854,754, the price of TXN is up by 2.15%, reaching $206.0.
- Current RSI values indicate that the stock is may be approaching overbought.
- Next earnings report is scheduled for 18 days from now.
Unusual Options Activity Detected: Smart Money on the Move
Benzinga Edge’s Unusual Options board spots potential market movers before they happen. See what positions big money is taking on your favorite stocks. Click here for access.
Options are a riskier asset compared to just trading the stock, but they have higher profit potential. Serious options traders manage this risk by educating themselves daily, scaling in and out of trades, following more than one indicator, and following the markets closely.
If you want to stay updated on the latest options trades for Texas Instruments, Benzinga Pro gives you real-time options trades alerts.
Market News and Data brought to you by Benzinga APIs
© 2024 Benzinga.com. Benzinga does not provide investment advice. All rights reserved.
Is It Too Late to Buy IBM Stock?
This isn’t your great-grandfather’s IBM (NYSE: IBM) anymore. It’s still a great long-term investment, though.
IBM’s pioneering history
The former maker of punch-card calculators evolved into an industrial computing powerhouse, a personal computing innovator, and then an all-you-can-eat buffet of information technology products. And just when everyone else started to copy Big Blue’s successful business model, the company took a sharp turn into cloud computing, consulting services, data security, and artificial intelligence (AI).
It was a tough business transformation, but it’s starting to pay off for longtime investors. About ten painful years after the newfound focus on AI and cloud services, ChatGPT came along to launch a marketwide fascination with AI.
Most investors didn’t see IBM as a player in that explosive market at first, because it wasn’t launching splashy consumer-facing AI apps or showing skyrocketing sales growth.
How IBM captures corporate clients in the AI boom
IBM aims squarely for enterprise-class corporate customers. Other companies can chase consumers all they want, but this company always wants long-term contracts with deep-pocketed clients.
These deals take time, since the potential clients in this class often have to go through many layers of management approvals and technical testing. For that reason, it wasn’t surprising to see other tech giants sprinting ahead of IBM in the AI boom’s early days.
But the approvals have started to come in and IBM is recording robust sales in the AI market. The watsonx generative AI platform has only been around for one year but already has more than $2 billion of signed contracts.
The watsonx service includes the same large language model (LLM) technology as OpenAI’s ChatGPT or Alphabet‘s (NASDAQ: GOOG) (NASDAQ: GOOGL) Gemini, but it’s paired with a large array of machine learning tools. The resulting AI system combines IBM’s decades of market-leading machine learning research with the user-friendly flexibility of LLMs, and the whole bundle connects to the client’s proprietary business data.
While most AI experts wanted to bring something to market as soon as possible, IBM didn’t launch watsonx until it had trackable data sources, ironclad security, and other business-friendly features. This is the solution for companies with valuable operating data and customer information.
I expect that order book to swell in the coming quarters and years. IBM is the AI leader you forgot about, poised to make a mint as the AI market matures.
Big Blue’s future prospects
That’s just one piece of IBM’s technology puzzle. The company also provides enterprise-class data security tools. A wide range of consulting services sets Big Blue apart from other tech titans. It’s even a front-runner in the emerging field of quantum computing with active quantum data centers in the U.S. and Germany.
The times, they are a-changing. IBM is always ready to roll with the punches and explore whatever the next big idea might be. Doubling down on AI years before the ChatGPT boom is one great example of this flexible attitude. IBM’s quantum computing research is another.
The stock has gained a market-beating 56% over the last year, but it still trades at a modest 16 times free cash flow (FCF). By comparison, the average price/FCF ratio among S&P 500 (SNPINDEX: ^GSPC) stocks is a beefy 26x.
So you can buy into a proven innovator with leading roles in high-growth markets such as AI, cloud computing, and quantum computing — all at a very low price. And whatever twists and turns might come in the road ahead, IBM will see them coming and probably already started planning for the next sea change.
In other words, you’re not too late to invest in IBM at all. This stock should deliver solid returns in the long run, often leading the way into new eras and unheard-of technologies.
Should you invest $1,000 in International Business Machines right now?
Before you buy stock in International Business Machines, consider this:
The Motley Fool Stock Advisor analyst team just identified what they believe are the 10 best stocks for investors to buy now… and International Business Machines wasn’t one of them. The 10 stocks that made the cut could produce monster returns in the coming years.
Consider when Nvidia made this list on April 15, 2005… if you invested $1,000 at the time of our recommendation, you’d have $752,838!*
Stock Advisor provides investors with an easy-to-follow blueprint for success, including guidance on building a portfolio, regular updates from analysts, and two new stock picks each month. The Stock Advisor service has more than quadrupled the return of S&P 500 since 2002*.
*Stock Advisor returns as of September 30, 2024
Suzanne Frey, an executive at Alphabet, is a member of The Motley Fool’s board of directors. Anders Bylund has positions in Alphabet and International Business Machines. The Motley Fool has positions in and recommends Alphabet. The Motley Fool recommends International Business Machines. The Motley Fool has a disclosure policy.
Is It Too Late to Buy IBM Stock? was originally published by The Motley Fool

