3 High-Yield Dividend Stocks Analysts Favor as Rates Drop
High-yield dividend stocks are returning to the spotlight as interest rates descend from record highs following the Federal Reserve’s recent 50-basis-point rate cut. With analysts increasingly bullish on certain large-cap names, there’s a compelling case for investors to consider adding these income-generating stocks to their portfolios.
Below, let’s take a closer look at three large-cap stocks that boast attractive dividend yields, positive analyst sentiment, and potential upside.
Kraft Heinz
Kraft Heinz Co. KHC, a global food and beverage giant, is known for its iconic brands like Heinz, Kraft, Oscar Mayer, and Planters. Along with its well-established history of producing household staples, Kraft Heinz has long been a favorite among income investors due to its substantial dividend yield. Currently, the stock offers a 4.55% yield, paired with a relatively low price-to-earnings (P/E) ratio of 15.3, making it appealing to both income and value investors.
While the stock is down 4.8% year-to-date (YTD), it’s currently in a bullish consolidation pattern, with its moving averages converging. This technical setup suggests that bullish momentum could accelerate if Kraft Heinz breaks above its downtrend resistance at around $36.
Analysts are cautiously optimistic, with six out of 11 rating the stock a Buy, four a Hold, and only one recommending it as a sell. The consensus price target suggests a nearly 7% upside, making it a stock worth watching. Kraft Heinz is projected to grow earnings by 4.3% over the next year, potentially making it a solid pick for income and value-growth-oriented investors.
Truist Financial
Truist Financial Corporation TFC, a prominent U.S. bank holding company, has also caught the eye of income investors thanks to its impressive 4.99% dividend yield. With a market capitalization of $55.8 billion, Truist offers financial services across various sectors and has been performing steadily in 2024. The stock is up 13% YTD, adding to its appeal as both a growth and income investment.
Technically, the stock is in a consolidation phase near a potential breakout point at $43, with momentum on its side. Its forward P/E ratio of 10.4 signals it may still be undervalued. Analysts are fairly optimistic, with 11 out of 22 rating the stock a Buy, while the other 11 recommend it as a Hold. The consensus price target indicates a nearly 9% upside, making it an attractive option for investors seeking value and dividends.
It’s also worth noting that Truist Financial’s upcoming earnings report, scheduled for October 17, could be a significant catalyst. In its last earnings report, released on July 22, the bank reported earnings per share (EPS) of $0.91, beating the consensus estimate of $0.84. With strong quarterly earnings and an attractive dividend yield, Truist remains a compelling option for those seeking exposure to the financial sector.
Chevron
Chevron CVX is a global leader in the energy sector and the second-largest integrated oil company in the U.S. It has a deep-rooted history in the industry and worldwide operations. Chevron has become a cornerstone of many dividend-focused portfolios. The stock currently sports a 4.35% dividend yield and a P/E ratio of 13.7, making it attractive for value and income investors alike.
Analysts are exceptionally bullish on Chevron. Of the 19 analysts covering the stock, 13 rate it a Buy. The consensus price target points to a nearly 20% upside, bolstering the argument that Chevron might still have room to run, especially in the current energy environment.
On the technical side, the stock broke above a critical resistance level yesterday, gaining 1.65% in a single day as rising tensions in the Middle East drove oil prices higher. This move suggests Chevron could be positioned for further upside as oil prices continue to rise and demand remains strong.
The article “3 High-Yield Dividend Stocks Analysts Favor as Rates Drop” first appeared on MarketBeat.
Market News and Data brought to you by Benzinga APIs
© 2024 Benzinga.com. Benzinga does not provide investment advice. All rights reserved.
Here's Why You Should Add FMC Stock to Your Portfolio Now
FMC Corporation‘s FMC stock looks promising at the moment. It benefits from efforts to expand its product portfolio through new product launches and its restructuring actions.
Let’s see what makes FMC stock a compelling investment option at the moment.
FMC Stock Outperforms Industry
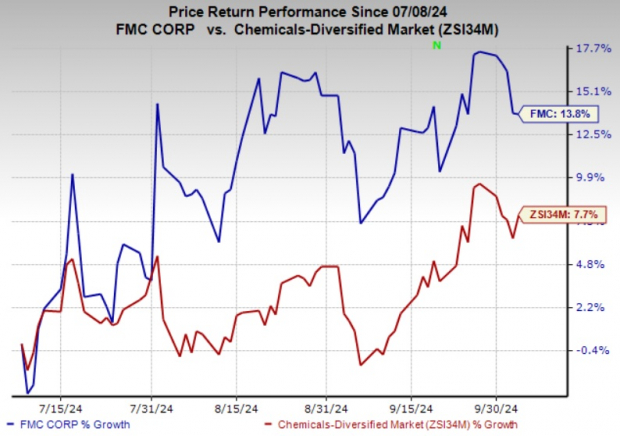
FMC has outperformed the industry it belongs to over the past three months. The company’s shares have gained 13.8% compared with a 7.7% rise of its industry.

Image Source: Zacks Investment Research
FMC’s Valuation Looks Attractive
FMC’s attractive valuation should lure investors seeking value. The stock is currently trading at a forward 12-month earnings multiple of 14.52X, representing a roughly 12.4% discount when stacked up with the industry average of 16.58X. FMC also has a Value Score of B.
FMC’s Earnings Estimates Going Up
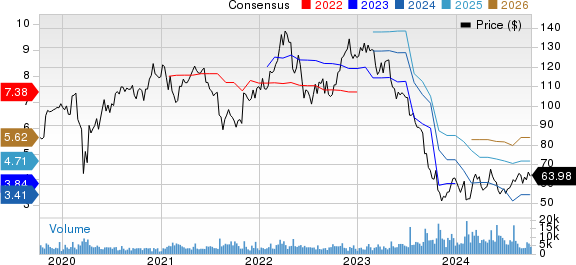
Earnings estimates for FMC have been going up over the past 60 days. The Zacks Consensus Estimate for 2024 has increased by 0.6%. The consensus estimate for 2025 has also been revised 3.5% upward over the same time frame.
New Products, Restructuring Actions Aid FMC Stock
FMC remains focused on strengthening its product portfolio. It is investing in technologies as well as new product launches to enhance value to the farmers. New products launched in Europe, North America and Asia are gaining significant traction. Product introductions are expected to support the company’s results this year.
FMC generated $590 million in sales in 2023 from new products launched in the past five years. It expects revenues from new products to grow by roughly $200 million in 2024. It expects a significant amount of volume growth to come from new products in the second half of 2024. FMC is seeing strong gains in new products including Coragen eVo and Premio Star insecticides and the Onsuva fungicide in Latin America.
The acquisition of BioPhero ApS, a Denmark-based pheromone research and production company, also adds biologically produced state-of-the-art pheromone insect control technology to the company’s product portfolio and R&D pipeline, highlighting FMC’s role as a leader in delivering innovative and sustainable crop protection solutions.
The company is also expected to benefit from reduced input costs, favorable product mix and its cost-control actions. It benefited from favorable input costs in the second quarter of 2024. FMC is also making progress with its global restructuring and cost-reduction program. It sees benefits from restructuring to contribute $75-$100 million to full-year 2024 adjusted EBITDA, net of inflation.
FMC’s Zacks Rank & Other Key Picks
FMC currently carries a Zacks Rank #2 (Buy).
Other top-ranked stocks in the Basic Materials space are IAMGOLD Corporation IAG, Cabot Corporation CBT and Axalta Coating Systems Ltd. AXTA. While IAMGOLD sports a Zacks Rank #1 (Strong Buy), Cabot and Axalta Coating carry a Zacks Rank #2.
The Zacks Consensus Estimate for IAMGOLD’s current-year earnings has increased by 45.4% in the past 60 days. IAG beat the consensus estimate in each of the last four quarters with the average surprise being 200%. Its shares have shot up roughly 132% in the past year.
The consensus estimate for Cabot’s current fiscal year earnings is pegged at $7.07 per share, indicating a year-over-year rise of 31.4%. The consensus estimates for CBT’s current-year earnings has increased by 4.3% in the past 60 days. The company’s shares have rallied roughly 61% in the past year.
The Zacks Consensus Estimate for Axalta Coating’s current year earnings is pegged at $2.07, indicating a rise of 31.9% from year-ago levels. The Zacks Consensus Estimate for AXTA’s current year earnings has increased 2.5% in the past 60 days. The stock has gained around 32% in the past year.
Market News and Data brought to you by Benzinga APIs
© 2024 Benzinga.com. Benzinga does not provide investment advice. All rights reserved.
Legacy Education Reports Results for Fourth Quarter and Full Year 2024
High Demand Fuels Positive Growth Outlook for 2024
TEMECULA, Calif., Oct. 7, 2024 /PRNewswire/ — Legacy Education Inc. LGCY, an award-winning, nationally accredited, for-profit post-secondary education company founded in 2009, today announced financial and operating results for the fourth quarter and full year ended June 30, 2024.
Fourth Quarter 2024 Financial Highlights
- Revenue grew 34.1% to $12.8 million
- New student starts increased 27.1%
- EBITDA of $0.9 million and adjusted EBITDA of $2.7 million
- Net income of $1.0 million
- Earnings per share of $0.10
Full Year 2024 Financial Highlights
- Revenue grew 29.7% to $46.0 million
- New student starts increased 21.8%
- EBITDA of $6.5 million and adjusted EBITDA of $8.4 million
- Net income of $5.1 million
- Earnings per share of $0.55
- Ended year with student population of 2,187, 28.3% higher than 2023
“We are pleased to report results in our annual earnings report, underscoring Legacy Education Inc.’s commitment to delivering high-quality educational experiences,” said LeeAnn Rohmann, Chief Executive Officer. “This year’s performance reflects our strategic growth initiatives and dedication to empowering individuals through transformative learning. We remain focused on expanding our reach and enhancing the value we provide to our students, partners and shareholders.”
YEAR END FINANCIAL RESULTS
(Year ended June 30, 2024 compared to June 30, 2023)
- Revenue was approximately $46.0 million in fiscal 2024 compared to approximately $35.5 million in fiscal 2023, an increase of approximately $10.5 million, or approximately 29.7%. The increase was primarily due to increased student enrollment and the increase in pricing of certain programs.
- Educational services was approximately $26.4 million in fiscal 2024 compared to approximately $20.8 million in fiscal 2023, an increase of approximately $5.6 million, or approximately 26.8%. The increase is primarily a result of increased instructional and staffing required to support the increase in enrollments as well as a non-cash compensation charge of approximately $1.9 million related to stock option grants, of which, approximately $1.8 million pertain to options that vested immediately upon the granting of the awards.
- General and administrative expense was approximately $13.0 million in fiscal 2024, compared to approximately $10.7 million in fiscal 2023, an increase of approximately $2.3 million, or approximately 22.0%. The increase was primarily related increased marketing and bad debt expense. We anticipate general and administrative expense will continue to increase as our business continues to move towards decentralization, reflecting (i) that we are now more corporate and campus-based, with additional management overseeing various campuses, and (ii) additional professional fees as we pursue potential acquisitions of new institutions. Of the total general and administrative expense, $4.1 million and $3.5 million related to sales and marketing expense for fiscal 2024 and 2023, respectively
|
(Table to Follow |
|||||
|
Three Months Ended |
Year Ended |
||||
|
June 30 |
June 30 |
||||
|
2024 |
2023 |
2024 |
2023 |
||
|
Unaudited |
Unaudited |
||||
|
REVENUE |
|||||
|
Tuition and related income, net |
$ 12,752,420 |
$ 9,509,864 |
$ 46,000,316 |
$ 35,455,948 |
|
|
OPERATING EXPENSES |
|||||
|
Educational services |
8,548,697 |
5,600,550 |
26,351,326 |
20,785,421 |
|
|
General and administrative |
3,253,367 |
2,722,619 |
12,999,164 |
10,651,402 |
|
|
General and administrative – related party |
42,000 |
47,000 |
168,000 |
173,000 |
|
|
Depreciation and amortization |
75,865 |
55,306 |
265,036 |
224,488 |
|
|
Total costs and expenses |
11,919,929 |
8,425,475 |
39,783,526 |
31,834,311 |
|
|
OPERATING INCOME |
832,491 |
1,084,389 |
6,216,790 |
3,621,637 |
|
|
Interest expense |
(14,864) |
(16,943) |
(118,162) |
(96,259) |
|
|
Interest income |
359,814 |
190,438 |
886,834 |
339,102 |
|
|
Total other income |
344,950 |
173,495 |
768,672 |
242,843 |
|
|
INCOME BEFORE INCOME TAXES |
$ 1,177,441 |
$ 1,257,884 |
$ 6,985,462 |
$ 3,864,480 |
|
|
Income tax expense |
(216,099) |
(463,121) |
(1,870,610) |
(1,197,741) |
|
|
Net income (loss) |
961,342 |
794,763 |
$ 5,114,852 |
2,666,739 |
|
|
Net income per share |
|||||
|
Basic net income per share |
$ 0.10 |
$ 0.09 |
$ 0.55 |
$ 0.29 |
|
|
Diluted net income per share |
$ 0.10 |
$ 0.08 |
$ 0.53 |
$ 0.28 |
|
|
Basic weighted average shares outstanding |
9,291,149 |
9,254,881 |
9,291,149 |
9,216,949 |
|
|
Diluted weighted average shares outstanding |
9,691,149 |
9,654,881 |
9,691,149 |
9,616,949 |
|
|
(1) Shares outstanding and per share amounts have been retroactively adjusted to reflect the 2-for-1 reverse split of our common stock effected on September 9, 2024. |
|
Selected Consolidated Balance Sheet Data: |
June 30, 2024 |
|
|
Cash and cash equivalents |
$ 10,376,149 |
|
|
Current assets |
24,587,609 |
|
|
Total assets |
35,173,050 |
|
|
Current liabilities |
10,466,242 |
|
|
Total stockholders’ equity |
22,419,012 |
|
Important Information Regarding Non-GAAP Financial Information
To supplement Legacy Education’s consolidated financial statements presented in accordance with GAAP, Legacy Education furnishes certain adjusted non-GAAP supplemental information to our financial results regarding EBITDA and adjusted EBITDA. This reconciliation adjust the related GAAP financial measures to exclude operating income to adjust the impact of non cash compenation in the periods presented. We use such adjusted non-GAAP financial measures to evaluate our period-over-period operating performance because our management team believes that by excluding the effects of such adjusted GAAP-related items that, in their opinion, do not reflect the ordinary earnings of our operations, it enhances investors’ overall understanding of our current financial performance and our prospects for the future by (i) providing a more comparable measure of our continuing business, as well as greater understanding of the results from the primary operations of our business, (ii) affording a view of our operating results that may be more easily compared to our peer companies, and (iii) enabling investors to consider our operating results on both a GAAP and adjusted non-GAAP basis (including following the integration period of our prior and proposed acquisitions). However, this adjusted non-GAAP information is not in accordance with, or an alternative to, generally accepted accounting principles in the United States (“GAAP”) and should be considered in conjunction with our GAAP results as the items excluded from the adjusted non-GAAP information may have a material impact on Legacy’s financial results. A reconciliation of adjusted non-GAAP adjustments to Legacy’s GAAP financial results is included in the tables at the end of this press release.
In the noted fiscal periods, we adjusted net income for the items identified from our GAAP financial results to arrive at our adjusted non-GAAP financial measures:
Stock-based compensation – We exclude stock-based compensation to be consistent with the way management and, in our view, the overall financial community, evaluates our performance and the methods used by analysts to calculate consensus estimates. The expense related to stock-based awards is generally not controllable in the short-term and can vary significantly based on the timing, size and nature of awards granted. As such, we do not include these charges in operating plans.
|
RECONCILIATION OF NET INCOME, EBITDA, AND ADJUSTED EBITDA |
||||||||||
|
Three Months Ended |
Year Ended |
|||||||||
|
June 30 |
June 30 |
|||||||||
|
2024 |
2023 |
2024 |
2023 |
|||||||
|
Net income |
$ 961,342 |
$ 794,763 |
$ 5,114,852 |
$ 2,666,739 |
||||||
|
Adjusted to exclude the following: |
||||||||||
|
Interest expense (income), net |
(344,950) |
(173,495) |
(768,672) |
(242,843) |
||||||
|
Provison for income taxes |
216,099 |
463,121 |
1,870,610 |
1,197,741 |
||||||
|
Depreciation and amortization |
75,865 |
55,306 |
265,036 |
224,488 |
||||||
|
EBITDA |
908,356 |
1,139,695 |
6,481,826 |
3,846,125 |
||||||
|
Non cash compensation |
1,882,064 |
0 |
1,882,064 |
0 |
||||||
|
Adjusted EBITDA |
$ 2,790,420 |
$ 1,139,695 |
$ 8,363,890 |
$ 3,846,125 |
||||||
ABOUT LEGACY EDUCATION
Legacy Education LGCY is an award-winning, nationally accredited, for-profit post-secondary education company founded in 2009. Legacy Education provides career-focused education primarily in the healthcare field, with certificates and degrees for nursing, medical technicians, dental assisting, business administrative, and several others. The company offers a wide range of educational programs and services to help students achieve their professional goals. Legacy Education’s focus is on providing high-quality education that is accessible and affordable. Legacy Education is committed to growing it’s education footprint via organic enrollment growth, addition of new programs and accretive acquisitions. For more information, please visit www.legacyed.com or on LinkedIn @legacy-education-inc.
FORWARD-LOOKING STATEMENTS
Statements in this press release about future expectations, plans, and prospects, as well as any other statements regarding matters that are not historical facts, may constitute “forward-looking statements.” These statements include, but are not limited to, statements relating to the expected trading commencement and closing dates, expected use of proceeds, the Company’s operations and business strategy and the Company’s expected financial results. The words “anticipate,” “believe,” “continue,” “could,” “estimate,” “expect,” “intend,” “may,” “plan,” “potential,” “predict,” “project,” “should,” “target,” “will,” “would” and similar expressions are intended to identify forward-looking statements, although not all forward-looking statements contain these identifying words. The forward-looking statements contained in this press release are based on management’s current expectations and are subject to substantial risks, uncertainty and changes in circumstances. Actual results may differ materially from those indicated by these forward-looking statements as a result of various important factors, including, without limitation, market conditions and the factors described in the section entitled “Risk Factors” in Legacy’s most recent Annual Report on Form 10-K and Legacy’s other filings made with the U.S. Securities and Exchange Commission. All such statements speak only as of the date of this press release. Consequently, forward-looking statements should be regarded solely as Legacy’s current plans, estimates, and beliefs. Legacy cannot guarantee future results, events, levels of activity, performance or achievements. Legacy does not undertake and specifically declines any obligation to update or revise any forward-looking statements to reflect new information, future events or circumstances or to reflect the occurrences of unanticipated events, except as may be required by applicable law.
Contact Legacy Education Inc.
Investor Relations
ir@legacyed.com
Amato and Partners, LLC
Investors Relations Council
admin@amatoandpartners.com
![]() View original content to download multimedia:https://www.prnewswire.com/news-releases/legacy-education-reports-results-for-fourth-quarter-and-full-year-2024-302268273.html
View original content to download multimedia:https://www.prnewswire.com/news-releases/legacy-education-reports-results-for-fourth-quarter-and-full-year-2024-302268273.html
SOURCE Legacy Education Inc.
© 2024 Benzinga.com. Benzinga does not provide investment advice. All rights reserved.
What's Going On With The US Economy And The Federal Reserve?
Last Friday’s US economic data showed a big beat across the board. Nonfarm Payrolls beat all expectations at 254K, Unemployed dropped to 4.1% and average hourly earnings came in at 4.0% YoY. So, is everything rosy in the US economy? If yes, why is the Federal Reserve cutting rates?
Let’s take things from the beginning. The Fed but 50bps in the last meeting, when most economic data suggested that there was no need at all:
- GDP growth QoQ is averaging around 3%.
- Unemployment is in the low 4% area.
- Inflation has been dropping but still well above the 2% target.
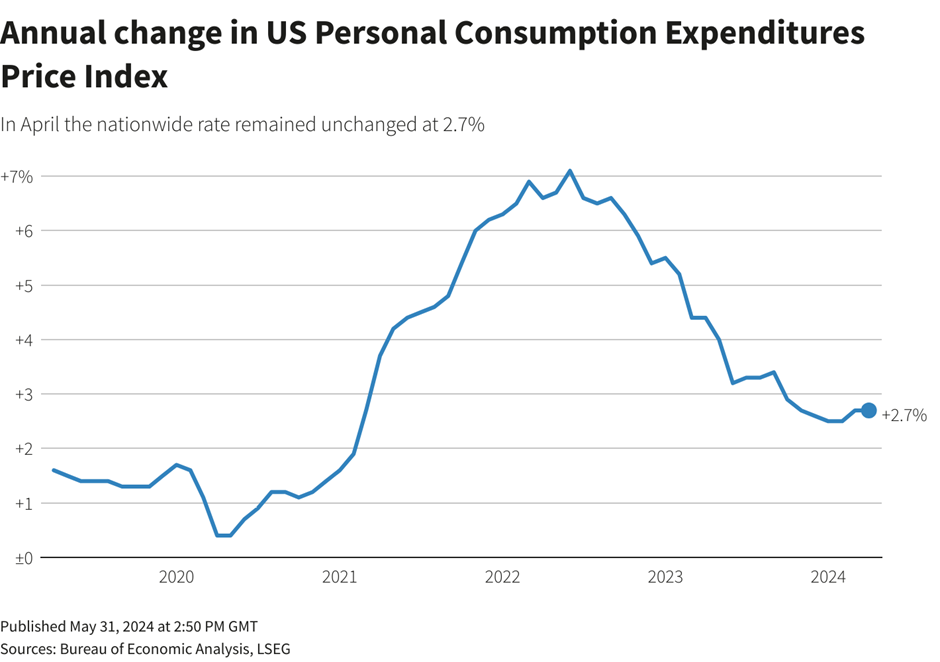
Perhaps the Fed is forecasting an upturn in unemployment and a further fall in inflation & GDP, and they – uncharacteristically – are trying to be proactive rather than reactive. It’s likely that their main concern is unemployment, as they consider the inflation issue “resolved” now.
Headline employment numbers might look good on paper, but what happens when we dig deeper into the details? The picture is certainly less rosy:
- The vast majority of job gains was in government and healthcare, while the private sector jobs were stagnant.
- Many of the job gains are attributed to immigrants, rather than native US citizens.
- The number of individuals holding multiple jobs hit new all-time highs. Is this because people love taking more jobs in order to earn more money, or is it due to necessity in order to make ends meet? My guess is the latter.
- We also need to remember that these numbers get heavily revised (usually to the downside), with the last revision being over 800k lower.

Politicians keep “reminding” people that the US economy is in great shape, but what’s really driving it? Both the government and individuals are loading up on record debt – the US Debt/GDP has soared to 120% and credit card debt has hit new all-time highs.


So, what’s my takeaway from all this, at least in the short to medium term?
- I think that the underlying condition of the US economy is worse than the headline numbers suggest.
- The Fed may need to ease more than markets expect, bringing yields lower. This is a much-needed outcome for the government, whose interest expense is growing at an alarming rate (currently above 1/3 of total tax receipts). There is still strong demand for US treasuries and of course the Fed is ready to help in case more buying firepower is needed.
- Low yields bring support to equities and with the US elections only weeks away, the government will want to do everything in its power to avoid a downturn.
- None of the two presidential candidates (Trump and Harris) even mentioned the spiraling debt problem, suggesting that they will do nothing to address it. A Trump win will be theoretically good for the US Dollar, while a Harris presidency will likely mean much looser monetary & fiscal policies.
I think that yields and the USD will eventually move to higher levels, but for the next few weeks and months the most likely scenario is a continuation lower.
The 10y UST yield has recently bounced from its 3.60% lows and it could well continue towards the 50% Fibonacci retracement and 200DMA that comes in at around 4.17%; however, I think that the 3.25%-3.35% support zone will be retested.

The DXY index is also rebounding and could continue towards the 23.6% Fibonacci retracement at 103.16, but it’s quite probable that it will then resume its move lower towards the 99.50 lows.

I am not in the camp of those who are calling for a US debt default or a change in the world’s reserve currency. I believe that the US will eventually regain its former glory via better fiscal and economic policies – however, the path in the next weeks and months will be a very difficult one.
Stelios Contogoulas
Forex Analytix
Market News and Data brought to you by Benzinga APIs
© 2024 Benzinga.com. Benzinga does not provide investment advice. All rights reserved.
Chinese Stock Surge: Should You Invest After Stimulus Boost?
Chinese stocks have been on a tear recently, surging higher by as much as 50% in some cases, following the Chinese government’s announcement of a series of measures to stimulate the slowing economy. The rally has sparked immense excitement among investors, who now wonder if the uptrend will continue or if it’s a temporary surge.
Stimulus Injects Optimism in Chinese Stocks
For months, Chinese equities had been underperforming due to many factors, including a sluggish economy, high interest rates, and a slow property market. As a result, many Chinese stocks were trading at depressed levels. That narrative shifted last week when Beijing began rolling out stimulus measures to combat the broader economic slowdown. Adding to the optimism was a recent announcement from China’s central bank on Sunday, stating that it would instruct banks to lower mortgage rates for existing home loans by October 31. This move is part of a broader plan to support China’s struggling real estate market, which has significantly affected the economy.
In conjunction with the central bank’s move, Guangzhou, one of China’s largest cities, announced the removal of all restrictions on home purchases. Similarly, Shanghai and Shenzhen also eased their respective curbs on buying properties. These sweeping reforms have contributed to the positive momentum, with Chinese equities posting substantial gains. For instance, the iShares China Large-Cap ETF FXI jumped over 20% last month, with heavyweight companies like Alibaba and JD.com rallying 31% and 51%, respectively.
With this backdrop, the question is whether investors should chase the rally or wait for a pullback. While the economic stimulus has driven significant gains, some technical indicators suggest the rally could run out of steam in the short term. Let’s dive into the technicals of two prominent dual-listed Chinese stocks, Alibaba and JD.com, to assess whether the risk-reward remains favorable for investors at these elevated levels.
Alibaba’s 38% YTD Gain Marks a Turnaround for Long-Term Investors
Alibaba Group Holding BABA, China’s internet retail giant, has seen a remarkable 31% surge over the past month, which has turned its year-to-date (YTD) performance positive, now up 38%. After enduring a prolonged period of underperformance, where the stock hovered near its 52-week lows for more than a year, the recent breakout has been a welcome change for long-term investors. The rally allowed BABA to break through resistance and finally escape its downtrend.
From a valuation standpoint, Alibaba remains appealing with a forward P/E of 11.17, positioning it as a solid long-term investment opportunity. However, in the short term, caution may be warranted. The stock’s Relative Strength Index (RSI) has climbed to 79, suggesting it has entered overbought territory. On Monday, the stock gave back some gains after initially gapping up, signaling that it might be digesting its recent move and possibly pulling back.
For investors with a long-term outlook, BABA still offers compelling value. However, it might be wise to exercise patience in the short term. The stock could find more attractive support closer to the $100 level, where it may stabilize before resuming its upward trajectory.
JD.com’s Rapid Rally Signals Potential Pullback After RSI Hits 85
JD.com JD, another consumer discretionary Chinese internet retail giant, has similarly exploded higher, with gains of 51% over the past month and 38% YTD. Like Alibaba, JD was trading near its 52-week lows before the recent surge, and the stock is now up 92% from those lows.
However, JD’s rapid ascent has pushed its RSI to 85.67, which indicates extreme overbought conditions. This suggests a short-term pullback is highly likely, as stocks rarely maintain high RSI levels for extended periods without some price consolidation. A potential support area for JD could be in the $36-$38 range, where previous resistance might now serve as a floor.
Despite the likelihood of a pullback, JD remains an attractive long-term play. The company trades at a P/E of 14.55 and a forward P/E of 9.61, placing it firmly in value territory. Analysts are also bullish on JD, with 10 rating the stock a “Buy” and four as a Hold, resulting in a consensus Moderate Buy rating.
The article “Chinese Stock Surge: Should You Invest After Stimulus Boost?” first appeared on MarketBeat.
Market News and Data brought to you by Benzinga APIs
© 2024 Benzinga.com. Benzinga does not provide investment advice. All rights reserved.
Chart Industries Clinches IPSMR & Liquefaction Equipment Order
Chart Industries, Inc. GTLS recently secured a contract from Exxon Mobil Corporation XOM to provide its IPSMR (Integrated Pre-Cooled Single Mixed Refrigerant) liquefaction technology and proprietary equipment. GTLS’ advanced liquefaction technology will be used for the Rovuma LNG (liquefied natural gas) project on the Afungi peninsula in Mozambique.
The Rovuma LNG Project is operated by Mozambique Rovuma Venture (“MRV”), a joint venture between ExxonMobil, Eni and China National Petroleum Corporation (“CNPC”). MRV owns a 70% interest in Area 4 concession of the Rovuma Basin while the remaining stake is held by ENH (10%), Galp (10%) and KOGAS (10%).
The Rovuma LNG project will be responsible for producing, liquefying and selling natural gas from reservoirs of the Area 4 block of the offshore Rovuma Basin. The project will carry a total LNG capacity of 18 million tons per annum (MTA), consisting of 12 modules with a 1.5 MTA capacity each.
Chart Industries’ IPSMR technology helps to enhance efficiency and performance in liquefaction systems. Its modular design facilitates customization, thereby improving adaptability to various site conditions and gas turbine power specifications. It will help the Rovuma LNG Project to optimize resource utilization, reduce operational costs and minimize greenhouse gas emissions.
Other Notable Deals
In May 2024, Chart Industries secured an order from Repsol to provide its advanced Howden hydrogen compression solutions for the expansion project of Repsol’s Sines industrial complex in Portugal.
Also, in March 2024, the company secured an order from Element Resources for its California-based green hydrogen production facility, Lancaster Clean Energy Center. Per the deal, Chart Industries will supply hydrogen liquefaction systems, liquid hydrogen storage tanks, trailer loadout bays, transport, ISO containers and hydrogen compression for storage, distribution and heavy-duty fueling to the facility.
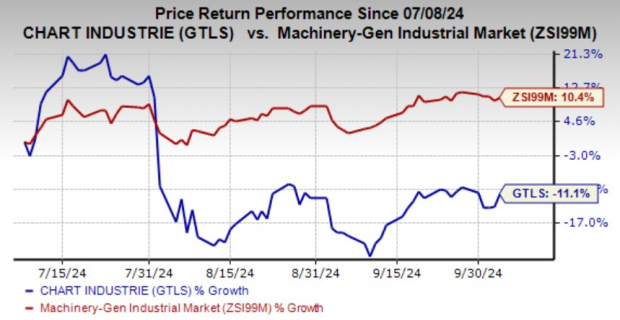
Price Performance of GTLS Stock

Image Source: Zacks Investment Research
In the past three months, the Zacks Rank #5 (Strong Sell) company’s shares have lost 11.1% against the industry’s 10.4% growth. It has been witnessing lower orders in the Heat Transfer Systems unit, which declined 9.4% year over year in second-quarter 2024. Headwinds from supply-chain constraints and increasing raw materials costs also remain concerning. GTLS anticipates generating sales in the range of $4.45-$4.60 billion in 2024, lower than $4.7-$5.0 billion projected earlier.
The Zacks Consensus Estimate for earnings is pegged at $10.46 per share for 2024, indicating a decrease of 4% from the 60-day-ago figure.
Stocks to Consider
Some better-ranked companies from the same space are discussed below.
Graham Corporation GHM currently sports a Zacks Rank #1 (Strong Buy).
GHM delivered a trailing four-quarter average earnings surprise of 133.3%. In the past 60 days, the Zacks Consensus Estimate for Graham’s fiscal 2025 earnings has increased 17.3%.
Crane Company CR presently carries a Zacks Rank #2 (Buy). The company delivered a trailing four-quarter average earnings surprise of 11.2%.
In the past 60 days, the Zacks Consensus Estimate for CR’s 2024 earnings has increased 0.6%.
Parker-Hannifin Corporation PH currently carries a Zacks Rank of 2. PH delivered a trailing four-quarter average earnings surprise of 11.2%.
In the past 60 days, the consensus estimate for Parker-Hannifin’s fiscal 2025 earnings has increased 1.4%.
Market News and Data brought to you by Benzinga APIs
© 2024 Benzinga.com. Benzinga does not provide investment advice. All rights reserved.
Spotlight on Coinbase Glb: Analyzing the Surge in Options Activity
Investors with a lot of money to spend have taken a bearish stance on Coinbase Glb COIN.
And retail traders should know.
We noticed this today when the trades showed up on publicly available options history that we track here at Benzinga.
Whether these are institutions or just wealthy individuals, we don’t know. But when something this big happens with COIN, it often means somebody knows something is about to happen.
So how do we know what these investors just did?
Today, Benzinga‘s options scanner spotted 98 uncommon options trades for Coinbase Glb.
This isn’t normal.
The overall sentiment of these big-money traders is split between 43% bullish and 47%, bearish.
Out of all of the special options we uncovered, 17 are puts, for a total amount of $1,448,006, and 81 are calls, for a total amount of $6,952,867.
Predicted Price Range
After evaluating the trading volumes and Open Interest, it’s evident that the major market movers are focusing on a price band between $2.5 and $500.0 for Coinbase Glb, spanning the last three months.
Volume & Open Interest Trends
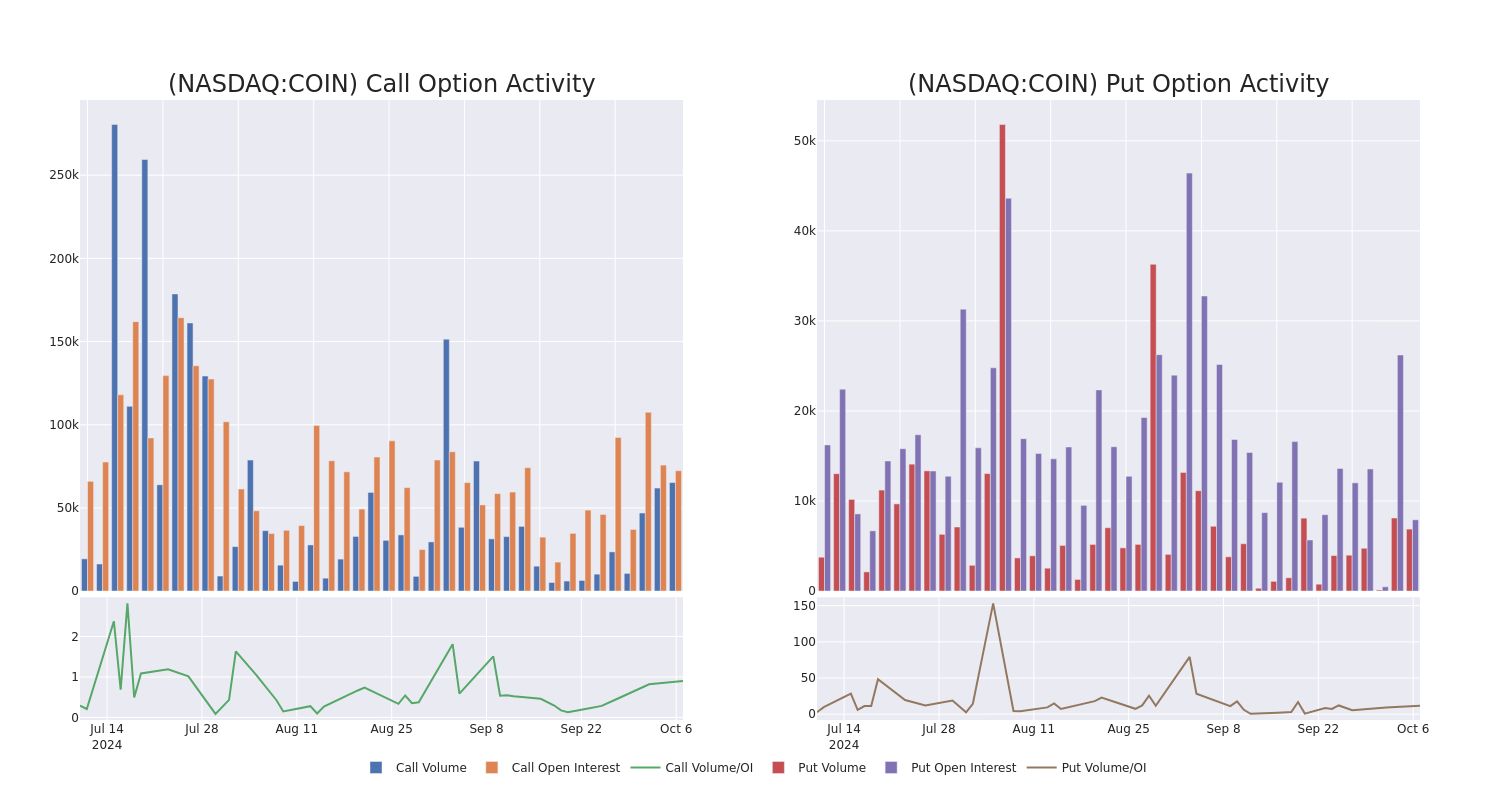
Assessing the volume and open interest is a strategic step in options trading. These metrics shed light on the liquidity and investor interest in Coinbase Glb’s options at specified strike prices. The forthcoming data visualizes the fluctuation in volume and open interest for both calls and puts, linked to Coinbase Glb’s substantial trades, within a strike price spectrum from $2.5 to $500.0 over the preceding 30 days.
Coinbase Glb 30-Day Option Volume & Interest Snapshot
Biggest Options Spotted:
| Symbol | PUT/CALL | Trade Type | Sentiment | Exp. Date | Ask | Bid | Price | Strike Price | Total Trade Price | Open Interest | Volume |
|---|---|---|---|---|---|---|---|---|---|---|---|
| COIN | PUT | TRADE | NEUTRAL | 12/20/24 | $130.5 | $129.55 | $130.0 | $300.00 | $624.0K | 51 | 0 |
| COIN | CALL | SWEEP | BULLISH | 01/16/26 | $170.65 | $167.0 | $168.97 | $2.50 | $507.1K | 81 | 85 |
| COIN | CALL | TRADE | NEUTRAL | 01/16/26 | $173.5 | $169.5 | $171.53 | $2.50 | $171.5K | 81 | 35 |
| COIN | CALL | SWEEP | BULLISH | 03/21/25 | $40.25 | $39.8 | $40.2 | $160.00 | $140.7K | 580 | 1.0K |
| COIN | CALL | SWEEP | BEARISH | 03/21/25 | $40.1 | $40.05 | $40.05 | $160.00 | $140.1K | 580 | 930 |
About Coinbase Glb
Founded in 2012, Coinbase is the leading cryptocurrency exchange platform in the United States. The company intends to be the safe and regulation-compliant point of entry for retail investors and institutions into the cryptocurrency economy. Users can establish an account directly with the firm, instead of using an intermediary, and many choose to allow Coinbase to act as a custodian for their cryptocurrency, giving the company breadth beyond that of a traditional financial exchange. While the company still generates the majority of its revenue from transaction fees charged to its retail customers, Coinbase uses internal investment and acquisitions to expand into adjacent businesses, such as prime brokerage and data analytics.
After a thorough review of the options trading surrounding Coinbase Glb, we move to examine the company in more detail. This includes an assessment of its current market status and performance.
Present Market Standing of Coinbase Glb
- With a volume of 4,232,589, the price of COIN is up 0.12% at $171.12.
- RSI indicators hint that the underlying stock may be approaching overbought.
- Next earnings are expected to be released in 24 days.
Turn $1000 into $1270 in just 20 days?
20-year pro options trader reveals his one-line chart technique that shows when to buy and sell. Copy his trades, which have had averaged a 27% profit every 20 days. Click here for access.
Options trading presents higher risks and potential rewards. Astute traders manage these risks by continually educating themselves, adapting their strategies, monitoring multiple indicators, and keeping a close eye on market movements. Stay informed about the latest Coinbase Glb options trades with real-time alerts from Benzinga Pro.
Market News and Data brought to you by Benzinga APIs
© 2024 Benzinga.com. Benzinga does not provide investment advice. All rights reserved.
Graphene Market to Reach $1.4 Billion, Globally, by 2028 at 34.6% CAGR: Allied Market Research
Wilmington, Delaware , Oct. 07, 2024 (GLOBE NEWSWIRE) — Allied Market Research published a report, titled, “Graphene Market by Type (Mono-layer & Bi-layer Graphene and Few Layer Graphene (FLG), Graphene Oxide (GO), Graphene Nano Platelets (GNP)), and Application (Electronics, Composites, Energy storage, Paint, Coatings & Inks, Tires and Others): Global Opportunity Analysis and Industry Forecast, 2024-2028″. According to the report, the graphene market was valued at $0.3 billion in 2023, and is estimated to reach $1.4 billion by 2028, growing at a CAGR of 34.6% from 2024 to 2028.
Prime determinants of growth
The global graphene market is experiencing growth due to several factors such as rise in use in electronics and electrical gadgets and environmental and sustainability benefits. However, high material cost and scalability challenges hinder the market growth. Moreover, advancements in production techniques present growth opportunities for the market. Advancements in functionalization techniques have unlocked new possibilities for graphene’s integration into diverse applications. Functionalization allows researchers to tailor graphene’s properties to suit specific requirements, enhancing its compatibility with various materials and processes. Functionalized graphene derivatives exhibit improved dispersion, stability, and compatibility, enabling seamless integration into composites, coatings, and electronic devices.
Download Sample Pages of Research Overview: https://www.alliedmarketresearch.com/request-sample/460
Report coverage & details:
| Report Coverage | Details |
| Forecast Period | 2024–2028 |
| Base Year | 2023 |
| Market Size in 2023 | $0.3 billion |
| Market Size in 2028 | $1.4 billion |
| CAGR | 34.6% |
| No. of Pages in Report | 410 |
| Segments Covered | Type, Application, and Region. |
| Regional Scope | North America, Europe, Asia Pacific, LAMEA |
| Drivers | Increasing use in electronics and electrical gadgets Environmental and sustainability benefits |
| Opportunity | Advancements in production techniques |
| Restraint | High material cost and scalability challenges |
Graphene nano platelets (GNP) segment maintains its dominance by 2028
By type, the graphene nano platelets (GNP) segment held the highest market share in 2023 and is estimated to maintain its leadership status during the forecast period. GNPs’ large surface area and high aspect ratio contribute to their exceptional electrical and thermal conductivity. These properties make GNPs attractive candidates for enhancing the performance of electronic devices, batteries, and thermal management systems. By incorporating GNPs into conductive inks, coatings, and composites, manufacturers achieve higher conductivity, lower resistance, and improved heat dissipation, thereby enhancing the efficiency and reliability of electronic and thermal systems.
Energy storage segment is expected to lead the trail by 2028
Based on application, the energy storage segment held the highest market share in 2023 and is estimated to dominate during the forecast period. Graphene’s mechanical strength and flexibility play a crucial role in energy storage applications. By incorporating graphene into battery electrodes and electrolytes, researchers improve the mechanical stability and durability of energy storage devices, leading to longer lifespan and enhanced safety. Moreover, graphene’s flexibility allows for the development of bendable and stretchable energy storage solutions creates new possibilities for integration into wearable electronics and flexible displays.
Procure Complete Report (300 Pages PDF with Insights, Charts, Tables, and Figures) @ https://www.alliedmarketresearch.com/checkout-final/graphene-market
Asia-Pacific is expected to dominate the market during the forecast period
Based on region, Asia-Pacific was the fastest growing region in terms of revenue in 2023. Asia-Pacific electronics industry serves as a major catalyst for graphene adoption. As the world’s largest consumer electronics market, the region’s demand for smaller, faster, and more energy-efficient devices creates a compelling case for integrating graphene into electronic components. Graphene’s exceptional electrical conductivity, mechanical flexibility, and thermal stability make it an ideal candidate for enhancing the performance of semiconductors, batteries, displays, and sensors, thus driving innovation and differentiation in the electronics sector.
Leading Market Players:
- Applied Graphene Materials
- CVD Equipment Corporation
- NANOTEK INSTRUMENTS INC
- Vorbeck Materials Corp.
Want to Access the Statistical Data and Graphs, Key Players’ Strategies: https://www.alliedmarketresearch.com/graphene-market/purchase-options
The report provides a detailed analysis of these key players in the global graphene market. These players have adopted different strategies such as new product launches, collaborations, expansion, joint ventures, agreements, and others to increase their market share and maintain dominant shares in different regions. The report is valuable in highlighting business performance, operating segments, product portfolio, and strategic moves of market players to showcase the competitive scenario.
About Us
Allied Market Research (AMR) is a full-service market research and business-consulting wing of Allied Analytics LLP based in Portland, Oregon. Allied Market Research provides global enterprises as well as medium and small businesses with unmatched quality of “Market Research Reports” and “Business Intelligence Solutions.” AMR has a targeted view to provide business insights and consulting to assist its clients to make strategic business decisions and achieve sustainable growth in their respective market domain.
Pawan Kumar, the CEO of Allied Market Research, is leading the organization toward providing high-quality data and insights. We are in professional corporate relations with various companies and this helps us in digging out market data that helps us generate accurate research data tables and confirms utmost accuracy in our market forecasting. Each and every data presented in the reports published by us is extracted through primary interviews with top officials from leading companies of domain concerned. Our secondary data procurement methodology includes deep online and offline research and discussion with knowledgeable professionals and analysts in the industry.
Contact:
David Correa
United States
1209 Orange Street,
Corporation Trust Center,
Wilmington, New Castle,
Delaware 19801 USA.
Int’l: +1-503-894-6022
Toll Free: +1-800-792-5285
Fax: +1-800-792-5285
help@alliedmarketresearch.com
Web: www.alliedmarketresearch.com
Allied Market Research Blog: https://blog.alliedmarketresearch.com
Blog: https://www.newsguards.com/
Follow Us on | Facebook | LinkedIn | YouTube |

© 2024 Benzinga.com. Benzinga does not provide investment advice. All rights reserved.
PHOENIX INVESTORS APPOINTS JEFF DORTONA CHIEF FINANCIAL OFFICER
MILWAUKEE, Oct. 7, 2024 /PRNewswire/ — Phoenix Investors (“Phoenix“), a national leader in the revitalization of former manufacturing facilities, has announced the appointment of Jeff Dortona as Chief Financial Officer. Previously a Managing Director and Co-Head of Originations at UBS Investment Bank, Mr. Dortona’s 20 years of experience in investment banking on Wall Street, an extensive network of relationships, and his deep industry expertise make him a valuable addition to the Phoenix team.
In his previous role, Mr. Dortona was responsible for leading a national origination platform which provided commercial real estate debt through the CMBS market as well as highly structured balance sheet transactions; he was also instrumental in originating many permanent and bridge loans. Prior to his role at UBS Investment Bank, Mr. Dortona managed and underwrote secured real estate financings at Merrill Lynch.
Mr. Dortona is a graduate of Boston University and holds a BA in Business Administration with concentrations in real estate and finance.
“Jeff’s familiarity with our property portfolio and investment strategy will be invaluable as we enter the next phase of our growth,” said Phoenix Investors Founder & Chairman Frank Crivello of the appointment. “We feel both fortunate and grateful as we welcome him to the Phoenix team.”
“I am excited to join Phoenix Investors, a company I have admired as one of the most dynamic industrial owners in the real estate industry,” said Dortona. “I look forward to working with the Phoenix team on advancing the company’s traditional industrial and data center platforms across the country.”
About Phoenix Investors
Phoenix Investors is the leading expert in the acquisition, renovation, and releasing of former manufacturing facilities in the United States. The revitalization of facilities throughout the continental United States leads to positively transforming communities and restarting the economic engine in the communities we serve. Phoenix’s affiliate companies hold equity interests in a portfolio of industrial properties totaling approximately 78 million square feet spanning 29 states, delivering corporations with a cost-effective national footprint to dynamically supply creative solutions to meet their leasing needs.
For more information, please visit https://phoenixinvestors.com.
![]() View original content to download multimedia:https://www.prnewswire.com/news-releases/phoenix-investors-appoints-jeff-dortona-chief-financial-officer-302268084.html
View original content to download multimedia:https://www.prnewswire.com/news-releases/phoenix-investors-appoints-jeff-dortona-chief-financial-officer-302268084.html
SOURCE Phoenix Investors
Market News and Data brought to you by Benzinga APIs
© 2024 Benzinga.com. Benzinga does not provide investment advice. All rights reserved.
Breast Cancer Screening Market to Reach $6.7 Billion, Globally, by 2033 at 8.7% CAGR: Allied Market Research
Wilmington, Delaware , Oct. 07, 2024 (GLOBE NEWSWIRE) — Allied Market Research published a report, titled, “Breast Cancer Screening Market by Test Type (Blood Marker Test, Genetic Test, Imaging Test and Immunohistochemistry Test), by Gender (Male and Female), and End User (Specialty Clinics, Hospitals, Diagnostic Centers and Other): Global Opportunity Analysis and Industry Forecast, 2024-2033″. According to the report, the breast cancer screening market was valued at $2.9 billion in 2023, and is estimated to reach $6.7 billion by 2033, growing at a CAGR of 8.7% from 2024 to 2033.
Request Sample of the Report on Breast Cancer Screening Market 2033 – https://www.alliedmarketresearch.com/request-sample/A324383
Prime Determinants of Growth
The breast cancer screening market is primarily driven by the increasing prevalence of breast cancer, rise in awareness about the early diagnosis of breast cancer, and technological advancement in screening technologies. Rising incidences of breast cancer globally have heightened the demand for screening services. With breast cancer being one of the most prevalent cancers among women worldwide, healthcare systems are under pressure to expand screening programs to meet diagnostic needs effectively. In addition, increasing awareness among women about the importance of early detection plays a crucial role. Public health campaigns and initiatives by healthcare organizations globally have raised awareness levels, encouraging more women to undergo regular screening tests. Furthermore, advancements in screening technologies have significantly enhanced detection accuracy and efficiency. Innovations such as digital mammography, 3D tomosynthesis, and MRI screening offer improved sensitivity, reducing false negatives and enhancing early detection rates.
Report Coverage & Details
| Repot Coverage | Details |
| Forecast Period | 2024–2033 |
| Base Year | 2023 |
| Market Size in 2023 | $2.9 billion |
| Market Size in 2033 | $6.4 billion |
| CAGR | 8.64% |
| No. of Pages in Report | 280 |
| Segments Covered | Test Type, Gender, End User and Region |
| Drivers |
|
| Opportunities |
|
| Restraint |
Want to Explore More, Connect to our Analyst – https://www.alliedmarketresearch.com/connect-to-analyst/A324383
Segment Highlights
The imaging test segment dominated market share in 2023
By test type, imaging test segment dominated the market share in 2023. This is attributed to the advancements in imaging technologies, such as digital mammography, ultrasound, and magnetic resonance imaging (MRI), which have significantly enhanced the accuracy and reliability of detecting breast abnormalities. In addition, the rising awareness among women about the importance of regular breast cancer screening has driven an increase in demand for these imaging tests.
The female segment dominated the market share in 2023
By gender, female segment dominated the market share in 2023. This is attributed to the fact that breast cancer predominantly affects women. Furthermore, there has been a growing emphasis on early detection and prevention among women, supported by widespread awareness campaigns and healthcare initiatives.
Hospital segment dominated market share in 2023
By end user, hospital segment dominated the market share in 2023. This is attributed to the fact that hospitals typically serve as primary points of contact for patients seeking comprehensive medical care, including diagnostic screenings like mammograms and ultrasound examinations. This centralized role allows hospitals to integrate breast cancer screening seamlessly into routine check-ups or specialized clinics, thereby increasing accessibility for patients.
For Purchase Related Queries/Inquiry – https://www.alliedmarketresearch.com/purchase-enquiry/A324383
Regional Outlook
North America holds a dominant position in the market, attributed to high prevalence of breast cancer, strong presence of major key players and well-established healthcare infrastructure. However, Asia-Pacific region is expected to register the highest CAGR in the forecast period. This is attributed to expanding healthcare infrastructure, rising healthcare expenditure in countries like China, India, and Japan, and rise in prevalence of breast cancer.
Key Players
- Siemens Healthineers AG
- Metabolomic Technologies Inc
- Biocrates Lifesciences AG
- Provista Diagnostics Inc
- F. Hoffmann-La Roche AG
The report provides a detailed analysis of these key players in the global breast cancer screening market. These players have adopted different strategies such as product development to increase their market share and maintain dominant shares in different regions. The report is valuable in highlighting business performance, operating segments, product portfolio, and strategic moves of market players to showcase the competitive scenario.
Get Customized Reports with your Requirements – https://www.alliedmarketresearch.com/request-for-customization/A324383
Recent Development
In May 2022, VolparaHealth introduced updated products for its integrated platform to deliver personalized breast care at the SBI/ACR Breast Imaging Symposium 2022. Volpara’s AI-driven breast software tools improve mammography quality and reporting, volumetric breast density measurements, and cancer risk assessment
Trending Reports in Healthcare Industry:
Behavioral Rehabilitation Market – Global Opportunity Analysis and Industry Forecast, 2023-2032
Bariatric Surgery Devices Market – Global Opportunity Analysis and Industry Forecast, 2023-2032
Anti-decubitus Cushions Market – Global Opportunity Analysis and Industry Forecast, 2023-2032
AVENUE- A Subscription-Based Library (Premium on-demand, subscription-based pricing model) Offered by Allied Market Research:
AMR introduces its online premium subscription-based library Avenue, designed specifically to offer cost-effective, one-stop solution for enterprises, investors, and universities. With Avenue, subscribers can avail an entire repository of reports on more than 2,000 niche industries and more than 12,000 company profiles. Moreover, users can get an online access to quantitative and qualitative data in PDF and Excel formats along with analyst support, customization, and updated versions of reports.
Get an access to the library of reports at any time from any device and anywhere. For more details, follow the link: https://www.alliedmarketresearch.com/library-access
About Allied Market Research:
Allied Market Research (AMR) is a full-service market research and business-consulting wing of Allied Analytics LLP based in Wilmington, Delaware. Allied Market Research provides global enterprises as well as medium and small businesses with unmatched quality of “Market Research Reports” and “Business Intelligence Solutions.” AMR has a targeted view to provide business insights and consulting to assist its clients to make strategic business decisions and achieve sustainable growth in their respective market domains. AMR offers its services across 11 industry verticals including Life Sciences, Consumer Goods, Materials & Chemicals, Construction & Manufacturing, Food & Beverages, Energy & Power, Semiconductor & Electronics, Automotive & Transportation, ICT & Media, Aerospace & Defense, and BFSI.
We are in professional corporate relations with various companies and this helps us in digging out market data that helps us generate accurate research data tables and confirms utmost accuracy in our market forecasting. Allied Market Research CEO Pawan Kumar is instrumental in inspiring and encouraging everyone associated with the company to maintain high quality of data and help clients in every way possible to achieve success. Each and every data presented in the reports published by us is extracted through primary interviews with top officials from leading companies of domain concerned. Our secondary data procurement methodology includes deep online and offline research and discussion with knowledgeable professionals and analysts in the industry.
Contact
David Correa
1209 Orange Street,
Corporation Trust Center,
Wilmington, New Castle,
Delaware 19801 USA.
Toll Free: +1-800-792-5285
Int’l: +1-503-894-6022
UK: +44-845-528-1300
Hong Kong: +852-301-84916
India (Pune): +91-20-66346060
Fax: +1-855-550-5975
Web: https://www.alliedmarketresearch.com
Follow Us on: LinkedIn Twitter

© 2024 Benzinga.com. Benzinga does not provide investment advice. All rights reserved.


