Looking At Zillow Gr's Recent Unusual Options Activity
High-rolling investors have positioned themselves bearish on Zillow Gr Z, and it’s important for retail traders to take note.
This activity came to our attention today through Benzinga’s tracking of publicly available options data. The identities of these investors are uncertain, but such a significant move in Z often signals that someone has privileged information.
Today, Benzinga’s options scanner spotted 16 options trades for Zillow Gr. This is not a typical pattern.
The sentiment among these major traders is split, with 18% bullish and 75% bearish. Among all the options we identified, there was one put, amounting to $42,244, and 15 calls, totaling $845,832.
Predicted Price Range
Taking into account the Volume and Open Interest on these contracts, it appears that whales have been targeting a price range from $45.0 to $80.0 for Zillow Gr over the last 3 months.
Volume & Open Interest Development
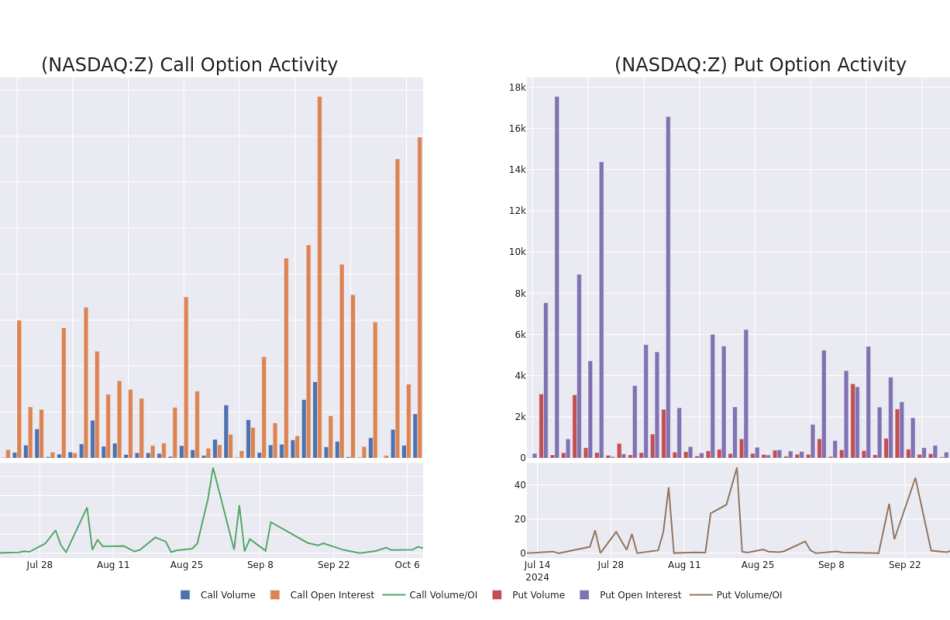
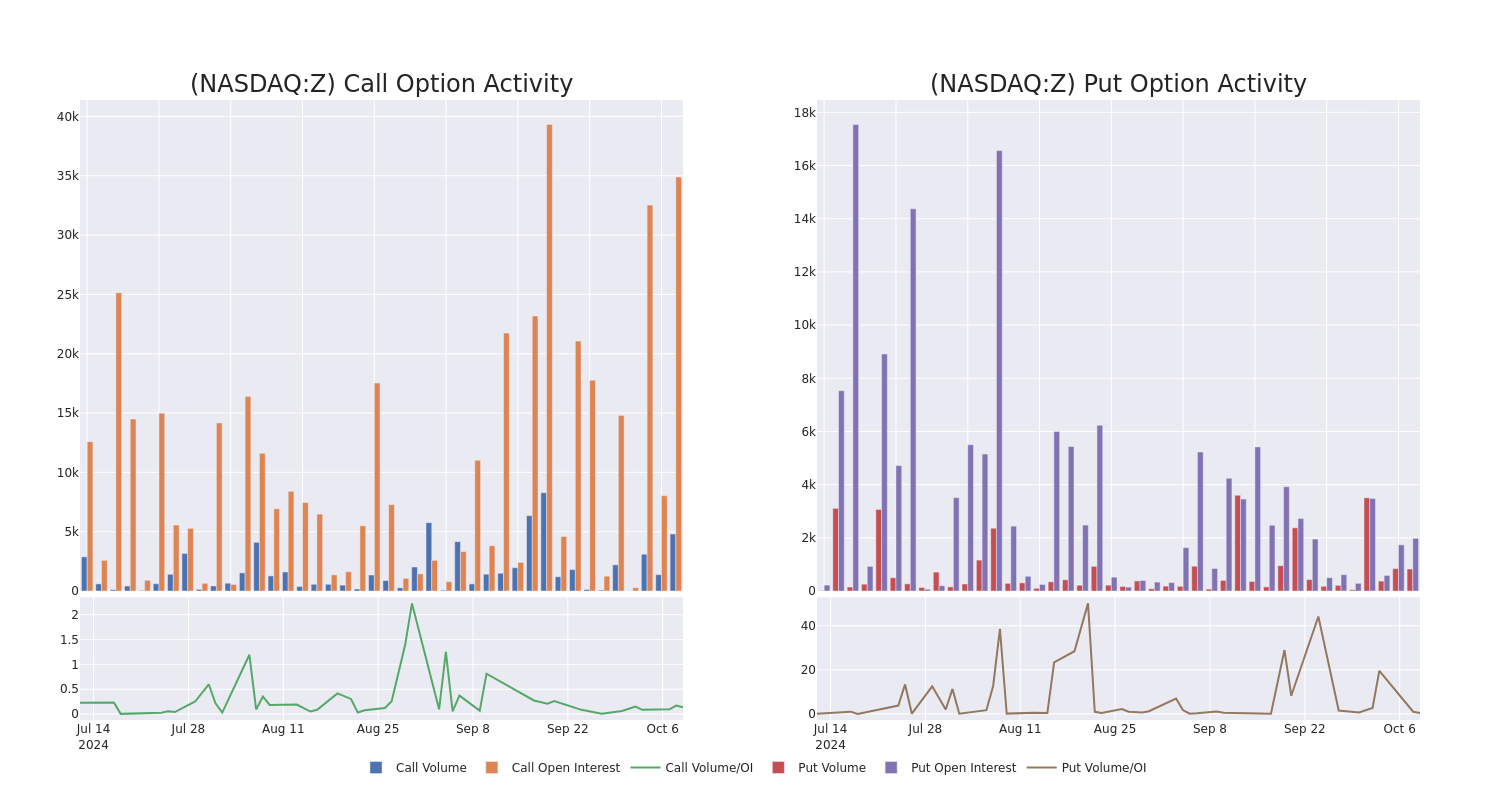
Looking at the volume and open interest is a powerful move while trading options. This data can help you track the liquidity and interest for Zillow Gr’s options for a given strike price. Below, we can observe the evolution of the volume and open interest of calls and puts, respectively, for all of Zillow Gr’s whale trades within a strike price range from $45.0 to $80.0 in the last 30 days.
Zillow Gr Option Activity Analysis: Last 30 Days
Noteworthy Options Activity:
| Symbol | PUT/CALL | Trade Type | Sentiment | Exp. Date | Ask | Bid | Price | Strike Price | Total Trade Price | Open Interest | Volume |
|---|---|---|---|---|---|---|---|---|---|---|---|
| Z | CALL | SWEEP | BEARISH | 01/17/25 | $6.6 | $6.4 | $6.4 | $60.00 | $160.0K | 4.8K | 631 |
| Z | CALL | SWEEP | BEARISH | 01/17/25 | $2.96 | $2.8 | $2.82 | $70.00 | $70.8K | 14.4K | 290 |
| Z | CALL | TRADE | BEARISH | 01/17/25 | $4.4 | $4.2 | $4.28 | $65.00 | $64.6K | 5.6K | 156 |
| Z | CALL | TRADE | BEARISH | 01/17/25 | $6.55 | $6.35 | $6.43 | $60.00 | $64.3K | 4.8K | 958 |
| Z | CALL | TRADE | BEARISH | 01/17/25 | $4.45 | $4.2 | $4.29 | $65.00 | $60.0K | 5.6K | 296 |
About Zillow Gr
Zillow Group Inc is an Internet-based real estate company that offers its customers an on-demand experience for selling, buying, renting, or financing with transparency and ease The group works with real estate agents, brokers, builders, property managers, and landlords to pair technology with top-notch service. The group has brands such as Zillow, Trulia, StreetEasy, Hotpads, Zillow Rentals, Zillow Home Loans, ShowingTime, Follow Up Boss, Aryeo and others.
After a thorough review of the options trading surrounding Zillow Gr, we move to examine the company in more detail. This includes an assessment of its current market status and performance.
Where Is Zillow Gr Standing Right Now?
- With a volume of 4,804,715, the price of Z is down -2.7% at $60.58.
- RSI indicators hint that the underlying stock may be approaching overbought.
- Next earnings are expected to be released in 21 days.
What Analysts Are Saying About Zillow Gr
Over the past month, 2 industry analysts have shared their insights on this stock, proposing an average target price of $70.0.
Unusual Options Activity Detected: Smart Money on the Move
Benzinga Edge’s Unusual Options board spots potential market movers before they happen. See what positions big money is taking on your favorite stocks. Click here for access.
* In a positive move, an analyst from Wedbush has upgraded their rating to Outperform and adjusted the price target to $80.
* Consistent in their evaluation, an analyst from Morgan Stanley keeps a Equal-Weight rating on Zillow Gr with a target price of $60.
Options are a riskier asset compared to just trading the stock, but they have higher profit potential. Serious options traders manage this risk by educating themselves daily, scaling in and out of trades, following more than one indicator, and following the markets closely.
If you want to stay updated on the latest options trades for Zillow Gr, Benzinga Pro gives you real-time options trades alerts.
Market News and Data brought to you by Benzinga APIs
© 2024 Benzinga.com. Benzinga does not provide investment advice. All rights reserved.
[Latest] Global Reactive Hot Melt Adhesive Market Size/Share Worth USD 4.3 Billion by 2033 at a 7.2% CAGR: Custom Market Insights (Analysis, Outlook, Leaders, Report, Trends, Forecast, Segmentation, Growth, Growth Rate, Value)
Austin, TX, USA, Oct. 09, 2024 (GLOBE NEWSWIRE) — Custom Market Insights has published a new research report titled “Reactive Hot Melt Adhesive Market Size, Trends and Insights By Resin Type (Polyurethane, Polyolefin, Others), By Substrate (Plastic, Wood, Others), By Application (Automotive & Transportation, Doors & Windows, Lamination, Textile, Assembly, Others), and By Region – Global Industry Overview, Statistical Data, Competitive Analysis, Share, Outlook, and Forecast 2024–2033“ in its research database.
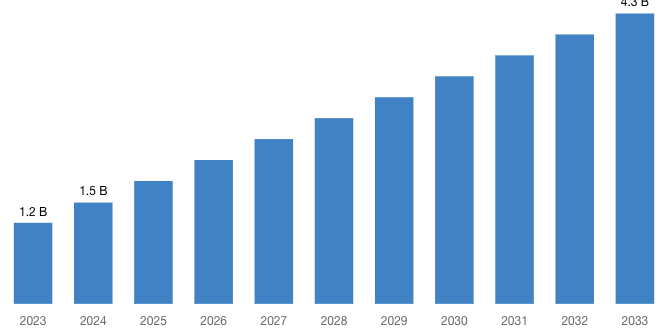
“According to the latest research study, the demand of global Reactive Hot Melt Adhesive Market size & share was valued at approximately USD 1.2 Billion in 2023 and is expected to reach USD 1.5 Billion in 2024 and is expected to reach a value of around USD 4.3 Billion by 2033, at a compound annual growth rate (CAGR) of about 7.2% during the forecast period 2024 to 2033.”
Click Here to Access a Free Sample Report of the Global Reactive Hot Melt Adhesive Market @ https://www.custommarketinsights.com/request-for-free-sample/?reportid=52427
Reactive Hot Melt Adhesive Market: Overview
Reactive hot melt adhesive is a type of adhesive that is solid at room temperature but becomes fluid when heated. Unlike traditional hot melt adhesives, which solidify upon cooling, reactive hot melt adhesives undergo a chemical reaction upon cooling to form a permanent bond.
A significant trend in the reactive hot melt adhesive market is the growing demand for environmentally friendly and sustainable formulations. With increasing awareness of environmental concerns and regulatory pressures, manufacturers are focusing on developing adhesives with reduced volatile organic compound (VOC) emissions and lower environmental impact throughout their lifecycle.
This trend is driving innovation towards bio-based raw materials and renewable resources, as well as the development of adhesives with improved recyclability and biodegradability. Additionally, there’s a rising interest in adhesives that offer enhanced performance under challenging conditions, such as extreme temperatures or exposure to harsh chemicals.
As industries like automotive, packaging, and electronics continue to seek efficient and durable bonding solutions, there’s a corresponding emphasis on reactive hot melt adhesives that can deliver superior bonding strength, durability, and sustainability while meeting stringent regulatory requirements.
These trends are reshaping the landscape of the reactive hot melt adhesive market, driving manufacturers to invest in research and development to meet evolving market demands.
Request a Customized Copy of the Reactive Hot Melt Adhesive Market Report @ https://www.custommarketinsights.com/inquire-for-discount/?reportid=52427
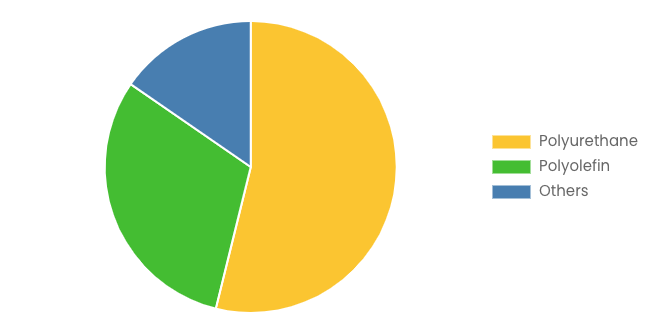
By resin type, the Polyurethane segment held the highest market share in 2023 and is expected to keep its dominance during the forecast period 2024-2033. Polyurethane is a versatile polymer that finds extensive applications across various industries. It is formed through the reaction of polyols and diisocyanates, resulting in a wide range of properties depending on the specific formulation and manufacturing process.
By Substrate, the Plastic segment held the highest market share in 2023 and is expected to keep its dominance during the forecast period 2024-2033. Plastic is a synthetic material made from polymers, which are long chains of molecules. It is one of the most widely used materials globally due to its versatility, durability, and cost-effectiveness. There are various types of plastics, each with unique properties and applications.
By Application, the Automotive & Transportation segment held the highest market share in 2023 and is expected to keep its dominance during the forecast period 2024-2033. This sector includes the production of passenger cars, trucks, buses, and other motor vehicles. Manufacturers continually innovate to improve vehicle safety, performance, fuel efficiency, and sustainability.
North America boasts one of the largest economies globally, with the United States being the largest single economy in the world. The region is home to numerous multinational corporations across various industries, including technology, finance, healthcare, and manufacturing.
H.B. Fuller Company is a major American adhesives manufacturing company supplying industrial adhesives worldwide. As a leading global industrial adhesives manufacturer, H.B. Fuller is focused on perfecting state-of-the-art adhesives, sealants and other specialty chemicals.
Report Scope
| Feature of the Report | Details |
| Market Size in 2024 | USD 1.5 Billion |
| Projected Market Size in 2033 | USD 4.3 Billion |
| Market Size in 2023 | USD 1.2 Billion |
| CAGR Growth Rate | 7.2% CAGR |
| Base Year | 2023 |
| Forecast Period | 2024-2033 |
| Key Segment | By Resin Type, Substrate, Application and Region |
| Report Coverage | Revenue Estimation and Forecast, Company Profile, Competitive Landscape, Growth Factors and Recent Trends |
| Regional Scope | North America, Europe, Asia Pacific, Middle East & Africa, and South & Central America |
| Buying Options | Request tailored purchasing options to fulfil your requirements for research. |
(A free sample of the Reactive Hot Melt Adhesive report is available upon request; please contact us for more information.)
Request a Customized Copy of the Reactive Hot Melt Adhesive Market Report @ https://www.custommarketinsights.com/report/reactive-hot-melt-adhesive-market/
Our Free Sample Report Consists of the following:
- Introduction, Overview, and in-depth industry analysis are all included in the 2024 updated report.
- The COVID-19 Pandemic Outbreak Impact Analysis is included in the package.
- About 220+ Pages Research Report (Including Recent Research)
- Provide detailed chapter-by-chapter guidance on the Request.
- Updated Regional Analysis with a Graphical Representation of Size, Share, and Trends for the Year 2024
- Includes Tables and figures have been updated.
- The most recent version of the report includes the Top Market Players, their Business Strategies, Sales Volume, and Revenue Analysis
- Custom Market Insights (CMI) research methodology
(Please note that the sample of the Reactive Hot Melt Adhesive report has been modified to include the COVID-19 impact study prior to delivery.)
Request a Customized Copy of the Reactive Hot Melt Adhesive Market Report @ https://www.custommarketinsights.com/report/reactive-hot-melt-adhesive-market/
CMI has comprehensively analyzed the Global Reactive Hot Melt Adhesive market. The driving forces, restraints, challenges, opportunities, and key trends have been explained in depth to depict depth scenarios of the market. Segment wise market size and market share during the forecast period are duly addressed to portray the probable picture of this Global Reactive Hot Melt Adhesive industry.
The competitive landscape includes key innovators, after market service providers, market giants as well as niche players are studied and analyzed extensively concerning their strengths, weaknesses as well as value addition prospects. In addition, this report covers key players profiling, market shares, mergers and acquisitions, consequent market fragmentation, new trends and dynamics in partnerships.
Key questions answered in this report:
- What is the size of the Reactive Hot Melt Adhesive market and what is its expected growth rate?
- What are the primary driving factors that push the Reactive Hot Melt Adhesive market forward?
- What are the Reactive Hot Melt Adhesive Industry’s top companies?
- What are the different categories that the Reactive Hot Melt Adhesive Market caters to?
- What will be the fastest-growing segment or region?
- In the value chain, what role do essential players play?
- What is the procedure for getting a free copy of the Reactive Hot Melt Adhesive market sample report and company profiles?
Key Offerings:
- Market Share, Size & Forecast by Revenue | 2024−2033
- Market Dynamics – Growth Drivers, Restraints, Investment Opportunities, and Leading Trends
- Market Segmentation – A detailed analysis by Types of Services, by End-User Services, and by regions
- Competitive Landscape – Top Key Vendors and Other Prominent Vendors
Buy this Premium Reactive Hot Melt Adhesive Research Report | Fast Delivery Available – [220+ Pages] @ https://www.custommarketinsights.com/report/reactive-hot-melt-adhesive-market/
Reactive Hot Melt Adhesive Market: Regional Analysis
By region, Reactive Hot Melt Adhesive market is segmented into North America, Europe, Asia-Pacific, Latin America, the Middle East & Africa. North America dominated the global Reactive Hot Melt Adhesive market in 2023 with a market share of 42.5% and is expected to keep its dominance during the forecast period 2024-2033.
North America significantly drives the reactive hot melt adhesive market due to its robust industrial base and technological advancements. The region’s thriving automotive, packaging, and electronics industries are major consumers of these adhesives, which are valued for their superior bonding strength and durability.
In the automotive sector, reactive hot melt adhesives are crucial for assembling components and reducing vehicle weight, contributing to fuel efficiency and sustainability.
The packaging industry, particularly in the United States and Canada, also heavily relies on reactive hot melt adhesives for reliable and quick sealing solutions, driven by the e-commerce boom and the need for efficient logistics.
Additionally, the electronics industry uses these adhesives in the production of devices requiring precise and strong bonding capabilities. Innovation and investment in R&D are other critical factors. North American companies are at the forefront of developing advanced adhesive formulations tailored to specific industry needs, including those that offer enhanced performance under extreme conditions.
The region’s regulatory environment, promoting the use of safer and more sustainable chemical products, further propels the adoption of advanced reactive hot melt adhesives.
Request a Customized Copy of the Reactive Hot Melt Adhesive Market Report @ https://www.custommarketinsights.com/report/reactive-hot-melt-adhesive-market/
(We customized your report to meet your specific research requirements. Inquire with our sales team about customizing your report.)
Still, Looking for More Information? Do OR Want Data for Inclusion in magazines, case studies, research papers, or Media?
Email Directly Here with Detail Information: support@custommarketinsights.com
Browse the full “Reactive Hot Melt Adhesive Market Size, Trends and Insights By Resin Type (Polyurethane, Polyolefin, Others), By Substrate (Plastic, Wood, Others), By Application (Automotive & Transportation, Doors & Windows, Lamination, Textile, Assembly, Others), and By Region – Global Industry Overview, Statistical Data, Competitive Analysis, Share, Outlook, and Forecast 2024–2033“ Report at https://www.custommarketinsights.com/report/reactive-hot-melt-adhesive-market/
List of the prominent players in the Reactive Hot Melt Adhesive Market:
- Henkel
- B. Fuller
- Bostik Inc
- 3M Company
- Beardow & Adams
- Novamelt (Henkel)
- Jowat
- Avery Dennison
- DOW Corning
- Kleiberit
- Tex Year Industries
- Nanpao
- Tianyang
- Renhe
- Zhejiang Good
- Huate
- The Dow Chemical Company
- Arkema
- Huntsman Corporation
- Sika AG
- Others
Click Here to Access a Free Sample Report of the Global Reactive Hot Melt Adhesive Market @ https://www.custommarketinsights.com/report/reactive-hot-melt-adhesive-market/
Spectacular Deals
- Comprehensive coverage
- Maximum number of market tables and figures
- The subscription-based option is offered.
- Best price guarantee
- Free 35% or 60 hours of customization.
- Free post-sale service assistance.
- 25% discount on your next purchase.
- Service guarantees are available.
- Personalized market brief by author.
Browse More Related Reports:
North America Spoolable Pipe Market: North America Spoolable Pipe Market Size, Trends and Insights By Product Type (Flexible Spoolable Pipe, Rigid Spoolable Pipe), By Reinforcement Type (Fiber Reinforcement, Glass Reinforcement, Carbon Reinforcement, Other Reinforcement, Steel Reinforcement, Hybrid Reinforcement), By Application (Onshore, Production and Gathering Lines, Injection Pipes, Disposal Lines, Others, Offshore, Flowlines, Jumpers, Others, Downhole, Water, Others), By End User (Oil & Gas, Municipalities, Mining, Chemical & Petrochemical, Food Processing, Others), and By Region – Industry Overview, Statistical Data, Competitive Analysis, Share, Outlook, and Forecast 2024–2033
Europe Building Insulation Market: Europe Building Insulation Market Size, Trends and Insights By Type (Mineral Wool, Glass Wool, Stone Wool, Foamed Plastics, Expanded Polystyrene (EPS), Extruded Polystyrene (XPS), Polyurethane (PU), Polyisocyanurate (PIR), Other, Fiberglass, Cellulose, Aerogels, Others), By Application (Floor Basement, Wall, Roof Ceiling), By End User (Residential, Non-Residential, Industrial, Commercial, Others), and By Region – Industry Overview, Statistical Data, Competitive Analysis, Share, Outlook, and Forecast 2024–2033
US Commercial Flooring Market: US Commercial Flooring Market Size, Trends and Insights By Product Type (Carpet, Vinyl, Tile, Laminate, Wood, Stone), By Application (Healthcare, Education, Retail, Office, Hospitality, Industrial), By Material (Synthetic, Natural), By End Use (Renovation, New Construction), By Sales Channel (Direct, Distributors, Online), and By Region – Industry Overview, Statistical Data, Competitive Analysis, Share, Outlook, and Forecast 2024–2033
Aerosol Disinfectants Market: Aerosol Disinfectants Market Size, Trends and Insights By Product Category (Plain, Scented), By Sale Channels (Hypermarkets/Supermarkets, Convenience Stores, Online Retail Stores, Others), By Application (Residential, Commercial, Industrial), and By Region – Global Industry Overview, Statistical Data, Competitive Analysis, Share, Outlook, and Forecast 2024–2033
Timber Plants Market: Timber Plants Market Size, Trends and Insights By Type (Soft, Semi-hard, Hardwoods), By Grade (CLT, Glulam), By Application (Furniture making, Construction Activities, Flooring material., Crafting veneers and plywood., Boat building, Wood carvings and sculptures., Paper and pulp products manufacturing, Others), By End User Industry (Residential, Commercial, Institutional, Industrial, Others), and By Region – Global Industry Overview, Statistical Data, Competitive Analysis, Share, Outlook, and Forecast 2024–2033
Lead Smelting and Refining Market: Lead Smelting and Refining Market Size, Trends and Insights By Technology (Pyrometallurgical Methods, Hydrometallurgical Methods, Electrometallurgical Methods), By Environmental Compliance (Standard Compliance, Advanced Compliance), By Distribution Channel (Direct Sales, Distributors, Online Sales), By Application (Lead Acid Batteries, Radiation Shielding, Cable Sheathing, Others), and By Region – Global Industry Overview, Statistical Data, Competitive Analysis, Share, Outlook, and Forecast 2024–2033
Titanium Dioxide Market: Titanium Dioxide Market Size, Trends and Insights By Grade (Rutile, Anatase), By Application (Paints & Coatings, Plastics, Paper, Cosmetics, Inks, Textiles, Food Additives, Others), By Production Process (Sulfate Process, Chloride Process), By End-Use Industry (Automotive, Construction, Packaging, Consumer Goods, Others), and By Region – Global Industry Overview, Statistical Data, Competitive Analysis, Share, Outlook, and Forecast 2024–2033
Synthetic Organic Alcohol Market: Synthetic Organic Alcohol Market Size, Trends and Insights By Types of Alcohols (Methanol, Ethanol, Isopropanol, Butanol, Others), By Application (Solvents, Disinfectants, Antifreeze, Fuel Additives, Others), By End Users (Pharmaceuticals, Cosmetics, Automotive, Others), and By Region – Global Industry Overview, Statistical Data, Competitive Analysis, Share, Outlook, and Forecast 2024–2033
The Reactive Hot Melt Adhesive Market is segmented as follows:
By Resin Type
- Polyurethane
- Polyolefin
- Others
By Substrate
By Application
- Automotive & Transportation
- Doors & Windows
- Lamination
- Textile
- Assembly
- Others
Click Here to Get a Free Sample Report of the Global Reactive Hot Melt Adhesive Market @ https://www.custommarketinsights.com/report/reactive-hot-melt-adhesive-market/
Regional Coverage:
North America
- U.S.
- Canada
- Mexico
- Rest of North America
Europe
- Germany
- France
- U.K.
- Russia
- Italy
- Spain
- Netherlands
- Rest of Europe
Asia Pacific
- China
- Japan
- India
- New Zealand
- Australia
- South Korea
- Taiwan
- Rest of Asia Pacific
The Middle East & Africa
- Saudi Arabia
- UAE
- Egypt
- Kuwait
- South Africa
- Rest of the Middle East & Africa
Latin America
- Brazil
- Argentina
- Rest of Latin America
This Reactive Hot Melt Adhesive Market Research/Analysis Report Contains Answers to the following Questions.
- Which Trends Are Causing These Developments?
- Who Are the Global Key Players in This Reactive Hot Melt Adhesive Market? What are Their Company Profile, Product Information, and Contact Information?
- What Was the Global Market Status of the Reactive Hot Melt Adhesive Market? What Was the Capacity, Production Value, Cost and PROFIT of the Reactive Hot Melt Adhesive Market?
- What Is the Current Market Status of the Reactive Hot Melt Adhesive Industry? What’s Market Competition in This Industry, Both Company and Country Wise? What’s Market Analysis of Reactive Hot Melt Adhesive Market by Considering Applications and Types?
- What Are Projections of the Global Reactive Hot Melt Adhesive Industry Considering Capacity, Production and Production Value? What Will Be the Estimation of Cost and Profit? What Will Be Market Share, Supply and Consumption? What about imports and exports?
- What Is Reactive Hot Melt Adhesive Market Chain Analysis by Upstream Raw Materials and Downstream Industry?
- What Is the Economic Impact On Reactive Hot Melt Adhesive Industry? What are Global Macroeconomic Environment Analysis Results? What Are Global Macroeconomic Environment Development Trends?
- What Are Market Dynamics of Reactive Hot Melt Adhesive Market? What Are Challenges and Opportunities?
- What Should Be Entry Strategies, Countermeasures to Economic Impact, and Marketing Channels for Reactive Hot Melt Adhesive Industry?
Click Here to Access a Free Sample Report of the Global Reactive Hot Melt Adhesive Market @ https://www.custommarketinsights.com/report/reactive-hot-melt-adhesive-market/
Reasons to Purchase Reactive Hot Melt Adhesive Market Report
- Reactive Hot Melt Adhesive Market Report provides qualitative and quantitative analysis of the market based on segmentation involving economic and non-economic factors.
- Reactive Hot Melt Adhesive Market report outlines market value (USD) data for each segment and sub-segment.
- This report indicates the region and segment expected to witness the fastest growth and dominate the market.
- Reactive Hot Melt Adhesive Market Analysis by geography highlights the consumption of the product/service in the region and indicates the factors affecting the market within each region.
- The competitive landscape incorporates the market ranking of the major players, along with new service/product launches, partnerships, business expansions, and acquisitions in the past five years of companies profiled.
- Extensive company profiles comprising company overview, company insights, product benchmarking, and SWOT analysis for the major market players.
- The Industry’s current and future market outlook concerning recent developments (which involve growth opportunities and drivers as well as challenges and restraints of both emerging and developed regions.
- Reactive Hot Melt Adhesive Market Includes in-depth market analysis from various perspectives through Porter’s five forces analysis and provides insight into the market through Value Chain.
Reasons for the Research Report
- The study provides a thorough overview of the global Reactive Hot Melt Adhesive market. Compare your performance to that of the market as a whole.
- Aim to maintain competitiveness while innovations from established key players fuel market growth.
Buy this Premium Reactive Hot Melt Adhesive Research Report | Fast Delivery Available – [220+ Pages] @ https://www.custommarketinsights.com/report/reactive-hot-melt-adhesive-market/
What does the report include?
- Drivers, restrictions, and opportunities are among the qualitative elements covered in the worldwide Reactive Hot Melt Adhesive market analysis.
- The competitive environment of current and potential participants in the Reactive Hot Melt Adhesive market is covered in the report, as well as those companies’ strategic product development ambitions.
- According to the component, application, and industry vertical, this study analyzes the market qualitatively and quantitatively. Additionally, the report offers comparable data for the important regions.
- For each segment mentioned above, actual market sizes and forecasts have been given.
Who should buy this report?
- Participants and stakeholders worldwide Reactive Hot Melt Adhesive market should find this report useful. The research will be useful to all market participants in the Reactive Hot Melt Adhesive industry.
- Managers in the Reactive Hot Melt Adhesive sector are interested in publishing up-to-date and projected data about the worldwide Reactive Hot Melt Adhesive market.
- Governmental agencies, regulatory bodies, decision-makers, and organizations want to invest in Reactive Hot Melt Adhesive products’ market trends.
- Market insights are sought for by analysts, researchers, educators, strategy managers, and government organizations to develop plans.
Request a Customized Copy of the Reactive Hot Melt Adhesive Market Report @ https://www.custommarketinsights.com/report/reactive-hot-melt-adhesive-market/
About Custom Market Insights:
Custom Market Insights is a market research and advisory company delivering business insights and market research reports to large, small, and medium-scale enterprises. We assist clients with strategies and business policies and regularly work towards achieving sustainable growth in their respective domains.
CMI provides a one-stop solution for data collection to investment advice. The expert analysis of our company digs out essential factors that help to understand the significance and impact of market dynamics. The professional experts apply clients inside on the aspects such as strategies for future estimation fall, forecasting or opportunity to grow, and consumer survey.
Follow Us: LinkedIn | Twitter | Facebook | YouTube
Contact Us:
Joel John
CMI Consulting LLC
1333, 701 Tillery Street Unit 12,
Austin, TX, Travis, US, 78702
USA: +1 801-639-9061
India: +91 20 46022736
Email: support@custommarketinsights.com
Web: https://www.custommarketinsights.com/
Blog: https://www.techyounme.com/
Blog: https://atozresearch.com/
Blog: https://www.technowalla.com/
Blog: https://marketresearchtrade.com/
Buy this Premium Reactive Hot Melt Adhesive Research Report | Fast Delivery Available – [220+ Pages] @ https://www.custommarketinsights.com/report/reactive-hot-melt-adhesive-market/

© 2024 Benzinga.com. Benzinga does not provide investment advice. All rights reserved.
Dow Surges 350 Points; US Crude Oil Stocks Increase
U.S. stocks traded higher toward the end of trading, with the Dow Jones index gaining over 350 points on Wednesday.
The Dow traded up 0.85% to 42,436.26 while the NASDAQ rose 0.34% to 18,244.57. The S&P 500 also rose, gaining, 0.47% to 5,778.11.
Check This Out: How To Earn $500 A Month From JPMorgan Stock Ahead Of Q3 Earnings
Leading and Lagging Sectors
Financials shares jumped by 0.8% on Wednesday.
In trading on Wednesday, utilities shares fell by 1.2%.
Top Headline
U.S. crude oil inventories increased by 5.810 million barrels for the week ended Oct. 4, compared to market expectations of a 2 million gain.
Equities Trading UP
- Momentus Inc. MNTS shares shot up 125% to $0.9352 after the company announced a NASA contract to provide launch services for future agency missions.
- Shares of Banzai International, Inc. BNZI got a boost, surging 65% to $4.5701 after the company announced strategic business initiatives to improve net income.
- Inhibikase Therapeutics, Inc. IKT shares were also up, gaining 17% to $1.3894 after the company announced the pricing of an approximately $110 million private placement financing.
Equities Trading DOWN
- Sacks Parente Golf, Inc. SPGC shares dropped 52% to $1.75 after gaining 35% after the company announced a $732K public offering of 366,000 shares of common stock for general corporate and working capital needs.
- Shares of Verb Technology Company, Inc. VERB were down 18% to $7.00.
- Alternus Clean Energy Inc ALCE was down, falling 28% to $0.1032 after the company announced a 1-for-25 reverse stock split as part of its Nasdaq compliance plan.
Commodities
In commodity news, oil traded down 0.3% to $73.38 while gold traded down 0.2% at $2,629.00.
Silver traded up 0.5% to $30.745 on Wednesday, while copper fell 1.1% to $4.4080.
Euro zone
European shares closed higher today. The eurozone’s STOXX 600 rose 0.66%, Germany’s DAX gained 0.99% and France’s CAC 40 rose 0.52%. Spain’s IBEX 35 Index rose 0.06%, while London’s FTSE 100 rose 0.65%.
Germany’s trade surplus increased to EUR 22.5 billion in August versus a revised EUR 16.9 billion in the prior month, topping market estimates of EUR 18.4 billion.
Asia Pacific Markets
Asian markets closed mostly lower on Wednesday, with Japan’s Nikkei 225 gaining 0.87%, Hong Kong’s Hang Seng Index dipping 1.38%, China’s Shanghai Composite Index falling 6.62% and India’s BSE Sensex dipping 0.21%.
Japan’s machine tool orders declined 6.5% year-over-year to JPY 125,297 million in September compared to a 3.5% decline in the prior month, while the Reuters Tankan sentiment index for manufacturers climbed to +7 in October versus +4 in September. The Reserve Bank of India maintained its benchmark policy repo rate at 6.5% during October meeting.
Economics
- U.S. mortgage applications declined by 5.1% from the previous week during the first week of October, compared to a 1.3% drop in the prior week.
- U.S. wholesale inventories increased by 0.1% month-over-month to $904.8 billion in August, compared to the preliminary estimate of a 0.2% gain and versus a revised 0.2% rise in the previous month.
- U.S. crude oil inventories increased by 5.810 million barrels for the week ended Oct. 4,compared to market expectations of a 2 million gain.
Now Read This:
Market News and Data brought to you by Benzinga APIs
© 2024 Benzinga.com. Benzinga does not provide investment advice. All rights reserved.
Arcadium Lithium, Norwegian Cruise Line, GitLab, Chewy And Other Big Stocks Moving Higher On Wednesday
U.S. stocks were higher, with the Dow Jones index gaining around 0.2% on Wednesday.
Shares of Arcadium Lithium plc ALTM rose sharply during Wednesday’s session after the company announced it will be acquired by Rio Tinto.
Rio Tinto and Arcadium Lithium entered into a definitive agreement under which Rio Tinto will acquire Arcadium in an all-cash transaction for $5.85 per share, valuing the company at approximately $6.7 billion.
Arcadium Lithium shares jumped 30.5% to $5.54 on Wednesday.
Here are some other big stocks recording gains in today’s session.
- MicroCloud Hologram Inc. HOLO shares surged 33.1% to $6.89.
- Helen of Troy Limited HELE gained 20.6% to $75.22 after the company reported better-than-expected second-quarter financial results.
- Astera Labs, Inc. ALAB shares jumped 15.7% to $61.31 after the company announced a new portfolio of fabric switches purpose-build for AI infrastructure at cloud-scale. Also, Morgan Stanley maintained an Overweight rating on the stock and raised its price target from $55 to $74.
- Standard Lithium Ltd. SLI surged 14.6% to $1.9788.
- IDT Corporation IDT gained 14.5% to $44.03.
- Luminar Technologies, Inc. LAZR climbed 10.7% to $0.9196.
- Sigma Lithium Corporation SGML rose 9.4% to $14.44.
- Biomea Fusion, Inc. BMEA surged 9.3% to $12.46. EF Hutton analyst Jason Kolbert initiated coverage on Biomea Fusion with a Buy rating and announced a price target of $128.
- Norwegian Cruise Line Holdings Ltd. NCLH gained 8.1% to $22.48. Citigroup analyst James Hardiman upgraded Norwegian Cruise Line from Neutral to Buy and raised the price target from $20 to $30.
- Array Technologies, Inc. ARRY rose 6.8% to $6.88.
- Super Micro Computer, Inc. SMCI climbed 5.4% to $47.80.
- GitLab Inc. GTLB gained 5.3% to $52.60. Morgan Stanley analyst Sanjit Singh initiated coverage on GitLab with an Overweight rating and announced a price target of $70.
- Chewy, Inc. CHWY rose 3.3% to $30.50. TD Cowen analyst Bill Kerr initiated coverage on Chewy with a Buy rating and announced a price target of $38.
Now Read This:
Market News and Data brought to you by Benzinga APIs
© 2024 Benzinga.com. Benzinga does not provide investment advice. All rights reserved.
What the Options Market Tells Us About Lululemon Athletica
Whales with a lot of money to spend have taken a noticeably bearish stance on Lululemon Athletica.
Looking at options history for Lululemon Athletica LULU we detected 14 trades.
If we consider the specifics of each trade, it is accurate to state that 35% of the investors opened trades with bullish expectations and 42% with bearish.
From the overall spotted trades, 8 are puts, for a total amount of $595,397 and 6, calls, for a total amount of $225,655.
Predicted Price Range
After evaluating the trading volumes and Open Interest, it’s evident that the major market movers are focusing on a price band between $230.0 and $320.0 for Lululemon Athletica, spanning the last three months.
Analyzing Volume & Open Interest
Assessing the volume and open interest is a strategic step in options trading. These metrics shed light on the liquidity and investor interest in Lululemon Athletica’s options at specified strike prices. The forthcoming data visualizes the fluctuation in volume and open interest for both calls and puts, linked to Lululemon Athletica’s substantial trades, within a strike price spectrum from $230.0 to $320.0 over the preceding 30 days.
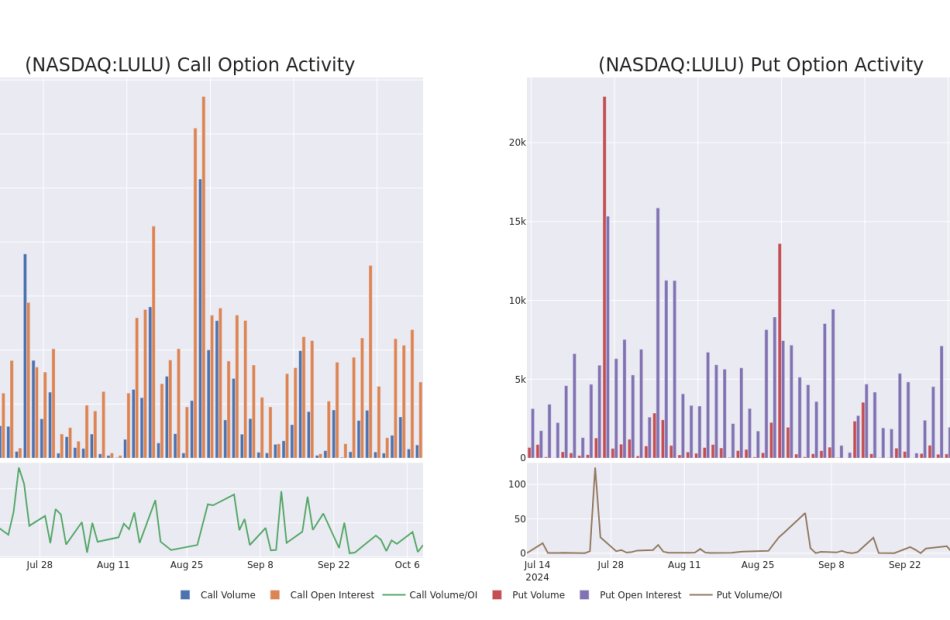
Lululemon Athletica Call and Put Volume: 30-Day Overview
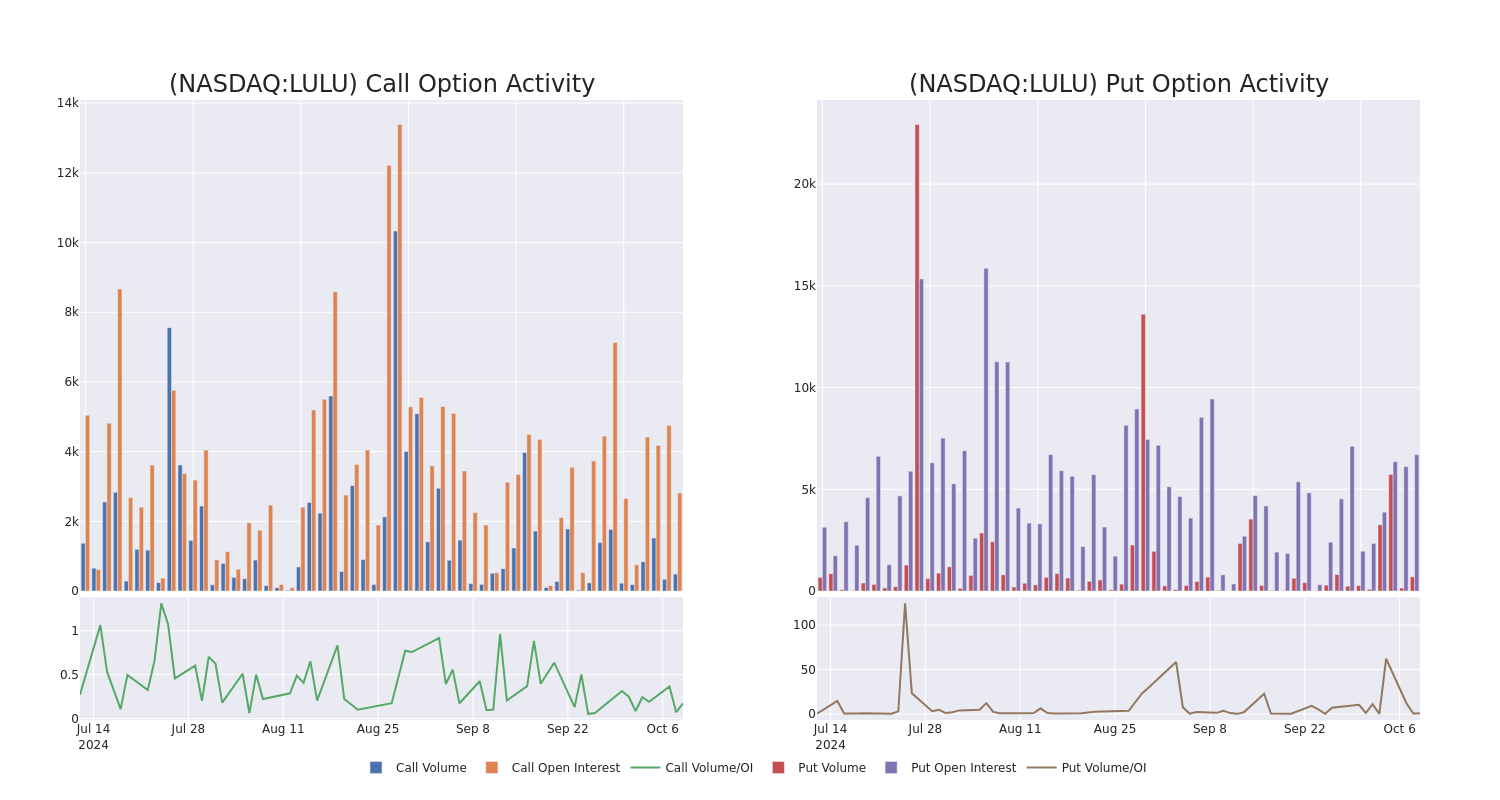
Biggest Options Spotted:
| Symbol | PUT/CALL | Trade Type | Sentiment | Exp. Date | Ask | Bid | Price | Strike Price | Total Trade Price | Open Interest | Volume |
|---|---|---|---|---|---|---|---|---|---|---|---|
| LULU | PUT | SWEEP | BULLISH | 10/18/24 | $11.1 | $10.7 | $10.74 | $280.00 | $179.4K | 1.0K | 167 |
| LULU | PUT | SWEEP | BEARISH | 10/18/24 | $3.65 | $3.4 | $3.57 | $265.00 | $119.4K | 814 | 344 |
| LULU | PUT | TRADE | BEARISH | 01/17/25 | $8.0 | $7.7 | $8.0 | $230.00 | $80.0K | 1.1K | 100 |
| LULU | PUT | SWEEP | BULLISH | 01/17/25 | $25.8 | $25.5 | $25.55 | $280.00 | $76.5K | 1.4K | 40 |
| LULU | CALL | SWEEP | NEUTRAL | 12/18/26 | $92.05 | $89.0 | $89.91 | $250.00 | $72.0K | 118 | 8 |
About Lululemon Athletica
Lululemon Athletica designs, distributes, and markets athletic apparel, footwear, and accessories for women, men, and girls. Lululemon offers pants, shorts, tops, and jackets for both leisure and athletic activities such as yoga and running. The company also sells fitness accessories, such as bags, yoga mats, and equipment. Lululemon sells its products through more than 700 company-owned stores in about 20 countries, e-commerce, outlets, and wholesale accounts. The company was founded in 1998 and is based in Vancouver, Canada.
Having examined the options trading patterns of Lululemon Athletica, our attention now turns directly to the company. This shift allows us to delve into its present market position and performance
Lululemon Athletica’s Current Market Status
- Trading volume stands at 881,663, with LULU’s price up by 0.33%, positioned at $277.5.
- RSI indicators show the stock to be may be approaching overbought.
- Earnings announcement expected in 57 days.
What The Experts Say On Lululemon Athletica
Over the past month, 1 industry analysts have shared their insights on this stock, proposing an average target price of $314.0.
Turn $1000 into $1270 in just 20 days?
20-year pro options trader reveals his one-line chart technique that shows when to buy and sell. Copy his trades, which have had averaged a 27% profit every 20 days. Click here for access.
* An analyst from Morgan Stanley has decided to maintain their Overweight rating on Lululemon Athletica, which currently sits at a price target of $314.
Trading options involves greater risks but also offers the potential for higher profits. Savvy traders mitigate these risks through ongoing education, strategic trade adjustments, utilizing various indicators, and staying attuned to market dynamics. Keep up with the latest options trades for Lululemon Athletica with Benzinga Pro for real-time alerts.
Market News and Data brought to you by Benzinga APIs
© 2024 Benzinga.com. Benzinga does not provide investment advice. All rights reserved.
Thermal Fluids for Industrial Heaters Market Size to Surge to USD 2.3 Billion by 2034 with a 5.2% CAGR- Exclusive Report by Transparency Market Research, Inc.
Wilmington, Delaware, United States, Transparency Market Research, Inc. , Oct. 09, 2024 (GLOBE NEWSWIRE) — The global thermal fluids for Industrial Heaters market (fluides thermiques pour le marché des radiateurs industriels ) is estimated to thrive at a CAGR of 5.2% from 2024 to 2034. Transparency Market Research projects that the overall sales revenue for thermal fluids for industrial heaters is estimated to reach US$ 2.3 billion by the end of 2034.
Key Players –
Some prominent players are as follows:
- Eastman Chemical Company
- Dow
- ExxonMobil
- BASF SE
- Houghton International
- Calumet Specialty Products Partners L.P.
- NuGenTec
Request a PDF Sample of this Report Now!
https://www.transparencymarketresearch.com/sample/sample.php?flag=S&rep_id=86025

A key factor is the increasing focus on predictive maintenance and condition monitoring technologies. By leveraging IoT sensors and data analytics, companies can optimize thermal fluid performance, minimize downtime, and extend equipment lifespan, driving operational efficiency and cost savings.
The emergence of niche applications in industries such as pharmaceuticals, biotechnology, and food processing is driving demand for specialized thermal fluids with specific properties like non-toxicity, high purity, and compatibility with stringent hygiene standards.
The growing trend towards decentralized energy systems and microgrids is creating new opportunities for thermal fluid applications in district heating, cogeneration, and waste heat recovery schemes. These systems offer enhanced energy efficiency and resilience, particularly in urban environments and remote industrial facilities.
The increasing adoption of electric heating technologies, such as induction and resistive heating, is reshaping the thermal fluids market landscape. While traditional combustion-based heaters remain prevalent, electric heating systems offer advantages in terms of precision control, cleanliness, and safety, driving demand for compatible thermal fluids tailored to these applications.
Key Findings of the Market Report
- Gas heaters lead the thermal fluids for industrial heaters market due to their widespread adoption, efficiency, and versatility across various industrial applications.
- The oil & gas segment is leading the thermal fluids for industrial heaters market, driven by its extensive use in upstream and downstream operations.
- North America leads the thermal fluids for industrial heaters market, driven by a mature industrial sector and stringent environmental regulations.
Thermal Fluids for Industrial Heaters Market Growth Drivers & Trends
- Increasing demand for energy-efficient heating solutions drives the adoption of thermal fluids in various industries worldwide.
- Technological advancements lead to the development of high-performance and eco-friendly formulations, enhancing market competitiveness.
- Growing emphasis on industrial safety and regulatory compliance fuels the demand for reliable and stable thermal fluids.
- Expansion of industrial activities in emerging economies, particularly in Asia Pacific, creates lucrative opportunities for market growth.
- Rising investments in renewable energy and sustainable manufacturing practices drive the integration of thermal fluid systems in eco-conscious industries.
Global Thermal Fluids for Industrial Heaters Market: Regional Profile
- In North America, a mature industrial sector and stringent environmental regulations drive the demand for high-performance thermal fluids. Leading companies like Dow and ExxonMobil dominate the market with their advanced formulations, catering to diverse industrial applications such as oil and gas, chemical processing, and food manufacturing. The region’s focus on energy efficiency and sustainability further fuels market growth.
- Europe stands as a significant market for thermal fluids, buoyed by robust industrial infrastructure and a strong emphasis on environmental stewardship. Companies like Shell and BASF offer innovative solutions tailored to the region’s stringent regulatory requirements, particularly in industries such as automotive, pharmaceuticals, and renewable energy.
- Asia Pacific emerges as a rapidly growing market for thermal fluids, driven by industrialization, urbanization, and infrastructure development. Countries like China, India, and Japan witness increasing adoption of thermal fluids in sectors like electronics, textiles, and construction.
- Local players such as Sinopec and PetroChina are expanding their product offerings to meet the region’s growing demand, presenting lucrative opportunities for market players looking to capitalize on the region’s burgeoning industrial landscape.
Unlock Growth Potential in Your Industry! Download PDF Brochure: https://www.transparencymarketresearch.com/sample/sample.php?flag=S&rep_id=86025
Thermal Fluids for Industrial Heaters Market: Competitive Landscape
In the competitive landscape of the thermal fluids for industrial heaters market, several key players vie for dominance. Established companies like Dow, ExxonMobil, and Eastman Chemical Company lead with their extensive product portfolios and global presence. They offer a wide range of high-performance thermal fluids tailored to various industrial applications, ensuring reliability and efficiency.
Emerging players such as Shell and Chevron are gaining traction with their focus on innovation and sustainability, introducing advanced formulations and eco-friendly solutions. This intense competition fosters continuous innovation, driving the market forward while meeting the diverse needs of industries worldwide.
Product Portfolio
- Eastman Chemical Company offers a diverse portfolio of specialty materials, including chemicals, plastics, and fibers. With a focus on innovation and sustainability, Eastman’s solutions cater to various industries, from packaging and transportation to construction and consumer goods, enabling customers to create safer and more sustainable products.
- Dow is a global leader in materials science, delivering a wide range of innovative products and solutions across multiple industries. From plastics and chemicals to coatings and agriculture, Dow’s portfolio empowers customers to address pressing challenges and drive sustainable growth while enhancing everyday lives worldwide.
Email Directly Here with Detail Information: sales@transparencymarketresearch.com
Thermal Fluids for Industrial Heaters Market: Key Segments
By Type
- Electric Heaters
- Gas Heaters
- Steam Heaters
- Oil Heaters
- Solar Heaters
- Others
By End Use
- Chemical
- Oil & Gas
- Food & Beverage
- Pharmaceutical
- Automotive
- Others
By Region
- North America
- Europe
- Asia Pacific
- Latin America
- Middle East & Africa
Buy this Premium Research Report: https://www.transparencymarketresearch.com/checkout.php?rep_id=86025<ype=S
More Trending Reports by Transparency Market Research –
About Transparency Market Research
Transparency Market Research, a global market research company registered at Wilmington, Delaware, United States, provides custom research and consulting services. Our exclusive blend of quantitative forecasting and trends analysis provides forward-looking insights for thousands of decision makers. Our experienced team of Analysts, Researchers, and Consultants use proprietary data sources and various tools & techniques to gather and analyses information.
Our data repository is continuously updated and revised by a team of research experts, so that it always reflects the latest trends and information. With a broad research and analysis capability, Transparency Market Research employs rigorous primary and secondary research techniques in developing distinctive data sets and research material for business reports.
Contact:
Transparency Market Research Inc.
CORPORATE HEADQUARTER DOWNTOWN,
1000 N. West Street,
Suite 1200, Wilmington, Delaware 19801 USA
Tel: +1-518-618-1030
USA – Canada Toll Free: 866-552-3453
Website: https://www.transparencymarketresearch.com
Email: sales@transparencymarketresearch.com
Follow Us: LinkedIn| Twitter| Blog | YouTube

© 2024 Benzinga.com. Benzinga does not provide investment advice. All rights reserved.
Will Nokia's Q3 Earnings be Hurt by a Top Line Contraction?
Nokia Corporation NOK is set to report its third-quarter 2024 results on Oct. 17, before the opening bell. In the last reported quarter, it reported adjusted earnings of 6 cents per share.
The company is expected to witness a revenue contraction year over year, owing to demand softness in several business segments. Intensifying competition, macroeconomic headwinds, and growing geopolitical unrest are major headwinds. However, efforts to bolster the position in the 5G ecosystem with a strong emphasis on innovation and portfolio expansion are positive.
Factors at Play
In the third quarter, Nokia secured a multi-year agreement for an undisclosed amount from AT&T Inc. to help modernize the fiber infrastructure of the telecom carrier. Per the five-year deal, Nokia will deploy its Lightspan MF and Altiplano platforms to develop state-of-the-art networks to cater to the growing demand for more capacity and enhanced broadband services. Nokia has also entered into a three-year agreement with Vodafone Idea Limited to enhance and expand its 4G and 5G networks in India.
The company also inked a multi-year 5G RAN (Radio Access Network) contract with MEO, one of Portugal’s leading mobile operators to upgrade its network infrastructure. These are likely to have supported Nokia’s top line during the quarter.
During the quarter, Nokia inked a partnership agreement with Telekom Malaysia to enhance data center connectivity across Malaysia by deploying a cutting-edge Dense Wavelength Division Multiplexing network. A Taiwan-based broadband operator, Homeplus, deployed Nokia’s state-of-the-art PON fiber solution to strengthen network visibility and improve end-user experience.
A prominent Brazilian telecommunication company, TiM Brasil, has leveraged NOK’s industry-leading 5G AirScale portfolio to expand its 5G Radio Access Network coverage across Brazil. These customer wins are expected to have a positive impact on the third-quarter results.
In the quarter under review, Nokia Bell Labs, the research wing of Nokia, inked a year-long, non-binding memorandum of understanding with e& to collaborate on research & development efforts on artificial intelligence-based use cases across various industrial sectors.
However, a slowdown in 5G investment in several regions, including India, intensifying competition is expected to have hindered Nokia’s top-line growth. Growing geopolitical instability remains a major concern.
Our estimate for revenues from the Mobile Networks vertical is pegged at €1.86 billion ($2.04 billion), suggesting a 13.6% year-over-year decline. For the Network Infrastructure segment, our estimate for revenues is pegged at €1.87 billion ($2.05 billion), implying 21.9% year-over-year growth. Revenues from Cloud & Network Services are estimated at €789.3 million ($867.4 million).
For the September Quarter, the Zacks Consensus Estimate for the company’s total revenues is pegged at $5.10 billion, indicating a decrease from $5.42 billion reported in the prior-year quarter. Adjusted earnings per share are pegged at 7 cents, suggesting an increase from the prior-year quarter’s tally of 5 cents.
Earnings Whispers
Our proven model does not conclusively predict an earnings beat for Nokia this time around. The combination of a positive Earnings ESP and a Zacks Rank #1 (Strong Buy), 2 (Buy), or 3 (Hold) increases the chances of an earnings beat. This is not the case here.
Earnings ESP: Earnings ESP, which represents the difference between the Most Accurate Estimate and the Zacks Consensus Estimate, is 0.00%, with both pegged at 7 cents.
Zacks Rank: Nokia currently has a Zacks Rank #2.
Stocks to Consider
Here are some companies you may want to consider, as our model shows that these have the right combination of elements to post an earnings beat this season:
Corning Incorporated GLW is set to release quarterly numbers on Oct. 29. It has an Earnings ESP of +1.16% and carries a Zacks Rank #3.
The Earnings ESP for T-Mobile US, Inc. TMUS is +0.70%, and it carries a Zacks Rank of 3. The company is scheduled to report quarterly numbers on Oct. 23.
The Earnings ESP for Qorvo Inc. QRVO is +0.16%, and it carries a Zacks Rank of 3. The company is scheduled to report quarterly numbers on Nov. 06.
Note: €1 = $1.09893 (period average from July 1, 2024, to Sept. 30, 2024).
© 2024 Benzinga.com. Benzinga does not provide investment advice. All rights reserved.
TSMC's third-quarter revenue easily beats market forecast
TAIPEI (Reuters) -TSMC, the world’s largest contract chipmaker, reported on Wednesday third-quarter revenue that easily beat both the market and company’s own forecasts as it reaped the benefit from artificial intelligence (AI) demand.
Taiwan Semiconductor Manufacturing Co, whose customers include Apple and Nvidia, has been at the forefront of the march towards AI that has helped it weather the tapering off of pandemic-led demand.
Revenue in the July-September period of this year came in at T$759.69 billion ($23.62 billion), according to Reuters calculations, compared with an LSEG SmartEstimate of T$750.36 billion ($23.33 billion) drawn from 23 analysts.
That represents growth of 36.5% on-year, compared with $17.3 billion in the year-ago period.
It is not a direct comparison as TSMC provides monthly revenue data only in Taiwan dollars, but gives quarterly revenue figures and its outlook on its quarterly earnings calls both in U.S. dollars.
On its most recent earnings call in July, TSMC forecast third quarter revenue in a range of between $22.4 billion to $23.2 billion.
For September alone, TSMC reported revenue jumped 39.6% year-on-year to T$251.87 billion.
The company did not provide details in its brief revenue statement.
TSMC will report full third quarter earnings on Oct. 17, when it will also update its outlook.
The company’s Taipei listed stock has risen 72% so far this year, compared with a 26% gain for the broader market.
It closed up 1% on Wednesday ahead of the release of the revenue numbers.
($1 = 32.1620 Taiwan dollars)
(Reporting by Ben Blanchard and Yimou Lee; Editing by Neil Fullick and Lincoln Feast.)
The Designery to serve Metro Cincinnati area with new location
Owners Joel and Amy Senger’s experiences in homebuilding and real estate provide them with the perfect background to market the home renovation franchise
CINCINNATI, Oct. 9, 2024 /PRNewswire/ — The Designery, an immersive, full-service kitchen, bath and closet design center featuring high-quality cabinets, countertops and flooring, celebrates the grand opening of its first Ohio location with a ribbon-cutting and social event from 4- 6 p.m. on Oct. 23 at the showroom at 1895 Airport Exchange Boulevard, Suite 220, Erlanger, Kentucky.
The event will also feature giveaways and door prizes from Yeti, Solo Stove and others.
The Designery Metro Cincinnati owners Joel and Amy Senger say they want to bring customized design and renovation services to the southern Ohio and northern Kentucky region. The couple moved to the Cincinnati area from the Dallas-Fort Worth area in April 2023.
“We owned and operated Senger Custom Homes in Texas where we specialized in customized new home builds and high-end renovations and remodels,” Joel Senger said. “After moving to the Cincinnati area last year, we begin remodeling the home that we purchased. When we had trouble finding one place that offered everything we needed for our remodeling project, we decided to draw upon our experience and bring a Designery location to this area.”
Senger, a Montana native, worked as a homebuilder and superintendent for DR Horton and Antares Homes in Texas for almost 10 years. He also has experience in building custom cabinetry and won Fort Worth Magazine’s Best Remodeling Contractor award in 2019. The couple also owned a pool construction business in Texas, and Senger won an award for best outdoor environment in 2021.
Senger’s wife, Amy, worked in real estate finance and in the mortgage industry for nearly 20 years, and says she’s looking forward to helping clients in the Cincinnati area with their renovation needs.
“We believe the skills we’ve gained over the past several years in the construction and real estate financing industries will give us a competitive edge,” she said. “We also love it here. The people are so incredibly friendly here. The pace is much slower than the larger urban area we came from but is still large enough to find something fun to do.”
The couple have been married for more than 13 years, and have two children, Marley, 15, and Andie, 10. Amy Senger is also a certified Biblical counselor and volunteers a few hours a week for a ministry that offers free Biblical counseling.
The Designery Cincinnati Metro will serve residents in Covington, Edgewood, Erlanger, Fort Mitchell, Fort Thomas and Newport Kentucky, and in Blue Ash, Cheviot, Cincinnati, Delhi, Florence. Loveland, Mack, Maderia, Maineville, Mason, Monfort Heights, Norwood, Reading, Sharonville and Wyoming, Ohio.
The Designery’s in-house design expertise and extensive selection of products, including more than 100 cabinet styles, provide advantages to both homeowners and contractors. Its showrooms provide the ideal setting for personal design consultation, material and finish selection, and a virtual reality design view.
For more information about The Designery Cincinnati Metro, visit https://thedesignery.com/locations/cincinnati-metro/.
About The Designery
The Designery was founded in 2007 as A1 Kitchen and Bath, a product wholesale outlet serving the Chattanooga, Tennessee market. In 2019, it rebranded as The Designery and established a franchise model to expand its unique concept: to simplify the kitchen, bath and closet design process by offering premium products, design expertise, project management and trusted professional installation. Its selection of high-quality cabinets, flooring, countertops and accessories makes it a destination for any remodeling, renovation or new construction project. It is a one-stop shop for homeowners and a trusted partner for contractors, with knowledgeable staff to walk clients through every step, from design to project management and installation. The Designery’s immersive showroom and personalized guidance bring luxurious designs to life without the luxury price tag. To learn more about The Designery, please visit https://thedesignery.com/.
About HomeFront Brands:
HomeFront Brands empowers entrepreneurs to create thriving franchised residential and commercial property service brands. Driven by an experienced team of franchise executives and rooted in family values, HomeFront Brands helps emerging or established concepts accelerate their growth by delivering enterprise-level solutions to local business owners who aspire to build a dynasty and create generational wealth. By leveraging integrated technology, data-driven intelligence and advanced learning management systems, HomeFront Brands is building a foundation for its brands — Window Hero, The Designery, Temporary Wall Systems, Top Rail Fence and Yard Patrol Pros – to transform lives through franchise ownership.
For more information about HomeFront Brands’ current solutions, new business development, and franchising opportunities, please visit https://homefrontbrands.com/.
MEDIA CONTACT:
Heather Ripley
Ripley PR
865-977-1973
hripley@ripleypr.com
![]() View original content to download multimedia:https://www.prnewswire.com/news-releases/the-designery-to-serve-metro-cincinnati-area-with-new-location-302270865.html
View original content to download multimedia:https://www.prnewswire.com/news-releases/the-designery-to-serve-metro-cincinnati-area-with-new-location-302270865.html
SOURCE HomeFront Brands
© 2024 Benzinga.com. Benzinga does not provide investment advice. All rights reserved.
AT&T's Fiber Price Hike Will Boost Revenue in 2025
While most of telecom-giant AT&T‘s (NYSE: T) revenue comes from its wireless service, the company is growing its fiber internet business. It has the benefit of already having some infrastructure in place in the markets it’s targeting for fiber service, which makes expanding the network less capital-intensive.
Still, building out a fiber network is a costly endeavor that only pays off once households and businesses sign up for and stick with the service. AT&T plans to reach at least 30 million potential customer locations by the end of 2025 with its fiber network, but only a fraction of those locations will pay for the service.
At the end of the second quarter of 2025, AT&T had about 8.8 million fiber connections with 27.8 million locations passed. Excluding businesses, the fiber penetration rate for AT&T was about 40%.
Growing the fiber business
There are three ways for AT&T to drive growth in its fiber business. First, it can pass more locations with its network to create more potential customers. The company should add a few more million locations over the next year and sees a path to as many as 45 million locations passed down the road.
Second, the company can boost the penetration rate by convincing more eligible households and businesses to sign up for the service. The consumer fiber penetration rate has increased by about 3 percentage points over the past two years, so the company is making some headway on this front.
Third, AT&T can raise prices. Average monthly revenue per fiber customer was $69 in the second quarter of 2024, up from $61.65 two years prior, and that number will climb even higher in 2025 as the company enacts a broad price hike.
Starting Nov. 10, AT&T will raise the monthly price on all its internet plans, both fiber and non-fiber, by $5 per month. AT&T offers discounts for customers using autopay and paying with a bank account, so the average revenue per subscriber may rise by less than that amount as subscribers look to lower their bills. Still, this price hike represents a 7.2% increase, based on the average revenue per subscriber in the second quarter.
Combined with winning more customers by building out the network and raising penetration rates, AT&T should have no trouble growing fiber revenue at a double-digit pace in 2025. Fiber revenue rose by about 18% year over year in the second quarter.
Free-cash-flow growth
AT&T will spend between $21 billion and $22 billion in capital expenditures this year, much of which will go to supporting its wireless and fiber networks. Despite that spending, free cash flow is expected to come in between $17 billion and $18 billion, up from $16.8 billion in 2023.
The fiber business is now at a $7.2 billion annual revenue run rate, and that number should continue to grow at a double-digit rate. Building out fiber capacity is capital intensive, but fiber lines require little in the way of maintenance and can last for decades. As AT&T reaches the mature stages of its fiber buildout, the business will start throwing off plenty of cash.
AT&T stock has soared more than 50% over the past year as investors have warmed up to the telecom giant. Despite that rally, the stock still trades for less than 9x the midpoint of the company’s free-cash-flow guidance. Shares of AT&T aren’t as cheap as they were a year ago, but it’s not too late to buy this cash-flow machine.
Should you invest $1,000 in AT&T right now?
Before you buy stock in AT&T, consider this:
The Motley Fool Stock Advisor analyst team just identified what they believe are the 10 best stocks for investors to buy now… and AT&T wasn’t one of them. The 10 stocks that made the cut could produce monster returns in the coming years.
Consider when Nvidia made this list on April 15, 2005… if you invested $1,000 at the time of our recommendation, you’d have $782,682!*
Stock Advisor provides investors with an easy-to-follow blueprint for success, including guidance on building a portfolio, regular updates from analysts, and two new stock picks each month. The Stock Advisor service has more than quadrupled the return of S&P 500 since 2002*.
*Stock Advisor returns as of October 7, 2024
Timothy Green has positions in AT&T. The Motley Fool has no position in any of the stocks mentioned. The Motley Fool has a disclosure policy.
AT&T’s Fiber Price Hike Will Boost Revenue in 2025 was originally published by The Motley Fool

