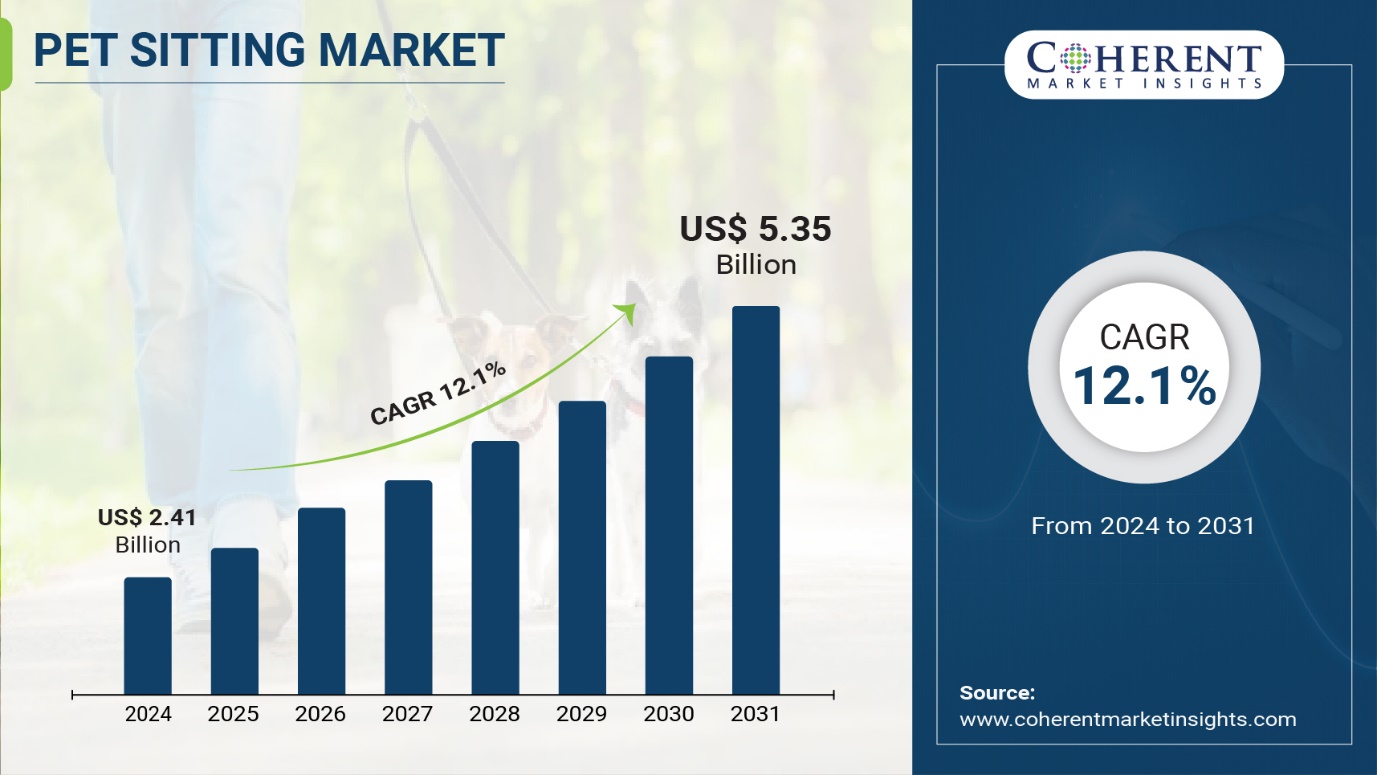
Pet Sitting Market to hit $5.35 billion by 2031, growing at 12.1% CAGR, says Coherent Market Insights (CMI)
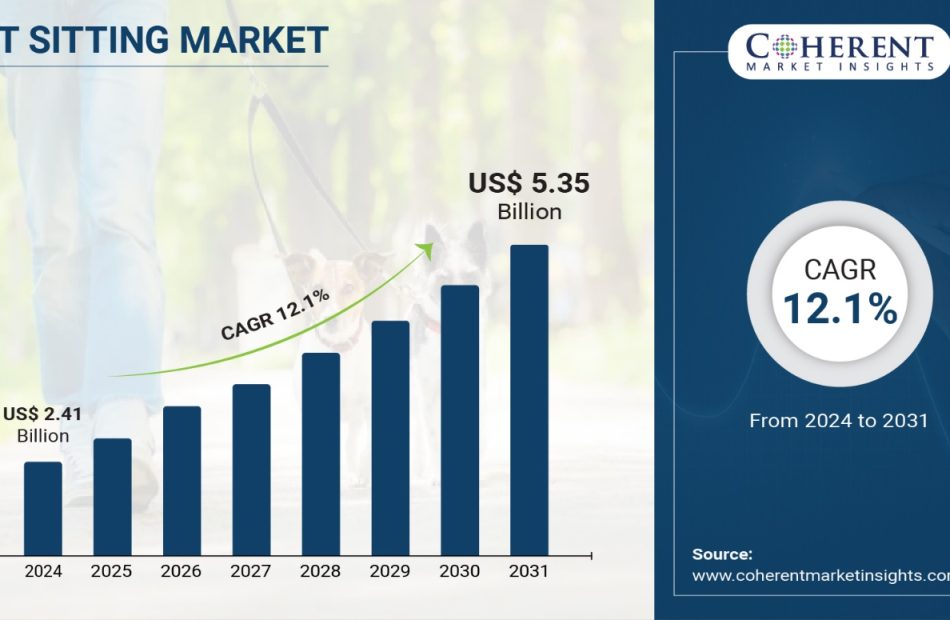
Burlingame, Oct. 09, 2024 (GLOBE NEWSWIRE) — The global pet sitting market, valued at 2.41 billion dollars in 2024, is on a trajectory of rapid expansion, with projections indicating it will soar to 5.35 billion dollars by 2031, at a Compound Annual Growth Rate (CAGR) of 12.1% during the forecast period, as highlighted in a new report published by Coherent Market Insights. Rising demand for reliable pet care services has risen considerably when owners are away on business trips or vacations. Pet sitting offers pet parents peace of mind knowing their furry companions are being well looked after in their own home environment with daily visits and activities. This driver has significantly boosted the growth of the pet sitting industry.
Request Sample of the Report on Pet Sitting Market Forecast 2031: https://www.coherentmarketinsights.com/insight/request-sample/7165
Market Dynamics
The growth of the pet sitting market is attributed to the increased pet ownership and humanization of pets. According to the American Pet Products Association, around 70 million homes in the U.S. own at least one pet. Owning a pet has positive impact on mental and physical health of owners. However, pet owners face challenges to take care of their pets when they are on vacations or business trips. This drives the demand for pet sitting services wherein professional pet sitters take care of pets at their homes, providing them food, water, medication if needed, playtime and walks. Another factor fueling the market growth is increasing number of nuclear families wherein both partners have career responsibilities leaving little time to take care of pets. This has increased the acceptance and demand for pet sitting services.
Pet Sitting Market Report Coverage
| Report Coverage | Details |
| Market Revenue in 2024 | $2.41 billion |
| Estimated Value by 2031 | $5.35 billion |
| Growth Rate | Poised to grow at a CAGR of 12.1% |
| Historical Data | 2019–2023 |
| Forecast Period | 2024–2031 |
| Forecast Units | Value (USD Million/Billion) |
| Report Coverage | Revenue Forecast, Competitive Landscape, Growth Factors, and Trends |
| Segments Covered | By Pet Type, By Service Type |
| Geographies Covered | North America, Europe, Asia Pacific, and Rest of World |
| Growth Drivers | • Rising number of pet owners • Rising affluence and humanization of pets |
| Restraints & Challenges | • High service charges • Lack of trust among pet owners |
Market Trends
Advent of online pet sitting platforms: Major players in the market are focusing on developing online platforms for sourcing pet sitters as well as for pet owners to book sitting services. These platforms provide transparency and convenience to users. For instance, Rover.com connects pet owners with pet sitters nearby who can drop-in, walk, feed, and care for pets. Such platforms are gaining increasing traction among millennial pet owners who are frequent travelers and career-driven.
Mobile applications for pet sitting: Market players are also offering mobile applications for pet sitting convenience. These mobile apps help pet owners track pet sitter’s location, receive photos and updates about their pets, and make payments. They also provide safety features like verification of pet sitter’s credentials. For example, Wag offers a mobile app for both IOS and Android to match pet owners with local pet sitters, track visits, and make payments. Such tech-enabled services are expected to drive the pet sitting market.
Immediate Delivery Available | Buy This Premium Research Report@ https://www.coherentmarketinsights.com/insight/buy-now/7165
Market Opportunities
The care visits segment involves regular visits by pet sitters to feed, walk and play with pets when the owners are away. This segment accounts for around 60% of the total pet sitting market currently owing to the assurance and personalized attention it provides pets. Being away from home for long hours puts stress on pets and regular care visits help reduce anxiety and maintain their daily routine and bonding with the sitter. With increasing pet ownership and dual income households where owners travel more frequently, the need for reliable care visits is growing steadily.
While care visits ensure pets remain well taken care of during longer owner absences, drop-in visits are a convenient option for shorter trips or when paired with care visits. They involve brief check-ins by sitters to feed, play and tend to pets for a few minutes. This segment is growing at a faster pace compared to care visits driven by flexibility and cost savings it provides owners. Busy lifestyles mean taking more occasional short trips which makes pre-scheduled drop-ins a suitable solution for many pet parents.
Key Market Takeaways
The global pet sitting market is anticipated to witness a CAGR of 12.1% during the forecast period 2024-2031, owing to rising pet ownership and humanization of pets.
On the basis of pet type, the dogs segment is expected to hold a dominant position, accounting for around 65% share due to their popularity as pets and regular need for care when left alone.
On the basis of service type, the care visits segment is expected to hold a dominant position over the forecast period, contributing to more than 60% revenue share due to the personalized daily care and reassurance it provides pets and owners.
On the basis of region, North America is expected to hold a dominant position over the forecast period, with the US alone constituting over 45% of market share. This can be attributed to high pet spending and preference for professional pet care in the region.
Some of the leading players operating in the global pet sitting market include A Place for Rover, Inc., Pets at Home, Inc., Wag! Group Co. The pet sitting industry is expected to experience considerable consolidation as large players look to enhance market share through mergers and acquisitions.
Pet Sitting Industry News
In September 2022, PetSmart collaborated with interior designers Nate Berkus and Jeremiah Brent by launching a collection of couches, beds, stands, etc., designed specifically for pets and pet parents’ comfort & needs.
In May 2022, Kimpton Hotels & Restaurants partnered with Wag! Offering on-property & at-home walks and drop-ins for guests staying in their hotels across the U.S.
Request For Customization@ https://www.coherentmarketinsights.com/insight/request-customization/7165
Detailed Segmentation-
By Pet Type
By Service Type
- Care Visits
- Drop-in Visits
- Dog Walking
- Boarding
- Pet Transportation
- Others
By Region:
- North America
- Latin America
- Brazil
- Argentina
- Mexico
- Rest of Latin America
- Europe
- Germany
- U.K.
- Spain
- France
- Italy
- Russia
- Rest of Europe
- Asia Pacific
- China
- India
- Japan
- Australia
- South Korea
- ASEAN
- Rest of Asia Pacific
- Middle East
- GCC Countries
- Israel
- Rest of Middle East
- Africa
- South Africa
- North Africa
- Central Africa
Have a Look at Trending Research Reports on Pharmaceutical Domain:
Global Pet Tech Market is estimated to be valued at US$ 8.12 Bn in 2024 and is expected to reach US$ 20.45 Bn by 2031, exhibiting a compound annual growth rate (CAGR) of 14.1% from 2024 to 2031.
Global PET packaging market was valued at US$ 61.9 Mn in 2023 exhibiting a CAGR of 7.7% in terms of revenue, over the forecast period (2023 to 2030) to reach US$ 104.1 Mn by 2030.
Global pet furniture market is estimated to be valued at USD 7.01 Bn in 2024 and is expected to reach USD 10.65 Bn by 2031, growing at a compound annual growth rate (CAGR) of 6.2% from 2024 to 2031.
Global pet food bowl market is estimated to be valued at USD 3.66 Bn in 2024 and is expected to reach USD 5.22 Bn by 2031, exhibiting a compound annual growth rate (CAGR) of 5.2% from 2024 to 2031.
About Us:
Coherent Market Insights is a global market intelligence and consulting organization that provides syndicated research reports, customized research reports, and consulting services. We are known for our actionable insights and authentic reports in various domains including aerospace and defense, agriculture, food and beverages, automotive, chemicals and materials, and virtually all domains and an exhaustive list of sub-domains under the sun. We create value for clients through our highly reliable and accurate reports. We are also committed in playing a leading role in offering insights in various sectors post-COVID-19 and continue to deliver measurable, sustainable results for our clients.

Mr. Shah
Senior Client Partner – Business Development
Coherent Market Insights

Phone:
US: +1-650-918-5898
UK: +44-020-8133-4027
AUS: +61-2-4786-0457
India: +91-848-285-0837
Email: sales@coherentmarketinsights.com
Website: https://www.coherentmarketinsights.com
© 2024 Benzinga.com. Benzinga does not provide investment advice. All rights reserved.
Domino's Earnings Are Imminent; Here Are The Recent Forecast Changes From Wall Street's Most Accurate Analysts
Domino’s Pizza, Inc. DPZ will release earnings results for its third quarter, after the closing bell on Thursday, Oct. 10.
Analysts expect the Ann Arbor, Michigan-based company to report quarterly earnings at $3.65 per share, down from $4.18 per share in the year-ago period. Domino’s projects to report revenue of $1.1 billion for the quarter, according to data from Benzinga Pro.
On July 18, the company reported second-quarter FY24 sales growth of 7.1% year-on-year to $1.097 billion, missing the analyst consensus estimate of $1.103 billion.
Domino’s shares gained 0.3% to close at $411.15 on Tuesday.
Benzinga readers can access the latest analyst ratings on the Analyst Stock Ratings page. Readers can sort by stock ticker, company name, analyst firm, rating change or other variables.
Let’s have a look at how Benzinga’s most-accurate analysts have rated the company in the recent period.
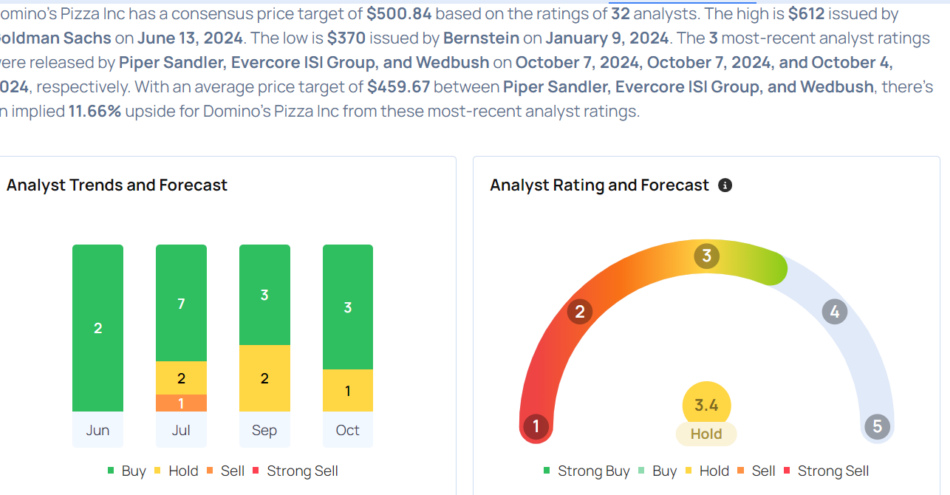
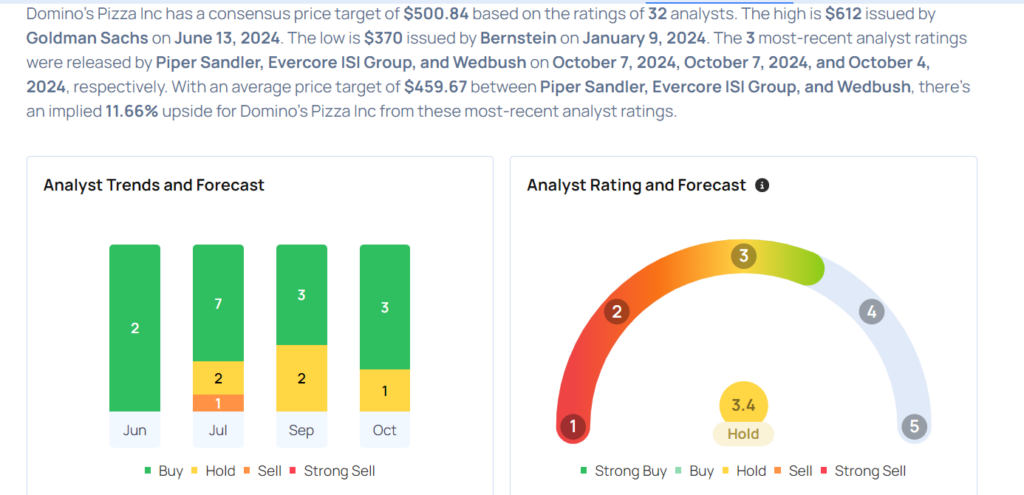
- Piper Sandler analyst Brian Mullan maintained a Neutral rating and cut the price target from $436 to $429 on Oct. 7. This analyst has an accuracy rate of 78%.
- Wedbush analyst Nick Setyan maintained an Outperform rating and slashed the price target from $510 to $470 on Oct. 4. This analyst has an accuracy rate of 71%.
- Guggenheim analyst Gregory Francfort maintained a Neutral rating and decreased the price target from $485 to $460 on Sept. 26. This analyst has an accuracy rate of 71%.
- JP Morgan analyst John Ivankoe maintained a Neutral rating and boosted the price target from $450 to $470 on Sept. 16. This analyst has an accuracy rate of 72%.
- TD Cowen analyst Andrew Charles maintained a Buy rating and slashed the price target from $520 to $475 on Sept. 16. This analyst has an accuracy rate of 73%.
Considering buying DPZ stock? Here’s what analysts think:
Read This Next:
Market News and Data brought to you by Benzinga APIs
© 2024 Benzinga.com. Benzinga does not provide investment advice. All rights reserved.
Cryptocurrency Immutable Falls More Than 3% In 24 hours
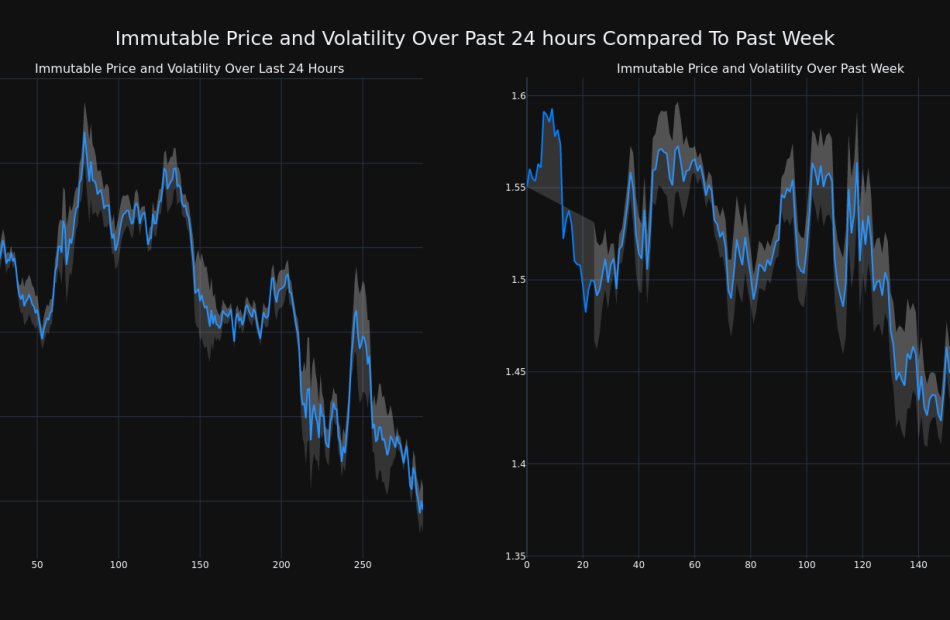
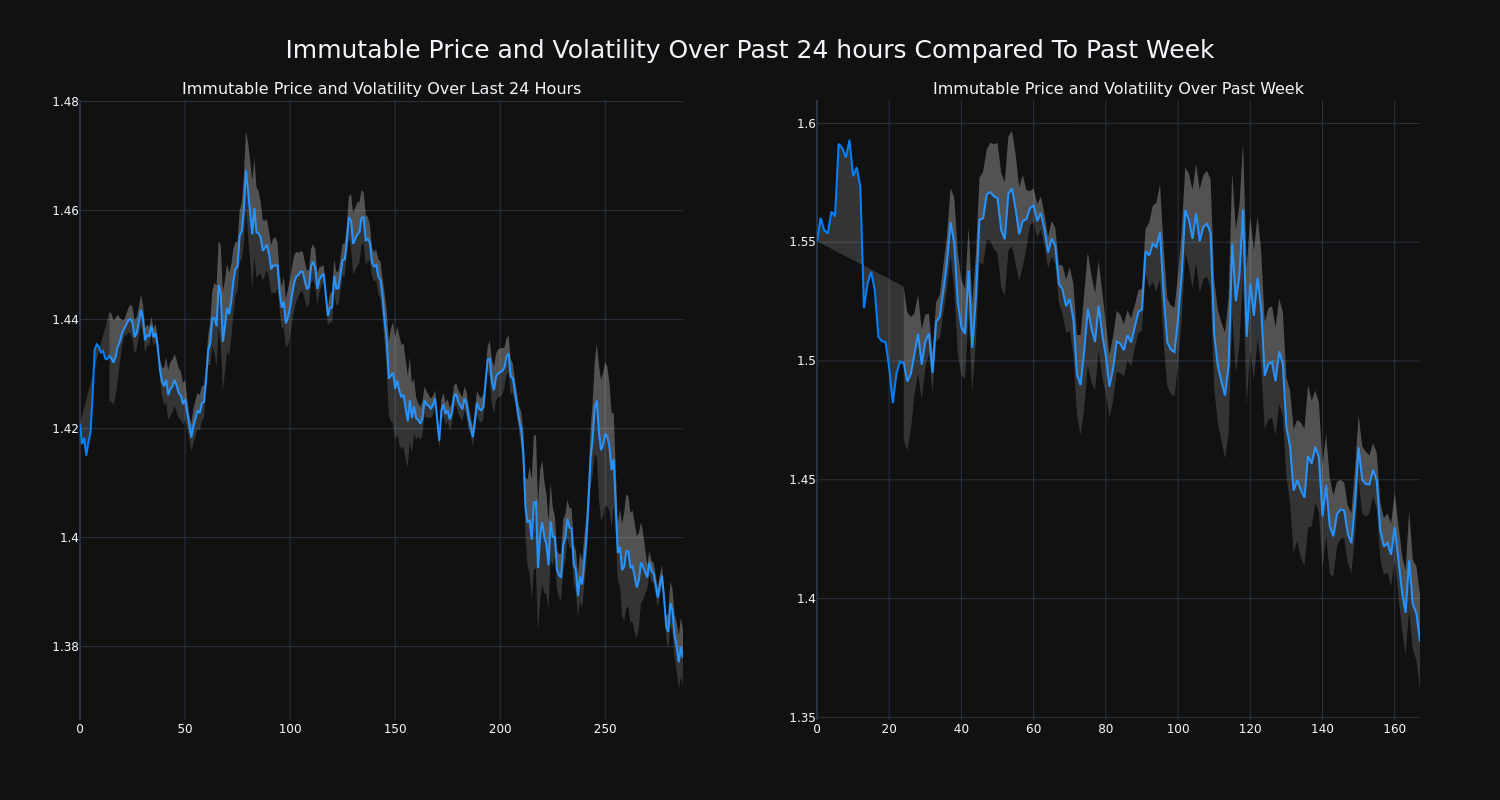
Over the past 24 hours, Immutable’s IMX/USD price has fallen 3.05% to $1.38. This continues its negative trend over the past week where it has experienced a 11.0% loss, moving from $1.55 to its current price.
The chart below compares the price movement and volatility for Immutable over the past 24 hours (left) to its price movement over the past week (right). The gray bands are Bollinger Bands, measuring the volatility for both the daily and weekly price movements. The wider the bands are, or the larger the gray area is at any given moment, the larger the volatility.
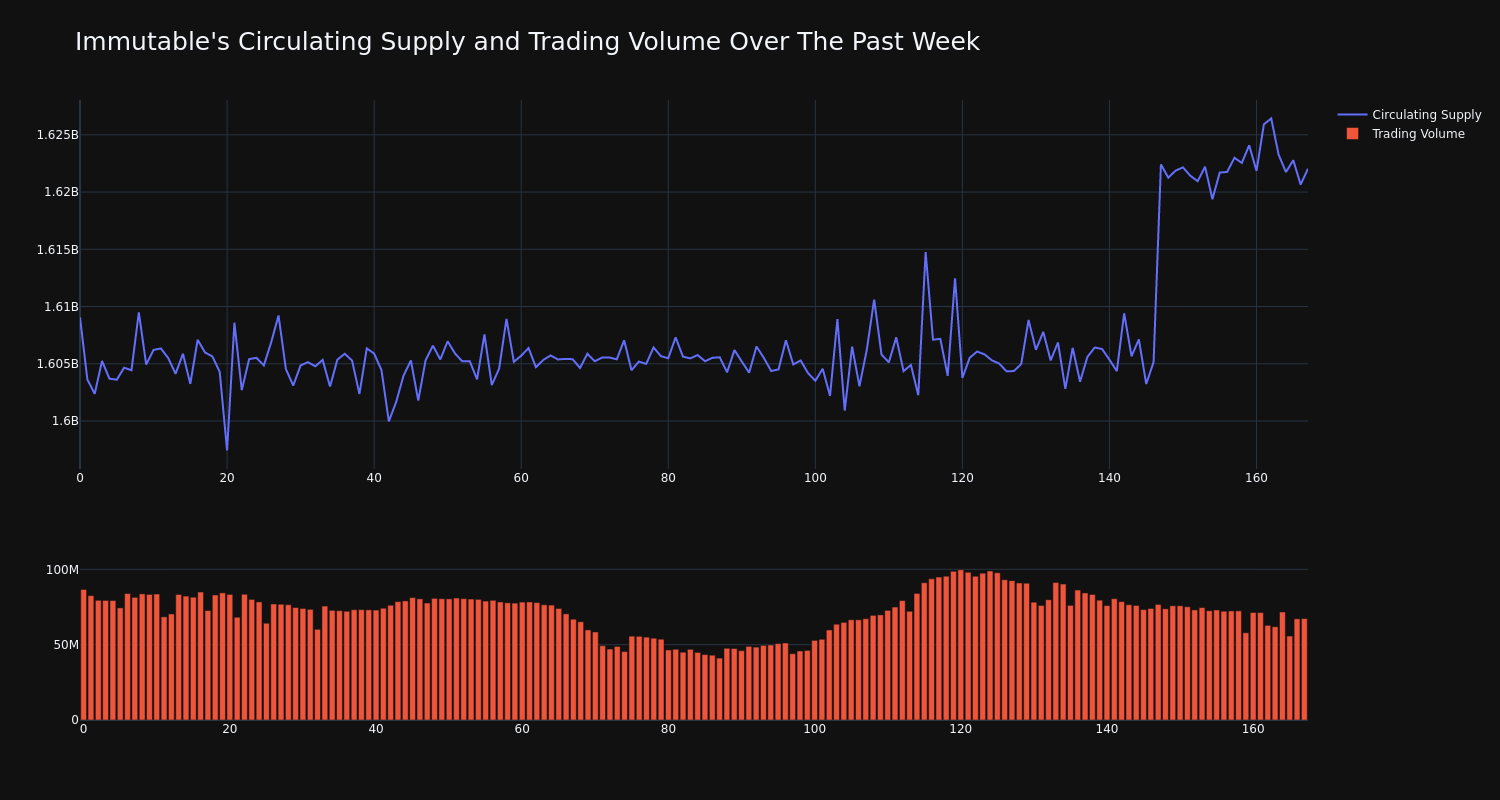
The trading volume for the coin has tumbled 22.0% over the past week while the circulating supply of the coin has risen 0.81%. This brings the circulating supply to 1.62 billion, which makes up an estimated 81.09% of its max supply of 2.00 billion. According to our data, the current market cap ranking for IMX is #43 at $2.23 billion.
This article was generated by Benzinga’s automated content engine and reviewed by an editor.
Market News and Data brought to you by Benzinga APIs
© 2024 Benzinga.com. Benzinga does not provide investment advice. All rights reserved.
Skin Rash Treatment Market to reach $5.70 Billion by 2031, growing at 6.5% CAGR: Coherent Market Insights
Burlingame, Oct. 09, 2024 (GLOBE NEWSWIRE) — The global skin rash treatment market Size to Grow from USD 3.67 billion in 2024 to USD 5.70 billion by 2031, at a Compound Annual Growth Rate (CAGR) of 6.5% during the forecast period, as highlighted in a new report published by Coherent Market Insights. Growing geriatric population is also expected to drive market growth as skin conditions are highly prevalent among the older population. Meanwhile, ongoing research and development activities for developing more effective treatment regimens are estimated to offer lucrative market opportunities over the forecast period.
Request Sample of the Report on Skin Rash Treatment Market Forecast 2031: https://www.coherentmarketinsights.com/insight/request-sample/6688
Market Dynamics
The skin rash treatment market is expected to witness significant growth over the forecast period. Rising incidences of various skin diseases such as eczema, psoriasis and dermatitis are expected to propel the demand for skin rash treatment products.
According to American Academy of Dermatology, over 50 million Americans suffer from eczema every year. Furthermore, new product launches by the key players are also anticipated to boost the market growth during the analysis period.
Skin Rash Treatment Market Report Coverage
| Report Coverage | Details |
| Market Revenue in 2024 | $3.67 billion |
| Estimated Value by 2031 | $5.70 billion |
| Growth Rate | Poised to grow at a CAGR of 6.5% |
| Historical Data | 2019–2023 |
| Forecast Period | 2024–2031 |
| Forecast Units | Value (USD Million/Billion) |
| Report Coverage | Revenue Forecast, Competitive Landscape, Growth Factors, and Trends |
| Segments Covered | By Source of Raw Material, By Type, By End-use Industry |
| Geographies Covered | North America, Europe, Asia Pacific, and Rest of World |
| Growth Drivers | • Growing environmental awareness • Increasing concern about plastic waste and pollution |
| Restraints & Challenges | • High production costs • Limited availability of raw materials |
Market Trends
Increasing adoption of natural and herbal products for skin rash treatment is projected to create lucrative opportunities for market players during the forecast period. For instance, Dead Sea products or aloe vera creams are widely used for skin rash treatment.
Rising consumer awareness regarding the side effects of synthetic products is further expected to fuel the demand for organic and natural skin rash treatment products.
Moreover, surge in online purchase of skin rash treatment products owing to easy availability and convenience is also estimated to support the market growth over the coming years.
Immediate Delivery Available | Buy This Premium Research Report: https://www.coherentmarketinsights.com/insight/buy-now/6688
Market Segmentations
Corticosteroids Treatment: Corticosteroids are expected to hold the largest share of the skin rash treatment market during the forecast period. Corticosteroids work by reducing inflammation and itching caused by skin conditions like eczema, psoriasis, and hives.
Immunosuppressants Treatment: Immunosuppressants are projected to witness the highest growth in the skin rash treatment market. Conditions like eczema that cause chronic inflammation can sometimes become resistant to conventional corticosteroid treatment.
Key Market Takeaways
The global skin rash treatment market size is anticipated to witness a CAGR of 6.5% during the forecast period 2024-2031. Due to the high and growing prevalence of skin rashes across all age groups.
On the basis of treatment type, the corticosteroids segment is expected to hold a dominant position, owing to their widespread adoption as first-line therapy due to effectiveness and easy availability.
Based on skin rash type, the contact dermatitis segment is anticipated to lead the market, as it is one of the most common types of skin rashes caused by various allergens and irritants.
By distribution channel, hospital pharmacies are projected to dominate the market since patients often require prescription medications which are conveniently available at these medical facilities.
Regionally, North America is expected to hold the largest share over the forecast period, due to the rising awareness about skin diseases, developed healthcare infrastructure, and presence of major players.
Competitor Insights
Key players in the skin rash treatment market include:
- Amgen
- Sun Pharmaceutical Industries
- Teva Pharmaceuticals Industries
- Eli Lilly and Company
- Mylan N.V
- Johnson & Johnson
- Leo Pharma
- Novartis AG
- AbbVie
- Merck & Co.
Skin Rash Treatment Industry News
In April 2024, Dermavant Announces U.S. FDA Acceptance of Supplemental New Drug Application (sNDA) for VTAMA (tapinarof) Cream, 1% for the Treatment of Atopic Dermatitis in Adults and Children 2 years and older.
In January 2024, Pfizer and Glenmark launched a new atopic dermatitis drug, abrocitinib, which has received marketing authorization from the Central Drugs Standard Control Organization in India and approval from the US Food and Drug Administration (FDA), European Medicines Agency (EMA), and other regulatory agencies.
Request For Customization: https://www.coherentmarketinsights.com/insight/request-customization/6688
Detailed Segmentation:
By Treatment Type:
- Corticosteroids
- Immunosuppressants
- Antihistamines
- Antifungals
- Others
By Skin Rash Type:
- Contact Dermatitis
- Atopic Dermatitis
- Psoriasis
- Seborrheic Dermatitis
- Others
By Distribution Channel:
- Pharmacies
- Retail Stores
- Others (Hypermarkets, etc.)
By Region:
- North America
- Latin America
- Brazil
- Argentina
- Mexico
- Rest of Latin America
- Europe
- Germany
- U.K.
- Spain
- France
- Italy
- Russia
- Rest of Europe
- Asia Pacific
- China
- India
- Japan
- Australia
- South Korea
- ASEAN
- Rest of Asia Pacific
- Middle East
- GCC Countries
- Israel
- Rest of Middle East
- Africa
- South Africa
- North Africa
- Central Africa
Have a Look at Trending Research Reports on Pharmaceutical Domain:
Global Barth Syndrome Treatment Market is estimated to be valued at USD 141.10 billion in 2024 and is expected to reach USD 336.11 billion by 2031, exhibiting a compound annual growth rate (CAGR) of 13.2% from 2024 to 2031.
Global over the counter pain medication market is estimated to be valued at USD 27.12 Bn in 2024 and is expected to reach USD 35.50 Bn by 2031, exhibiting a compound annual growth rate (CAGR) of 3.9% from 2024 to 2031.
Global online therapy services market is estimated to be valued at USD 9.68 Bn in 2024 and is expected to reach USD 24.80 Bn by 2031, exhibiting a compound annual growth rate (CAGR) of 14.4% from 2024 to 2031.
Global joint pain injections market is estimated to be valued at USD 5.29 Bn in 2024 and is expected to reach USD 9.46 Bn by 2031, exhibiting a compound annual growth rate (CAGR) of 8.7% from 2024 to 2031.
About Us:
Coherent Market Insights is a global market intelligence and consulting organization that provides syndicated research reports, customized research reports, and consulting services. We are known for our actionable insights and authentic reports in various domains including aerospace and defense, agriculture, food and beverages, automotive, chemicals and materials, and virtually all domains and an exhaustive list of sub-domains under the sun. We create value for clients through our highly reliable and accurate reports. We are also committed in playing a leading role in offering insights in various sectors post-COVID-19 and continue to deliver measurable, sustainable results for our clients.

Mr. Shah
Senior Client Partner – Business Development
Coherent Market Insights

Phone:
US: +1-650-918-5898
UK: +44-020-8133-4027
AUS: +61-2-4786-0457
India: +91-848-285-0837
Email: sales@coherentmarketinsights.com
Website: https://www.coherentmarketinsights.com
© 2024 Benzinga.com. Benzinga does not provide investment advice. All rights reserved.
Dollar Domination: JPMorgan Strategist On How The Greenback Shapes Fate Of Franc, Yuan, Rupee
In a world where the U.S. dollar reigns supreme, its strength isn’t just a statistic; it’s a game-changer for investors eyeing currencies like the Canadian dollar, Mexican peso, Chinese yuan, Swiss franc, Brazilian real, and Indian rupee.
JPMorgan’s Chief Strategist
David Kelly, Chief Global Strategist at JPMorgan Asset Management, highlights that the dollar’s robust position is fueled by strong economic fundamentals, and with rising interest rates, it’s become a magnet for global capital flows.
Kelly emphasizes that the dynamics of global trade are intricately linked to currency values, with the dollar serving as a critical barometer. As trade relationships shift and countries grapple with inflationary pressures, currencies like the Canadian dollar and Mexican peso are under heightened scrutiny.
Kelly believes that the dollar’s strength will continue to exert pressure on trade balances, influencing monetary policies and potentially widening the gap between economies.
This backdrop sets the stage for investors to not only assess the health of individual currencies but also to navigate the complex interplay between trade, currency fluctuations, and investment opportunities.
Read Also: China Rallies To 2-Year High, Europe Slips – Global Markets Today While US Slept
Canada, Mexico: A Tough Neighborhood
Kelly notes that a robust U.S. dollar can often spell trouble for countries reliant on exports. Take Canada and Mexico, for instance—when the dollar flexes its muscles, their currencies struggle to compete.
For U.S. investors, this creates opportunities to hedge with the Invesco CurrencyShares Canadian Dollar Trust FXC or tap into the Mexican peso’s volatility through emerging market-focused ETFs.
The Yuan: A Game Of Tug-of-War
But it’s not just North America feeling the pinch. The value of the Chinese yuan is under constant scrutiny, especially with China’s economic policy shifts.
For those looking to diversify, the WisdomTree Emerging Currency Strategy Fund CEW is a savvy way to gain exposure to the yuan while balancing risks associated with other emerging currencies.
Switzerland: The Safe Haven Strategy
The Swiss franc, often dubbed a safe haven, thrives during market turbulence, making it an attractive option for risk-averse investors, according to Kelly.
With the Invesco CurrencyShares Swiss Franc Trust FXF, investors can profit from the franc’s resilience.
Brazil, India: Emerging Markets Under Pressure
Meanwhile, the Brazilian real and Indian rupee may feel the heat from a strong dollar, impacting their trade balances.
Investors can navigate these waters with the iShares Currency Hedged MSCI Emerging Markets ETF HEEM, providing a cushion against currency fluctuations.
Dollar Bulls & Bears: Play Your Hand
For those betting on a stronger dollar, the Invesco DB US Dollar Index Bullish Fund UUP and the WisdomTree Bloomberg U.S. Dollar Bullish Fund USDU are solid choices.
Conversely, if you expect a dip, consider the Invesco DB US Dollar Index Bearish Fund UDN.
The Currency Chessboard
As Kelly reminds us, the currency landscape is complex but ripe with opportunity. Smart investors will keep a keen eye on these trends to make informed decisions in an ever-evolving market. So, whether you’re rooting for the dollar or watching its rivals, the game is on!
Read Next:
Image: Shutterstock
Market News and Data brought to you by Benzinga APIs
© 2024 Benzinga.com. Benzinga does not provide investment advice. All rights reserved.
Chief Executive Officer Of Clorox Purchased $5.27M In Stock
Linda Rendle, Chief Executive Officer at Clorox CLX, disclosed an insider purchase on October 8, based on a new SEC filing.
What Happened: In a significant move reported in a Form 4 filing with the U.S. Securities and Exchange Commission on Tuesday, Rendle purchased 32,639 shares of Clorox, demonstrating confidence in the company’s growth potential. The total value of the transaction stands at $5,273,483.
Tracking the Wednesday’s morning session, Clorox shares are trading at $158.89, showing a down of 0.56%.
About Clorox
Since its inception more than 100 years ago, Clorox has grown to play in a variety of categories across the consumer products space, including cleaning supplies, laundry care, trash bags, cat litter, charcoal, food dressings, water-filtration products, and natural personal-care products. Beyond its namesake brand, the firm’s portfolio includes Liquid-Plumr, Pine-Sol, S.O.S, Tilex, Kingsford, Fresh Step, Glad, Hidden Valley, KC Masterpiece, Brita, and Burt’s Bees. Just less than 85% of Clorox’s sales stem from its home turf.
Financial Insights: Clorox
Negative Revenue Trend: Examining Clorox’s financials over 3 months reveals challenges. As of 30 June, 2024, the company experienced a decline of approximately -5.75% in revenue growth, reflecting a decrease in top-line earnings. As compared to competitors, the company encountered difficulties, with a growth rate lower than the average among peers in the Consumer Staples sector.
Interpreting Earnings Metrics:
-
Gross Margin: The company sets a benchmark with a high gross margin of 46.45%, reflecting superior cost management and profitability compared to its peers.
-
Earnings per Share (EPS): Clorox’s EPS is a standout, portraying a positive bottom-line trend that exceeds the industry average with a current EPS of 1.74.
Debt Management: Clorox’s debt-to-equity ratio is below the industry average at 8.85, reflecting a lower dependency on debt financing and a more conservative financial approach.
Insights into Valuation Metrics:
-
Price to Earnings (P/E) Ratio: Clorox’s current Price to Earnings (P/E) ratio of 71.02 is higher than the industry average, indicating that the stock may be overvalued according to market sentiment.
-
Price to Sales (P/S) Ratio: The current P/S ratio of 2.81 is above industry norms, reflecting an elevated valuation for Clorox’s stock and potential overvaluation based on sales performance.
-
EV/EBITDA Analysis (Enterprise Value to its Earnings Before Interest, Taxes, Depreciation & Amortization): Clorox’s EV/EBITDA ratio of 31.07 exceeds industry averages, indicating a premium valuation in the market
Market Capitalization Analysis: Below industry benchmarks, the company’s market capitalization reflects a smaller scale relative to peers. This could be attributed to factors such as growth expectations or operational capacity.
Now trade stocks online commission free with Charles Schwab, a trusted and complete investment firm.
Why Insider Activity Matters in Finance
Insider transactions shouldn’t be used primarily to make an investing decision, however, they can be an important factor for an investor to consider.
Considering the legal perspective, an “insider” is defined as any officer, director, or beneficial owner holding more than ten percent of a company’s equity securities, according to Section 12 of the Securities Exchange Act of 1934. This includes executives in the c-suite and major hedge funds. These insiders are mandated to disclose their transactions through a Form 4 filing, to be submitted within two business days of the transaction.
Pointing towards optimism, a company insider’s new purchase signals their positive anticipation for the stock to rise.
Nevertheless, insider sells may not necessarily indicate a bearish view and can be influenced by various factors.
Essential Transaction Codes Unveiled
When dissecting transactions, the focal point for investors is often those occurring in the open market, meticulously detailed in Table I of the Form 4 filing. A P in Box 3 denotes a purchase, while S signifies a sale. Transaction code C indicates the conversion of an option, and transaction code A denotes a grant, award, or other acquisition of securities from the company.
Check Out The Full List Of Clorox’s Insider Trades.
Insider Buying Alert: Profit from C-Suite Moves
Benzinga Edge reveals every insider trade in real-time. Don’t miss the next big stock move driven by insider confidence. Unlock this ultimate sentiment indicator now. Click here for access.
This article was generated by Benzinga’s automated content engine and reviewed by an editor.
© 2024 Benzinga.com. Benzinga does not provide investment advice. All rights reserved.
General Motors' Silverado EV Work Truck Model Now Starts at $57K
General Motors Company‘s GM automobile division, Chevy, revealed that the 2025 Silverado EV will feature lower prices, increased driving range and new trim options. The starting price for the all-electric truck is $57,095 for the Work Truck (WT) model, with the LT trim being introduced for the first time.
The Max Range version of WT will offer 492 miles of EPA range for $77,795. GM’s rival, Ford, also offers the F-150 Lightning Pro, a simpler version of its F-150 Lightning electric truck, starting at $54,995 with a 240-mile range.
Per Scott Bell, vice president of Chevrolet, while the 2024 model was already a leader in range, the 2025 model sets a higher standard with the WT edition. With an EPA range of 492 miles, the 2025 Silverado EV WT has made a significant improvement from the 2024 model’s 450-mile range.
Chevy is trying to address cost concerns associated with EVs. The 2025 Silverado EV will be available in three trims: WT, LT and RST. Per Bell, the LT trim will offer a more affordable RST package and expand WT offerings. The 2025 LT trim starts at $75,195 with a range of 408 miles, while a premium trim, priced at $81,995, will offer 390 miles of range. It is expected to be the most commonly available model with a 645 horsepower engine, a towing capacity of 12,500 pounds, a payload of 1,800 pounds and fast-charging capability up to 300kW DC. Both versions are eligible for the federal EV tax credit.
Compared to the 2024 model, which only had the RST trim priced at nearly $100,000, Chevy has expanded the lineup for 2025 with more options. A lower-cost RST will start at $89,395 with a 390-mile range. SuperCruise, Chevy’s driver assistance feature, will be available in the premium package. Most 2025 Silverados will be delivered later this year, but the lowest-priced model will arrive later in the model year.
GM’s Zacks Rank & Key Picks
General Motors currently carries a Zacks Rank #4 (Sell).
Some better-ranked stocks in the auto space are Modine Manufacturing Company MOD, CarGurus, Inc. CARG and Suzuki Motor Corporation SZKMY, each sporting a Zacks Rank #1 (Strong Buy) at present.
The Zacks Consensus Estimate for MOD’s fiscal 2025 sales and earnings suggests year-over-year growth of 8.44% and 18.77%, respectively. Earnings per share estimates for fiscal 2025 and 2026 have improved by a penny and 8 cents, respectively, in the past 30 days.
The Zacks Consensus Estimate for CARG’s 2024 earnings suggests year-over-year growth of 31.71%. EPS estimates for 2024 and 2025 have improved by 14 cents and 11 cents, respectively, in the past 60 days.
The Zacks Consensus Estimate for SZKMY’s fiscal 2025 sales and earnings suggests year-over-year growth of 7.36% and 22.51%, respectively. EPS estimates for fiscal 2025 and 2026 have improved by 78 cents and 99 cents, respectively, in the past 60 days.
Market News and Data brought to you by Benzinga APIs
© 2024 Benzinga.com. Benzinga does not provide investment advice. All rights reserved.
This Is the Entry Into PepsiCo You've Been Waiting For
Investors looking to enter PepsiCo PEP stock or build on existing positions should rejoice. The FQ3 2024 earnings report was weaker than expected, causing the stock price to dip. While weaker-than-expected results and a soft outlook for revenue aren’t news to be happy about, the tally isn’t as bad as headlines make it seem, and there is the long-term outlook to consider.
PepsiCo is the world’s largest consumer staples company, impacted by internal and external one-offs that will soon pass. Until then, it is a solid, reliable dividend payer of Dividend King quality and will weather the current downturn in activity as it has done in the past, which is very well.
The critical details for investors to focus on today are the valuation and dividend yield. The stock, down from highs set in 2023, trades at roughly 20.5x its earnings outlook at the low end of the historical range. Likewise, the dividend distribution, which is expected to continue growing, yields about 3.25%, with shares near critical support levels and at the high end of the historical range. Investors that buy in at the current levels have limited risk and potential for a 50% share price increase at the high-end valuation range. There can be no better time to enter a blue chip stock such as this regarding long-term investing, portfolio maximization, total returns, and dollar-cost averaging.
PepsiCo’s Soft Q3 Is No Concern for Long-Term Investors
PepsiCo had a softer-than-expected Q3, but each negative was offset by a positive, leaving shareholder value improved and the long-term outlook unchanged. The $23.32 billion in net revenue is down -0.6% compared to last year and missed the consensus by 200 bps, but organic growth is present, and the margin is good. Organically, core operations are up 1.3%.
Segmentally, Quaker North America was the weakest, with a contraction of 13%. However, the weakness is primarily due to the recalls in Q1 and the subsequent shuttering of a plant believed to be the source of contamination. Weakness was also seen in Frito Lay North America, but the 1% contraction is less of a concern and offset by organic growth in PepsiCo North America, Latin America, and Europe. Asia-Pacific (APAC) is the weakest regionally, with a contraction of -1%, impacted by rising geopolitical tensions.
PepsiCo experienced margin contraction in Q3, but aggressive cost controls and increased efficiencies produced a better-than-expected result. The takeaway is that adjusted earnings grew compared to last year and outpaced the consensus target and organic revenue growth. Because cost controls and investment in operational efficiencies are part of the equation, investors can expect a leverage rebound in earnings when top-line growth resumes, likely to be sometime in F2025.
Guidance is also mixed, with the revenue target reduced but organic EPS growth targets reaffirmed. The salient detail is that operational improvements are expected to stick, providing sufficient cash flow to sustain the fortress balance sheet while returning capital to investors and investing in the business. Regarding the balance sheet, the company produced positive cash flow operationally but negative cash flow for the business. However, that detail is offset by the timing of debt issuance and repayment, increased assets, decreased liability, and a 5% improvement in shareholder equity.
PepsiCo Capital Returns Help Support the Price Action over Time
PepsiCo’s capital return is reliably safe and growing. The company’s dividend distribution is up 7% per share compared to 2023, aided by repurchases. The repurchase activity is up incrementally compared to last year, and the count was reduced by 0.35% for the quarter and YTD periods. Investors may expect to see distribution increases slow in 2025 but not cease; share repurchases are also likely to continue at the current pace.
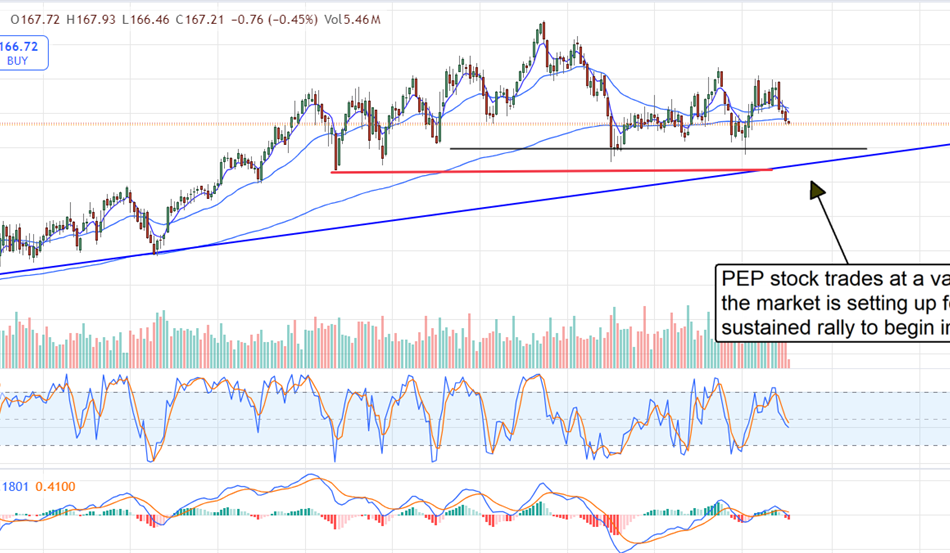
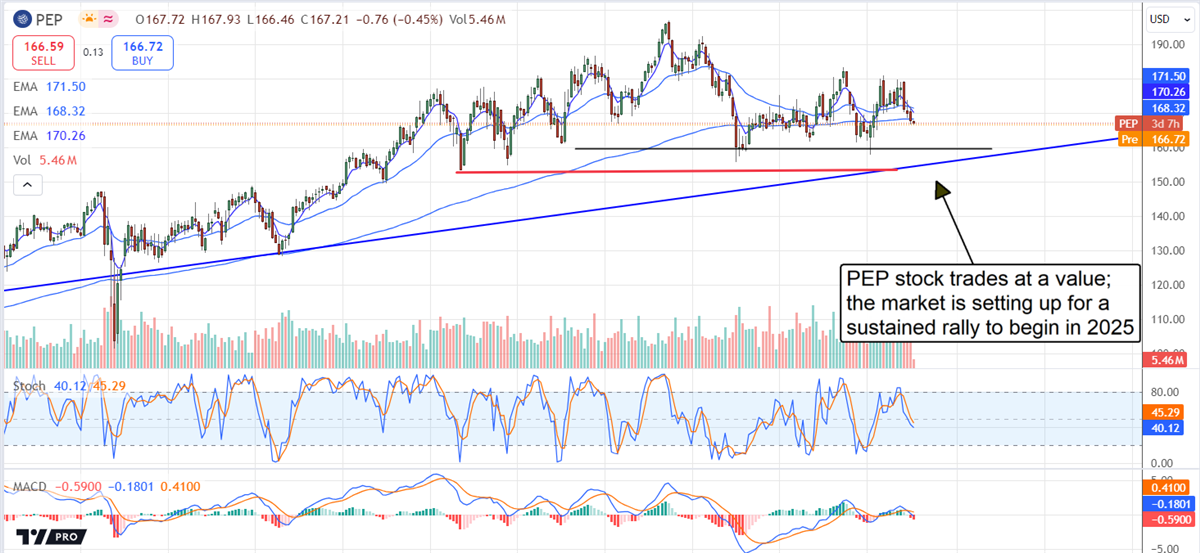
The price action in PepsiCo stock was tepid following the release, leaving the stock price down in early trading. However, the market is trading near a floor at $160, where support has been strong and is likely to produce a rebound. The $160 floor coincides with a significant uptrend line in 2024, so the rebound could be strong and result in a sustained uptrend in 2024.
Among the catalysts for 2025 are a return to top-line growth, leveraged results on the bottom line, and the possibility that growth will exceed the current forecasts because of the addition of Siete Foods. Siete Foods is a Mexican-American food brand growing above the industry’s 4% CAGR, providing inroads into a new product vertical worth billions in annual revenue while complementing PepsiCo’s better-for-you food offerings.
The article “This Is the Entry Into PepsiCo You’ve Been Waiting For” first appeared on MarketBeat.
Market News and Data brought to you by Benzinga APIs
© 2024 Benzinga.com. Benzinga does not provide investment advice. All rights reserved.
Flow Meters Market Size to Worth USD 13.77 Billion by 2033 | Straits Research
New York, United States, Oct. 09, 2024 (GLOBE NEWSWIRE) — Due to their innumerable features, flow meters are expeditiously being used in coal-fired, fuel oil and natural gas, geothermal, hydroelectric, and nuclear power plants. The use of flow meters has increased as laws regulating the control of toxic gas emissions from power plants have become more stringent.
Flow meters are in high demand for monitoring and measuring the flow of steam, gas, water, chemicals, and mineral oil, among other things. These meters deliver much accuracy in terms of optimal and cost-effective quantity during flow measurement. In terms of processing control, they are advantageous.
Download Free Sample Report PDF @ https://straitsresearch.com/report/flow-meters-market/request-sample
Market Dynamics
Rise in Applications in Oil & Gas Industry to Drive the Global Market
The oil and gas category includes offshore and onshore oil and gas exploration, production, and refining facilities, refineries, pipelines, petrochemical units, gas pipelines, and storage terminals. In both the upstream and downstream sections of the oil and gas industry, preventive coatings are utilized to transport oil and gas to refineries. This industry uses anti-corrosion, heat-resistant, abrasion-resistant, fire-resistant, and other types of protective coatings.
The industry has been looking for ways to cut costs. This, combined with the need to adhere to strict environmental regulations, has led to a willingness for a long-lasting barrier layer that effectively preserves assets.
Moreover, major contributors to the oil and gas industry’s growth include the United States, Saudi Arabia, Russia, China, and Canada, among others.
Technological Advancements to Generate New Opportunities for the Global Market
In terms of digital transformation, the sensors in the equipment have also seen rapid advancements. Several major market players are investing heavily in research and development. These operations are also anticipated to assist them in developing products that meet the needs of various industrial facilities and end-use applications.
Significant developments in flow meter technology include digital signals for flow meters, multiple measurement formats, online diagnosis and troubleshooting, remote calibration and configuration, and smart sensors with online warnings.
Because of scientific advances made possible by solid r and d, the industry has also been capable of creating adequate solutions to complex operating problems. One of the issues that the flow meter operations have to interact with on a regular basis is cleanliness. The emergence of automated cleaning is one of the market’s breakthrough trends. This trend is especially advantageous to market segments such as water and wastewater management.
Furthermore, the advent of computer processing has had a positive impact on the way these flow meters function. The access to low-cost memory chips that can sequence data at high speeds and handle large amounts of data could be beneficial in a market like this. With the increased use of software programs, precise measurements and the factors controlling a wider range of gases and liquids are expected.
Regional Insights
Over the forecast period, the North American flow meters market is projected to expand significantly. The United States is the region’s major contributor to growth. As for the advanced oil and gas, chemicals, and power generation industries, the North American region is expected to maintain a huge market share. The renewable energy generation sector in North America is anticipated to continue investing heavily in new projects. The hydropower sector is expected to grow from 101 GW to around 150 GW by 2050, pertaining to the US Department of Energy (DOE).
Asia-Pacific is the fastest-growing flow meters market. The Asia-Pacific flow meters market is predicted to be worth USD 27,793 million by 2030, increasing at a 4% CAGR. Most Asian vendors use cost-cutting as a competitive advantage, which means they frequently sacrifice high quality. The region’s prominence in global sensor production benefits them in the market under investigation.
Panasonic introduced its new Ultrasonic Gas Flow Sensor in January 2020, adding emerging innovations to its vast specialty sensor product portfolio. This new sensor is a tiny, dual-function ultrasonic gas flow sensor that can quantify gas flow and density at flow rates varying from 1 to 25 liters per minute. It was previously only available as a Panasonic direct technology product.
To Gather Additional Insights on the Regional Analysis of the Flow Meters Market @ https://straitsresearch.com/report/flow-meters-market/request-sample
Competitive Players
- Yokogawa Electric Corporation
- ABB Ltd, Siemens AG
- Bronkhorst High-Tech BV
- Honeywell International Inc.
- SICK AG
- Omega Engineering Inc. (Spectris PLC)
- Christian Bürkert GmbH & Co. KG
- TSI Incorporated
- Keyence Corporation
- Emerson Electric Co.
- Sensirion AG
- Azbil Corporation
- Endress+Hauser AG
- KROHNE Messtechnik Gm
Segmentation
- By Technology
- Coriolis
- Electromagnetic
- Differential Pressure
- Ultrasonic
- Positive displacement
- Turbine
- Magnetic (In-Line, Insertion, Low flow)
- Vortex
- Others
- By End-User
- Water & wastewater
- Refining & petrochemical
- Oil & gas
- Chemical
- Power generation
- Pulp & Paper
- Food & Beverage
- Pharmaceutical
- Metals & Mining
- Others
- By Application
- Water & Wastewater
- Oil & Gas
- Chemicals
- Power Generation
- Pulp & Paper
- Food & Beverage
- Others
- By Type
- Electric
- Solar
- Battery Powered
- By Size
- 2 inches
- 4 inches
- 6 inches
- More than 6 inches
- By Region
- North America
- Europe
- APAC
- LATAM
- MEA
Get Detailed Market Segmentation @ https://straitsresearch.com/report/flow-meters-market/segmentation
About Straits Research Pvt. Ltd.
Straits Research is a market intelligence company providing global business information reports and services. Our exclusive blend of quantitative forecasting and trends analysis provides forward-looking insight for thousands of decision-makers. Straits Research Pvt. Ltd. provides actionable market research data, especially designed and presented for decision making and ROI.
Whether you are looking at business sectors in the next town or crosswise over continents, we understand the significance of being acquainted with the client’s purchase. We overcome our clients’ issues by recognizing and deciphering the target group and generating leads with utmost precision. We seek to collaborate with our clients to deliver a broad spectrum of results through a blend of market and business research approaches.
For more information on your target market, please contact us below:
Phone: +1 646 905 0080 (U.S.)
+91 8087085354 (India)
+44 203 695 0070 (U.K.)
Email: sales@straitsresearch.com
Follow Us: LinkedIn | Facebook | Instagram | Twitter

© 2024 Benzinga.com. Benzinga does not provide investment advice. All rights reserved.
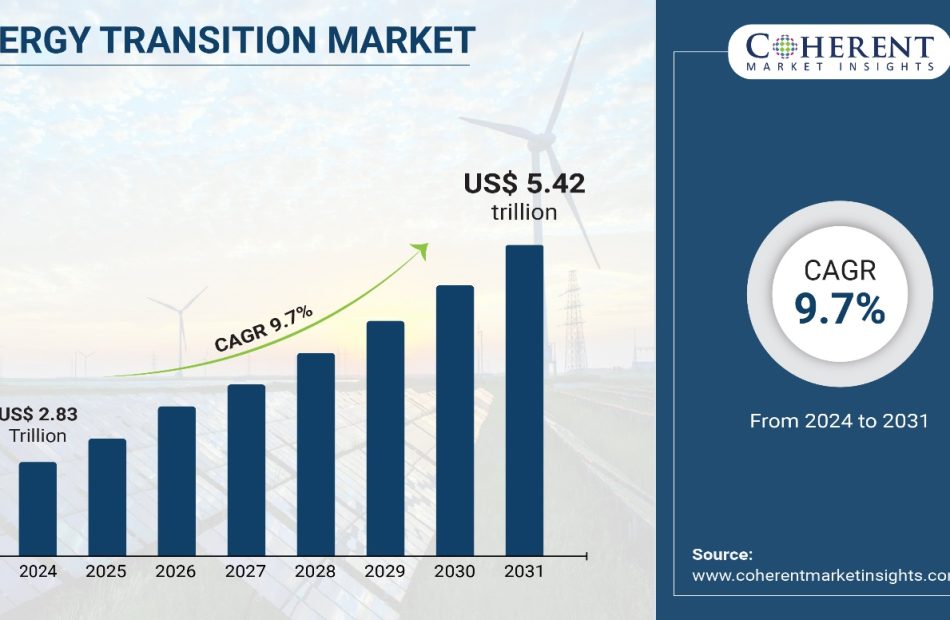
Energy Transition Market to reach $5.42 Trillion by 2031, growing at a CAGR of 9.7%, says Coherent Market Insights
Burlingame, Oct. 09, 2024 (GLOBE NEWSWIRE) — The global energy transition market Size to Grow from USD 2.83 trillion in 2024 to USD 5.42 trillion by 2031, at a Compound Annual Growth Rate (CAGR) of 14.4% during the forecast period, as highlighted in a new report published by Coherent Market Insights. Growing policy support and target setting is translating to huge capital expenditure towards large-scale renewable energy projects. Renewable energy installations have been growing at a healthy double-digit rate over the past few years.
Request Sample of the Report on Energy Transition Market Forecast 2031: https://www.coherentmarketinsights.com/insight/request-sample/7433

Market Dynamics
The rising investments in renewable energy and favorable government policies supporting renewable energy adoption. These are the major factors responsible for the projected high growth of the energy transition market. Various governments worldwide are implementing supportive policies and offering attractive subsidies to promote renewable energy adoption.
Market Trends
With the constant decline in the costs of renewable energy technologies, the energy mix is widening rapidly to include various renewable sources other than just solar and wind. Geothermal, hydro, biomass and hydrokinetic energy sources are gaining traction in both developed and developing economies.
Energy Transition Market Report Coverage
| Report Coverage | Details |
| Market Revenue in 2024 | $2.83 trillion |
| Estimated Value by 2031 | $5.42 trillion |
| Growth Rate | Poised to grow at a CAGR of 9.7% |
| Historical Data | 2019–2023 |
| Forecast Period | 2024–2031 |
| Forecast Units | Value (USD Million/Billion) |
| Report Coverage | Revenue Forecast, Competitive Landscape, Growth Factors, and Trends |
| Segments Covered | By Energy Source, By Technology, By Application |
| Geographies Covered | North America, Europe, Asia Pacific, and Rest of World |
| Growth Drivers | • Increasing government policies and incentives for renewable energy adoption • Growing consumer demand for sustainable and clean energy solutions |
| Restraints & Challenges | • High initial costs associated with renewable energy infrastructure • Regulatory and policy uncertainties affecting investment decisions |
The deployment of advanced energy storage technologies such as lithium-ion batteries, and pumped hydro storage is growing significantly. This plays a crucial role in improving the grid reliability through load balancing and provides backup during power outages caused by intermittent renewable sources. The increasing collaboration between pure-play energy storage and solar plus storage developers is also a prominent trend.
Immediate Delivery Available | Buy This Premium Research Report: https://www.coherentmarketinsights.com/insight/buy-now/7433
Market Opportunities
The renewable energy segment is expected to offer a major opportunity in the energy transition market. It is growing at a CAGR of over 12% during the forecast period. Renewable sources like solar and wind are becoming more cost competitive compared to traditional fossil fuels and their deployment. It is being strongly encouraged through policies and incentives around the world. Investments in renewable energy infrastructure are increasing globally.
The energy storage technology segment is poised to witness significant growth in the coming years. With increasing proportions of intermittent renewable sources like solar and wind being added to the grid, energy storage technologies play a vital role in solving the issue of fluctuating power supplies. Battery energy storage systems, in particular, are anticipated to experience exponential uptake, growing at over 20% annually through 2031.
Key Market Takeaways
The global energy transition market to witness a CAGR of 9.7% during the 2024-2031. Due to the strong policy push for decarbonization of energy systems around the world.
On the basis of energy source, the renewable energy segment would hold a dominant position, accounting for over 35% of the market by 2031. Due to declining costs and better environmental credentials of solar, wind, and other renewables.
By technology, energy storage systems, especially batteries, are expected to grow at over 20% CAGR through 2031. Due to increased need for reliable power supply complementing rising renewable energy addition.
Based on application, the residential sector will dominate. Due to individual prosumers increasingly adopting rooftop solar PV and battery storage solutions.
Regionally, North America is expected to hold a dominant position over the forecast period, with over 30% market share in 2031. This can be attributed to supportive policies promoting clean energy adoption in the US and Canada.
Key players operating in the market include Duke Energy Corporation, Southern Company, and ENEL. These companies are investing heavily in renewable assets, modernizing infrastructure, and energy storage to transition away from fossil fuels. Partnerships and M&A activity in the sector are also on the rise globally.
Energy Transition Industry News
In January 2022, India has announced it aims to reach net zero emissions by 2070 and to meet 50 per cent of its electricity requirements from renewable energy sources by 2030.
Request For Customization: https://www.coherentmarketinsights.com/insight/request-customization/7433
Detailed Segmentation-
Energy Source Insights (Revenue, US$ Tn, 2019 – 2031)
- Renewable Energy
- Non-Renewable Energy
Technology Insights (Revenue, US$ Tn, 2019 – 2031)
- Energy Storage Systems (Batteries, Pumped Hydro)
- Electric Vehicles (EVs)
- Smart Grids
- Carbon Capture and Storage (CCS)
Application Insights (Revenue, US$ Tn, 2019 – 2031)
- Power Generation
- Transportation
- Industrial
- Residential
- Commercial
Regional Insights (Revenue, US$ Tn, 2019 – 2031)
- North America
- Latin America
- Brazil
- Argentina
- Mexico
- Rest of Latin America
- Europe
- Germany
- U.K.
- Spain
- France
- Italy
- Russia
- Rest of Europe
- Asia Pacific
- China
- India
- Japan
- Australia
- South Korea
- ASEAN
- Rest of Asia Pacific
- Middle East
- GCC Countries
- Israel
- Rest of Middle East
- Africa
- South Africa
- North Africa
- Central Africa
Have a Look at Trending Research Reports on Energy Domain:
Global offshore wind energy market size is expected to reach US$ 70.38 Bn by 2031, from US$ 33.98 Bn in 2024, exhibiting a compound annual growth rate (CAGR) of 12.9% during the forecast period (2024-2031)
Global hydrogen energy storage market is estimated to be valued at USD 16.70 Bn in 2024 and is expected to reach USD 22.89 Bn by 2031, exhibiting a compound annual growth rate (CAGR) of 4.6% from 2024 to 2031.
Global energy storage as a service market is estimated to be valued at USD 1.81 Bn in 2024 and is expected to reach USD 3.71 Bn by 2031, exhibiting a compound annual growth rate (CAGR) of 10.8% from 2024 to 2031.
Global hybrid power system market is estimated to be valued at USD 704.2 Mn in 2024 and is expected to reach USD 1,072.9 Mn by 2031, exhibiting a compound annual growth rate (CAGR) of 6.2% from 2024 to 2031.
Global Solar PV Panels Market is estimated to be valued at USD 183.14 Bn in 2024 and is expected to reach USD 305.81 Bn by 2031, exhibiting a compound annual growth rate (CAGR) of 7.6% from 2024 to 2031.
About Us:
Coherent Market Insights is a global market intelligence and consulting organization that provides syndicated research reports, customized research reports, and consulting services. We are known for our actionable insights and authentic reports in various domains including aerospace and defense, agriculture, food and beverages, automotive, chemicals and materials, and virtually all domains and an exhaustive list of sub-domains under the sun. We create value for clients through our highly reliable and accurate reports. We are also committed in playing a leading role in offering insights in various sectors post-COVID-19 and continue to deliver measurable, sustainable results for our clients.

Mr. Shah
Senior Client Partner – Business Development
Coherent Market Insights

Phone:
US: +1-650-918-5898
UK: +44-020-8133-4027
AUS: +61-2-4786-0457
India: +91-848-285-0837
Email: sales@coherentmarketinsights.com
Website: https://www.coherentmarketinsights.com
© 2024 Benzinga.com. Benzinga does not provide investment advice. All rights reserved.

