Cannabis Chart Of The Week: Consensus 2024 EBITDA Estimates Are Still Up 8.4% Despite Downward Revisions
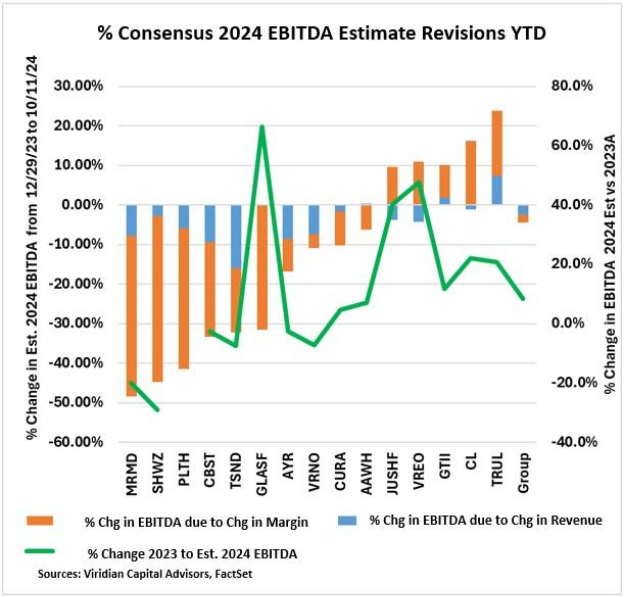
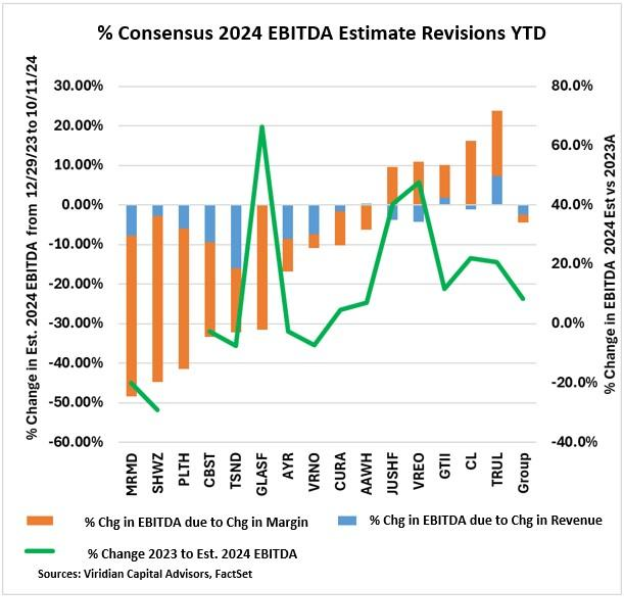
The chart shows the percentage change in consensus 2024 EBITDA estimates between the end of 2023 and now. The orange bars represent the portion of EBITDA % change attributable to changes in EBITDA Margins, while the blue bars depict the part attributable to changes in revenue estimates.

In aggregate, the group 2024 EBITDA estimates have been revised downward by 4.5% YTD, and 2.7% of that has occurred since the end of the second quarter. The range is quite wide, however, from a 48.3% downward revision for MariMed MRMD to an upward revision of 23.9% for Trulieve TCNNF.
We had expected 2024 revisions to be going in the other direction. At the beginning of the year, we believed that as we got closer to S3, stock prices would begin to move upward, allowing for some modest equity issuance, balance sheet repair, and the beginnings of a new round of expansion. Instead, we have seen virtually no rise in equity prices, little new capital coming into the cultivation and retail sector, and mostly debt refinancing. Tight capital has kept capex and M&A constrained.
Lower estimated EBITDA margins primarily drive all of the downward revisions. Rising costs, wholesale price compression, and continued capital scarcity have continued to have a negative impact.
The five companies on the right-hand side of the chart stand out for having significant upward revisions in estimated 2024 EBITDA margins. Interestingly, three of the five have had negative revenue revisions. They are shedding unprofitable business and focusing on margin improvement.
Despite the downward revisions, it is important to realize that current 2024 EBITDA estimates are still 8.4% above 2023 levels. Furthermore, we still believe S3 will lead to stock price increases and the re-equitization of balance sheets, which in turn will allow for additional growth. Will the December 2nd DEA hearing have an impact, or will investors wait until S3 is wholly accomplished? New rumblings regarding the SAFER Act are encouraging, but we are skeptical that anything will happen in an election year.
As always, cannabis investing requires patience. With huge catalysts in view, investors need to avoid credit traps and not be shaken by adverse short-term price action.
The Viridian Capital Chart of the Week highlights key investment, valuation and M&A trends taken from the Viridian Cannabis Deal Tracker.
The Viridian Cannabis Deal Tracker provides the market intelligence that cannabis companies, investors, and acquirers utilize to make informed decisions regarding capital allocation and M&A strategy. The Deal Tracker is a proprietary information service that monitors capital raise and M&A activity in the legal cannabis, CBD, and psychedelics industries. Each week the Tracker aggregates and analyzes all closed deals and segments each according to key metrics:
-
Deals by Industry Sector (To track the flow of capital and M&A Deals by one of 12 Sectors – from Cultivation to Brands to Software)
-
Deal Structure (Equity/Debt for Capital Raises, Cash/Stock/Earnout for M&A) Status of the company announcing the transaction (Public vs. Private)
-
Principals to the Transaction (Issuer/Investor/Lender/Acquirer) Key deal terms (Pricing and Valuation)
-
Key Deal Terms (Deal Size, Valuation, Pricing, Warrants, Cost of Capital)
-
Deals by Location of Issuer/Buyer/Seller (To Track the Flow of Capital and M&A Deals by State and Country)
-
Credit Ratings (Leverage and Liquidity Ratios)
Since its inception in 2015, the Viridian Cannabis Deal Tracker has tracked and analyzed more than 2,500 capital raises and 1,000 M&A transactions totaling over $50 billion in aggregate value.
The preceding article is from one of our external contributors. It does not represent the opinion of Benzinga and has not been edited.
Market News and Data brought to you by Benzinga APIs
© 2024 Benzinga.com. Benzinga does not provide investment advice. All rights reserved.


Leave a Reply