Omnicom Group Earnings Preview
Omnicom Group OMC is gearing up to announce its quarterly earnings on Tuesday, 2024-10-15. Here’s a quick overview of what investors should know before the release.
Analysts are estimating that Omnicom Group will report an earnings per share (EPS) of $2.02.
The market awaits Omnicom Group’s announcement, with hopes high for news of surpassing estimates and providing upbeat guidance for the next quarter.
It’s important for new investors to understand that guidance can be a significant driver of stock prices.
Historical Earnings Performance
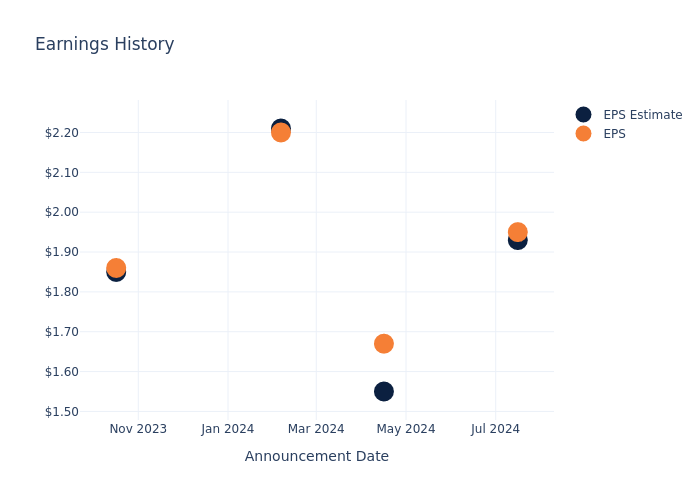
The company’s EPS beat by $0.02 in the last quarter, leading to a 4.02% drop in the share price on the following day.
Here’s a look at Omnicom Group’s past performance and the resulting price change:
| Quarter | Q2 2024 | Q1 2024 | Q4 2023 | Q3 2023 |
|---|---|---|---|---|
| EPS Estimate | 1.93 | 1.55 | 2.21 | 1.85 |
| EPS Actual | 1.95 | 1.67 | 2.20 | 1.86 |
| Price Change % | -4.0% | 2.0% | -3.0% | -2.0% |

Market Performance of Omnicom Group’s Stock
Shares of Omnicom Group were trading at $102.86 as of October 11. Over the last 52-week period, shares are up 34.05%. Given that these returns are generally positive, long-term shareholders are likely bullish going into this earnings release.
Analysts’ Take on Omnicom Group
Understanding market sentiments and expectations within the industry is crucial for investors. This analysis delves into the latest insights on Omnicom Group.
With 4 analyst ratings, Omnicom Group has a consensus rating of Outperform. The average one-year price target is $109.25, indicating a potential 6.21% upside.
Analyzing Ratings Among Peers
In this analysis, we delve into the analyst ratings and average 1-year price targets of and Interpublic Gr of Cos, three key industry players, offering insights into their relative performance expectations and market positioning.
- Interpublic Gr of Cos is maintaining an Neutral status according to analysts, with an average 1-year price target of $31.79, indicating a potential 69.09% downside.
Snapshot: Peer Analysis
Within the peer analysis summary, vital metrics for and Interpublic Gr of Cos are presented, shedding light on their respective standings within the industry and offering valuable insights into their market positions and comparative performance.
| Company | Consensus | Revenue Growth | Gross Profit | Return on Equity |
|---|---|---|---|---|
| Omnicom Group | Outperform | 6.76% | $681.70M | 9.11% |
| Interpublic Gr of Cos | Neutral | 1.63% | $411.10M | 5.60% |
Key Takeaway:
Omnicom Group outperforms its peers in revenue growth and gross profit. It also has a higher return on equity compared to its peers.
About Omnicom Group
Omnicom is a holding company that owns several advertising agencies and related firms. It provides traditional and digital advertising services that include creative design, market research, data analytics, and ad placement. In addition, Omnicom provides outsourced public relations and other communications services. The firm operates globally, providing services in more than 70 countries; it generates more than one half of its revenue in North America and nearly 30% in Europe.
Omnicom Group: Financial Performance Dissected
Market Capitalization: Positioned above industry average, the company’s market capitalization underscores its superiority in size, indicative of a strong market presence.
Revenue Growth: Omnicom Group displayed positive results in 3 months. As of 30 June, 2024, the company achieved a solid revenue growth rate of approximately 6.76%. This indicates a notable increase in the company’s top-line earnings. As compared to its peers, the revenue growth lags behind its industry peers. The company achieved a growth rate lower than the average among peers in Communication Services sector.
Net Margin: Omnicom Group’s net margin surpasses industry standards, highlighting the company’s exceptional financial performance. With an impressive 8.51% net margin, the company effectively manages costs and achieves strong profitability.
Return on Equity (ROE): Omnicom Group’s ROE surpasses industry standards, highlighting the company’s exceptional financial performance. With an impressive 9.11% ROE, the company effectively utilizes shareholder equity capital.
Return on Assets (ROA): The company’s ROA is a standout performer, exceeding industry averages. With an impressive ROA of 1.2%, the company showcases effective utilization of assets.
Debt Management: Omnicom Group’s debt-to-equity ratio stands notably higher than the industry average, reaching 1.94. This indicates a heavier reliance on borrowed funds, raising concerns about financial leverage.
To track all earnings releases for Omnicom Group visit their earnings calendar on our site.
This article was generated by Benzinga’s automated content engine and reviewed by an editor.
Market News and Data brought to you by Benzinga APIs
© 2024 Benzinga.com. Benzinga does not provide investment advice. All rights reserved.


Leave a Reply