A Preview Of State Street's Earnings
State Street STT is set to give its latest quarterly earnings report on Tuesday, 2024-10-15. Here’s what investors need to know before the announcement.
Analysts estimate that State Street will report an earnings per share (EPS) of $2.13.
The announcement from State Street is eagerly anticipated, with investors seeking news of surpassing estimates and favorable guidance for the next quarter.
It’s worth noting for new investors that guidance can be a key determinant of stock price movements.
Past Earnings Performance
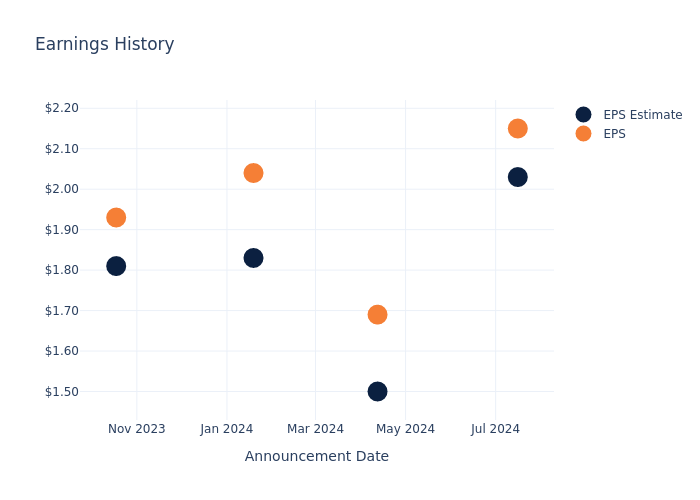
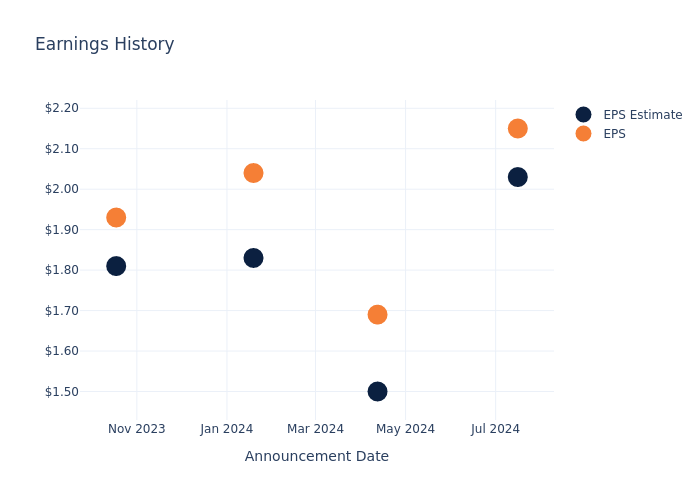
During the last quarter, the company reported an EPS beat by $0.12, leading to a 0.61% increase in the share price on the subsequent day.
Here’s a look at State Street’s past performance and the resulting price change:
| Quarter | Q2 2024 | Q1 2024 | Q4 2023 | Q3 2023 |
|---|---|---|---|---|
| EPS Estimate | 2.03 | 1.50 | 1.83 | 1.81 |
| EPS Actual | 2.15 | 1.69 | 2.04 | 1.93 |
| Price Change % | 1.0% | 3.0% | 2.0% | -3.0% |
State Street Share Price Analysis
Shares of State Street were trading at $89.83 as of October 11. Over the last 52-week period, shares are up 34.0%. Given that these returns are generally positive, long-term shareholders are likely bullish going into this earnings release.
Analysts’ Perspectives on State Street
For investors, staying informed about market sentiments and expectations in the industry is paramount. This analysis provides an exploration of the latest insights on State Street.
Analysts have given State Street a total of 13 ratings, with the consensus rating being Neutral. The average one-year price target is $92.77, indicating a potential 3.27% upside.
Understanding Analyst Ratings Among Peers
The analysis below examines the analyst ratings and average 1-year price targets of Ares Management, Blue Owl Cap and Franklin Resources, three significant industry players, providing valuable insights into their relative performance expectations and market positioning.
- The prevailing sentiment among analysts is an Neutral trajectory for Ares Management, with an average 1-year price target of $158.5, implying a potential 76.44% upside.
- Analysts currently favor an Outperform trajectory for Blue Owl Cap, with an average 1-year price target of $21.5, suggesting a potential 76.07% downside.
- For Franklin Resources, analysts project an Neutral trajectory, with an average 1-year price target of $21.66, indicating a potential 75.89% downside.
Comprehensive Peer Analysis Summary
Within the peer analysis summary, vital metrics for Ares Management, Blue Owl Cap and Franklin Resources are presented, shedding light on their respective standings within the industry and offering valuable insights into their market positions and comparative performance.
| Company | Consensus | Revenue Growth | Gross Profit | Return on Equity |
|---|---|---|---|---|
| T. Rowe Price Gr | Neutral | 7.65% | $911.50M | 4.77% |
| Ares Management | Neutral | -20.67% | $718.06M | 5.04% |
| Blue Owl Cap | Outperform | 31.88% | $322.75M | 2.00% |
| Franklin Resources | Neutral | 7.82% | $1.70B | 1.29% |
Key Takeaway:
State Street ranks in the middle for consensus rating among its peers. It ranks at the bottom for revenue growth. It ranks at the top for gross profit. It ranks in the middle for return on equity.
Get to Know State Street Better
State Street is a leading provider of financial services, including investment servicing, investment management, and investment research and trading. With approximately $42 trillion in assets under custody and administration and $4.1 trillion assets under management as of Dec. 31, 2023, State Street operates globally in more than 100 geographic markets and employs more than 46,000 worldwide.
State Street’s Economic Impact: An Analysis
Market Capitalization Analysis: Reflecting a smaller scale, the company’s market capitalization is positioned below industry averages. This could be attributed to factors such as growth expectations or operational capacity.
Revenue Growth: Over the 3 months period, State Street showcased positive performance, achieving a revenue growth rate of 2.6% as of 30 June, 2024. This reflects a substantial increase in the company’s top-line earnings. In comparison to its industry peers, the company trails behind with a growth rate lower than the average among peers in the Financials sector.
Net Margin: State Street’s net margin lags behind industry averages, suggesting challenges in maintaining strong profitability. With a net margin of 20.53%, the company may face hurdles in effective cost management.
Return on Equity (ROE): State Street’s ROE is below industry averages, indicating potential challenges in efficiently utilizing equity capital. With an ROE of 2.96%, the company may face hurdles in achieving optimal financial returns.
Return on Assets (ROA): State Street’s ROA lags behind industry averages, suggesting challenges in maximizing returns from its assets. With an ROA of 0.2%, the company may face hurdles in achieving optimal financial performance.
Debt Management: The company faces challenges in debt management with a debt-to-equity ratio higher than the industry average. With a ratio of 1.49, caution is advised due to increased financial risk.
To track all earnings releases for State Street visit their earnings calendar on our site.
This article was generated by Benzinga’s automated content engine and reviewed by an editor.
© 2024 Benzinga.com. Benzinga does not provide investment advice. All rights reserved.
I Want to Move $720k to a Roth IRA – Are There Ways to Cut Conversion Taxes?
SmartAsset and Yahoo Finance LLC may earn commission or revenue through links in the content below.
Taxes are a valid concern if you want to roll over $720,000 from your retirement fund into a Roth IRA. While you won’t pay any taxes if the assets you’re rolling over are held in another Roth account, there’s typically no way to completely avoid paying taxes when rolling pre-tax money into a Roth IRA. However, with a few strategic moves, you can potentially limit today’s tax pain while still reaping the rewards of tomorrow’s tax-free benefits. To determine if a Roth rollover aligns with your overall savings and tax strategy, consider running the numbers with a financial advisor who’s attuned to your financial situation and retirement vision.
Roth Rollover Rules
A Roth IRA is a retirement account that allows people to contribute after-tax dollars. Unlike a traditional IRA, you don’t get a tax break on Roth contributions. However, qualified Roth withdrawals in retirement can be made tax-free. This differs from traditional IRAs, whose contributions are often tax-deductible but withdrawals are taxed as ordinary income.
In general, you can roll over funds from another retirement account such as a traditional IRA or 401(k) into a Roth IRA. This is called a Roth conversion or Roth rollover. When you convert funds, you owe income taxes on the amount that’s rolled over for that year. So if you roll over $50,000 from a traditional IRA to a Roth IRA, the $50,000 is added to your taxable income for the year.
It’s important to understand that Roth rollovers are not the same as Roth contributions. Higher-income taxpayers may not qualify to make direct Roth contributions. However, there are no income limits on doing Roth conversions from other accounts.
You can roll over funds from 401(k)s, 403(b)s, 457 plans, traditional IRAs, SEP IRAs and Simple IRAs. To start the process, contact the institution that holds the account you want to roll over and convert. They can help facilitate the transfer. You typically have 60 days to complete the conversion, otherwise, the IRS will treat the transfer as a distribution and you could be hit with a 10% early withdrawal penalty. But if you need additional help determining how much to roll over and convert, consider speaking with a financial advisor.
Why Roth Rollovers Matter
There are a few key reasons why an individual might choose to do a Roth conversion:
-
Tax-free growth: Money that’s converted into a Roth IRA grows tax-free. This differs from traditional IRAs whose investment earnings are tax-deferred but eventually get taxed when they’re withdrawn. Roth withdrawals will be 100% tax-free, provided you satisfy the five-year rule and are 59.5 years old.
-
Avoid RMDs: Traditional IRAs are subject to required minimum distributions (RMDs) – mandatory withdrawals that start at age 73. For those who don’t need these distributions, RMDs can create excess taxable income. However, Roth conversions eliminate future RMDs since Roth accounts are not subject to these rules.
-
Tax savings: Paying conversion taxes now can make sense if you expect to be in a higher tax bracket in retirement. Roth conversions lock in today’s rates. They also reduce future RMD amounts that could push you into a higher bracket.
-
Inheritance planning: Heirs who inherit Roth IRAs can potentially stretch out tax-free distributions over their life expectancy, depending on their relation to the person who died. However, some beneficiaries will be required to empty the account within 10 years.
As you can see, there are some good reasons to convert an IRA or 401(k) into a Roth IRA, but a financial advisor can help you explore how such a transaction may impact your finances and tax liability.
Roth Rollover Strategies
When doing a Roth conversion, the main drawback is the tax obligation. There are some strategic moves to potentially reduce taxes, though:
-
Partial conversions: One method is to do partial Roth conversions over multiple years instead of converting your entire balance at once. The idea is to convert just enough each year to “fill up” your current bracket with income while also avoiding a higher bracket.
-
Low-tax years: In low-income years it may make sense to convert larger sums. This could be early in retirement before RMDs or Social Security begins. Again, the goal is to add just enough extra income to fill up your current tax bracket without pushing you into the next tax bracket.
-
Use non-retirement assets: Many experts suggest paying conversion taxes with non-retirement funds instead of IRA assets. This allows your entire IRA balance to transfer to the Roth account and keep growing tax-free.
If you need help determining which strategy is best for you, consider using this free matching tool to connect with a fiduciary financial advisor.
Rollover Strategies in Action
As an example, let’s consider a single filing taxpayer who wants to roll over $720,000 from an old 401(k) to a Roth IRA. Here are a few scenarios to think about:
Lump Sum Conversion
Converting the entire $720,000 would potentially generate a tax bill of nearly $220,000 at today’s top marginal rate of 37% (assuming you take the standard deduction of $14,600). That whole sum has to be paid for the year in which the conversion is completed.
Partial Conversions Spread Over 10 Years
Completing a series of conversions each year for 10 years controls tax bracket jumps and spreads the tax hit over a decade. A $72,000 annual conversion would put you in the 22% bracket if you have little or no additional income. That translates to a tax bill of approximately $7,700 per year or $77,000 over 10 years – less than half of what you’d pay on a lump sum conversion. Keep in mind that your balance will potentially continue to grow during these 10 years, requiring additional conversions and more taxes to pay.
Low-Income Year
By maximizing conversions during years in which your income dips, you can take advantage of being in a lower tax bracket. For example, say you earn $60,000 in taxable income in a typical year, placing you in the 22% bracket and resulting in a tax liability of approximately $5,200 after taking the standard deduction. If you also convert $72,000, you’ll move up into the 24% bracket with $132,000 in total taxable income. You’d see your tax liability climb to around $21,000. Do this two years in a row and your combined tax bill will be approximately $42,000.
But say you will only receive $30,000 one year because you are taking a six-month sabbatical. You could skip conversions in the previous year and convert two years’ worth, or $144,000, in the sabbatical year. That year, you’ll have an income of $174,000, including $144,000 in conversions and $30,000 from salary. This would put you in the 24% bracket and generate a tax bill of approximately $31,000. Add the $5,200 tax bill from the previous year and your two-year tax bill could end up being around $36,200. A financial advisor can help you assess whether this strategy may be an option for you.
Non-Retirement Assets
Using non-IRA funds to pay your tax bill on a conversion allows the full amount of the rollover to go into the Roth account. If you use taxable funds rather than IRA funds to pay all taxes due on a lump sum conversion of $720,000, that’s $227,000 more you’ll have growing tax-free in your Roth.
Bottom Line
Roth rollovers can reduce future taxes and eliminate RMDs in retirement, at the cost of having to pay more in taxes today. Strategic partial conversions completed over several years, conversions timed with low-income years can potentially limit the tax pain, as well as using non-retirement assets to pay conversion taxes. Consult with financial and tax professionals to map out a tax-savvy approach.
Retirement Planning Tips
-
With a major retirement move like a Roth conversion, it helps to sit down with a financial advisor who can analyze your full financial picture. Finding a financial advisor doesn’t have to be hard. SmartAsset’s free tool matches you with up to three vetted financial advisors who serve your area, and you can have a free introductory call with your advisor matches to decide which one you feel is right for you. If you’re ready to find an advisor who can help you achieve your financial goals, get started now.
-
It’s important to have a sense of the progress you’re making as you plan and save for retirement. SmartAsset’s free retirement calculator can help you estimate how much money you may need to save to retire and whether you’re on track to hit that target.
-
Keep an emergency fund on hand in case you run into unexpected expenses. An emergency fund should be liquid — in an account that isn’t at risk of significant fluctuation like the stock market. The tradeoff is that the value of liquid cash can be eroded by inflation. But a high-interest account allows you to earn compound interest. Compare savings accounts from these banks.
-
Are you a financial advisor looking to grow your business? SmartAsset AMP helps advisors connect with leads and offers marketing automation solutions so you can spend more time making conversions. Learn more about SmartAsset AMP.
Photo credit: ©iStock.com/izusek, ©iStock.com/designer491, ©iStock.com/Chainarong Prasertthai
The post I Want to Roll Over $720k to a Roth IRA. How Do I Avoid Paying Taxes? appeared first on SmartReads by SmartAsset.
Warren Buffett Is Generating an Annual Yield of 33% to 60% From 3 Magnificent Stocks — Here's His Simple Secret to Outsize Yields
For almost 60 years, Berkshire Hathaway (NYSE: BRK.A)(NYSE: BRK.B) CEO Warren Buffett has been delivering outsize returns. Based on the closing price of Berkshire’s Class A shares (BRK.A) on Oct. 10, he’s overseen a nearly 5,500,000% aggregate return and watched his company (briefly) hit the trillion-dollar mark, which is something only eight publicly traded companies have accomplished.
The Oracle of Omaha’s secrets to success really aren’t secrets at all. Whether it’s through his annual letter to shareholders, shareholder meetings, or rare interviews with financial media, Buffett willingly discusses the traits he looks for when putting his company’s capital to work.
But among the various characteristics that have powered Berkshire’s phenomenal returns is his penchant for investing in dividend stocks. Companies that pay a dividend are almost always profitable on a recurring basis, time-tested, and capable of providing transparent growth outlooks.
More importantly, dividend stocks have absolutely crushed non-payers in the return column over the last half-century. According to The Power of Dividends: Past, Present, and Future, which was released last year by the investment advisors at Hartford Funds, dividend stocks have averaged a 9.17% annualized return over the previous 50 years (1973-2023), while non-payers have produced a more modest 4.27% average annual return over the same timeline.
Over the next 12 months, Warren Buffett is set to oversee the collection of roughly $5 billion in dividend income for Berkshire Hathaway.
However, three of Buffett’s core holdings are generating truly outsize yields that range from 33% to 60% on an annual basis. His secret to netting these supercharged yields is really simple: patience.
Coca-Cola: 60% annual yield to cost
Out of the 43 stocks and two index funds held in Berkshire Hathaway’s $313 billion portfolio, none has been a fixture longer than beverage behemoth Coca-Cola (NYSE: KO).
Buffett’s company has been a shareholder of Coca-Cola since 1988, with Berkshire boasting an enviable cost basis in the company of $3.2475 per share. Given that Coca-Cola has raised its dividend for 62 consecutive years and is currently doling out $1.94 annually, Berkshire is netting a whopping 60% annual yield on this position, relative to its cost basis. Berkshire’s brightest investment minds simply sitting on their hands will lead to $776 million in annual income over the next 12 months.
One of the clearest reasons Coke has been such a steady outperformer for decades is because it’s a consumer staples stock. This is to say that it sells products (beverages) that are in demand regardless of how well or poorly the U.S. and global economy are performing. Selling basic need goods ensures cash flow consistency year after year.
The company also has virtually unrivaled geographic diversity in its corner. Sans North Korea, Cuba, and Russia, it has operations in every other country. This means it generates highly predictable operating cash flow in developed markets, but is also moving the organic growth needle in emerging markets.
Further, Coca-Cola was named the most-chosen brand by Kantar’s “Brand Footprint” report for the 12th consecutive year in 2024. Well-known, time-tested, consumer staples stocks tend to outperform over long periods, and Coca-Cola is no exception.
American Express: 33% annual yield to cost
A second longtime holding in Berkshire Hathaway’s portfolio that’s responsible for an outsize yield is credit-services provider American Express (NYSE: AXP), which is better known as “AmEx.”
AmEx has been a continuous holding for Buffett’s company since 1991, with Berkshire sporting a cost basis in the company of about $8.49 per share. Although AmEx doesn’t increase its dividend on an annual basis like Coca-Cola, it has boosted its payout notably over time. The $2.80 per share that’s being paid out annually ($0.70 per quarter) equates to a 33% yield relative to cost for Buffett’s company.
Warren Buffett is a huge fan of financial stocks because they’re cyclical. Even though recessions are a normal part of the economic cycle, they resolve quickly. Financial stocks like AmEx are usually able to take advantage of economic expansions lasting disproportionately longer than downturns.
What’s arguably even more important for American Express is being able to take advantage of both sides of a transaction. It serves as the third-largest payment processor in the U.S. by credit card network purchase volume, which allows it to collect fees from merchants. Additionally, it generates annual fees and interest income by acting as a lender via its credit cards.
Lastly, AmEx has historically done a phenomenal job of attracting high-earning cardholders. The well-to-do are less likely to alter their spending habits, regardless of what the U.S. or global economy throw their way.
Moody’s: 34% annual yield to cost
The third high-octane stock that Warren Buffett is generating a jaw-dropping yield to cost on is ratings agency Moody’s (NYSE: MCO).
Patience is the theme of this list. Moody’s has been a pillar in Berkshire’s portfolio since being spun off from Dun & Bradstreet in 2000. Over that time, Moody’s base annual payout has grown to $3.40 per share. With Berkshire’s cost basis in Moody’s a minuscule $10.05 per share, it means Buffett’s company is netting a cool 34% yield, relative to cost.
For more than a decade, Moody’s Investors Services benefited immensely from historically low interest rates. Businesses and governments were eager to raise capital at attractive rates, which kept Moody’s ratings agency busy.
But with interest rates climbing at a rapid clip since March 2022, it’s the company’s Analytics segment that’s now driving its growth. This is the segment responsible for assessing risk management and offering compliance solutions to its customers. With a couple of predictive indicators suggesting trouble is on the horizon, such as the first meaningful decline in M2 money supply since the Great Depression and the longest yield-curve inversion in history, risk management solutions should remain a hot commodity.
Don’t miss this second chance at a potentially lucrative opportunity
Ever feel like you missed the boat in buying the most successful stocks? Then you’ll want to hear this.
On rare occasions, our expert team of analysts issues a “Double Down” stock recommendation for companies that they think are about to pop. If you’re worried you’ve already missed your chance to invest, now is the best time to buy before it’s too late. And the numbers speak for themselves:
-
Amazon: if you invested $1,000 when we doubled down in 2010, you’d have $21,266!*
-
Apple: if you invested $1,000 when we doubled down in 2008, you’d have $43,047!*
-
Netflix: if you invested $1,000 when we doubled down in 2004, you’d have $389,794!*
Right now, we’re issuing “Double Down” alerts for three incredible companies, and there may not be another chance like this anytime soon.
*Stock Advisor returns as of October 7, 2024
American Express is an advertising partner of The Ascent, a Motley Fool company. Sean Williams has no position in any of the stocks mentioned. The Motley Fool has positions in and recommends Berkshire Hathaway and Moody’s. The Motley Fool has a disclosure policy.
Warren Buffett Is Generating an Annual Yield of 33% to 60% From 3 Magnificent Stocks — Here’s His Simple Secret to Outsize Yields was originally published by The Motley Fool
Unpacking the Latest Options Trading Trends in Charles Schwab
Investors with a lot of money to spend have taken a bullish stance on Charles Schwab SCHW.
And retail traders should know.
We noticed this today when the trades showed up on publicly available options history that we track here at Benzinga.
Whether these are institutions or just wealthy individuals, we don’t know. But when something this big happens with SCHW, it often means somebody knows something is about to happen.
So how do we know what these investors just did?
Today, Benzinga‘s options scanner spotted 8 uncommon options trades for Charles Schwab.
This isn’t normal.
The overall sentiment of these big-money traders is split between 62% bullish and 25%, bearish.
Out of all of the special options we uncovered, 6 are puts, for a total amount of $650,057, and 2 are calls, for a total amount of $55,036.
What’s The Price Target?
Analyzing the Volume and Open Interest in these contracts, it seems that the big players have been eyeing a price window from $50.0 to $67.5 for Charles Schwab during the past quarter.
Analyzing Volume & Open Interest
Looking at the volume and open interest is an insightful way to conduct due diligence on a stock.
This data can help you track the liquidity and interest for Charles Schwab’s options for a given strike price.
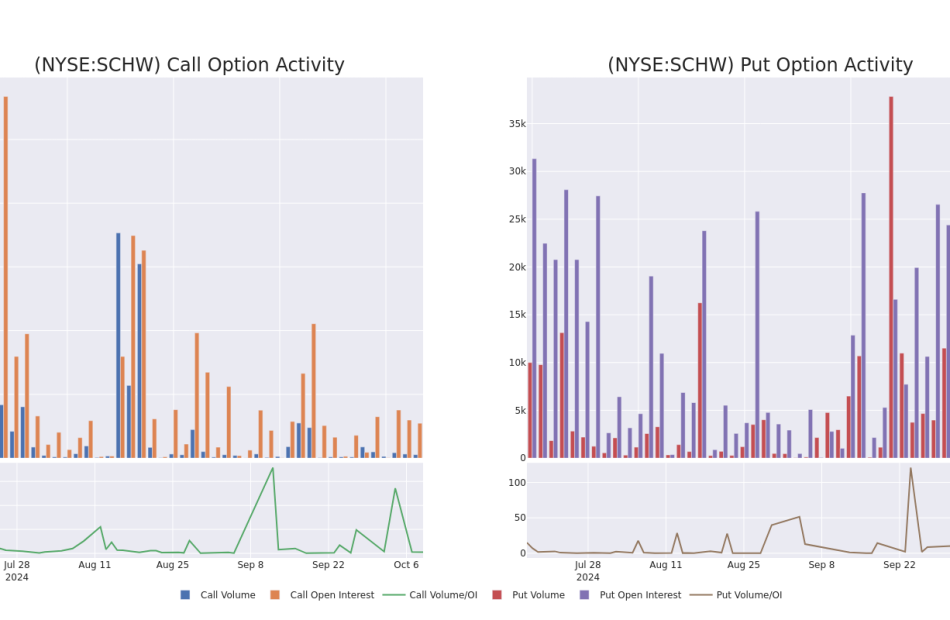
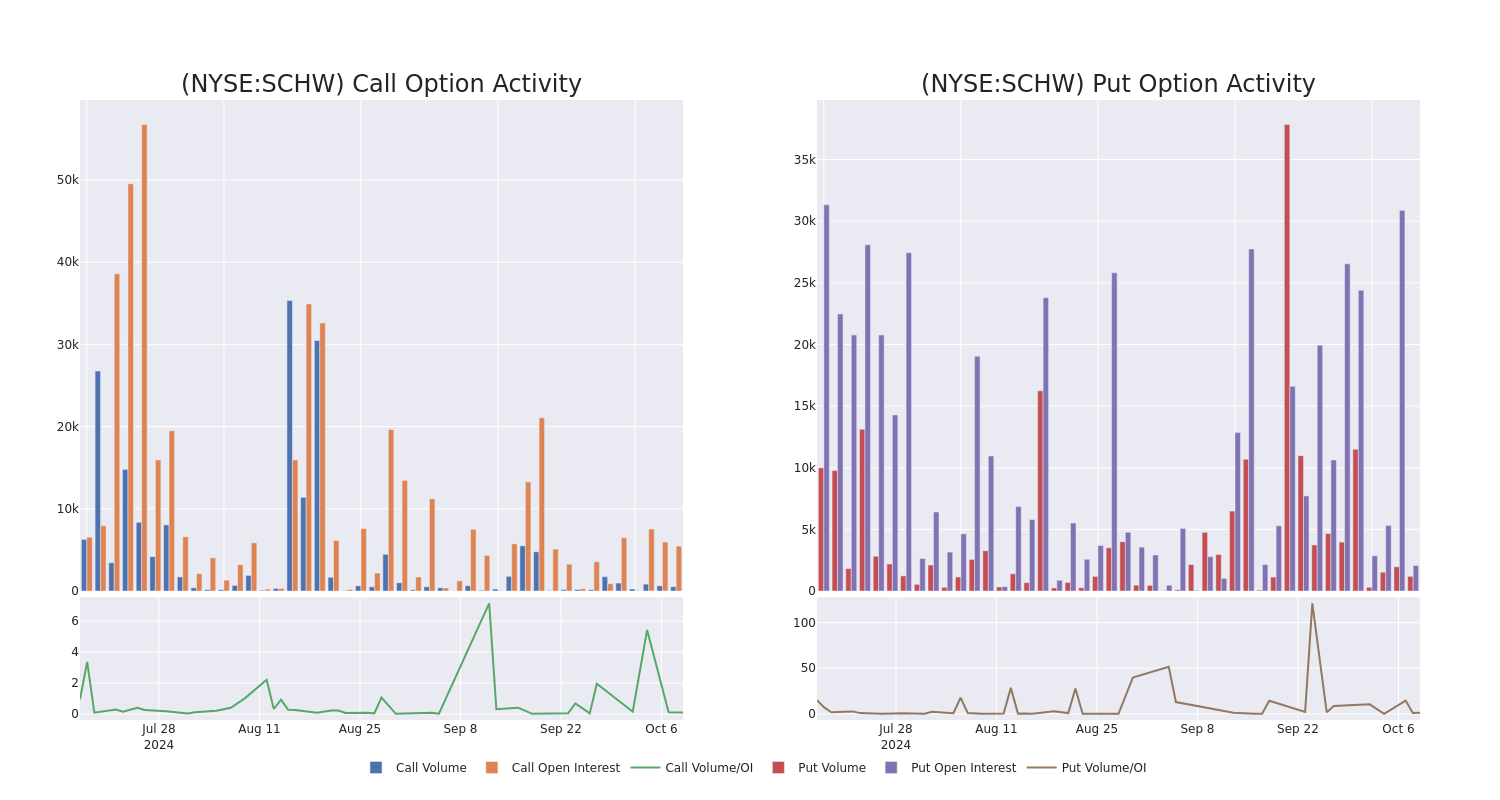
Below, we can observe the evolution of the volume and open interest of calls and puts, respectively, for all of Charles Schwab’s whale activity within a strike price range from $50.0 to $67.5 in the last 30 days.
Charles Schwab 30-Day Option Volume & Interest Snapshot
Noteworthy Options Activity:
| Symbol | PUT/CALL | Trade Type | Sentiment | Exp. Date | Ask | Bid | Price | Strike Price | Total Trade Price | Open Interest | Volume |
|---|---|---|---|---|---|---|---|---|---|---|---|
| SCHW | PUT | SWEEP | BULLISH | 01/15/27 | $9.5 | $9.45 | $9.45 | $67.50 | $273.1K | 0 | 908 |
| SCHW | PUT | SWEEP | NEUTRAL | 01/15/27 | $9.9 | $9.55 | $9.51 | $67.50 | $141.3K | 0 | 202 |
| SCHW | PUT | SWEEP | BULLISH | 01/15/27 | $9.6 | $9.55 | $9.51 | $67.50 | $101.0K | 0 | 319 |
| SCHW | PUT | SWEEP | BULLISH | 01/15/27 | $9.6 | $9.55 | $9.55 | $67.50 | $51.5K | 0 | 373 |
| SCHW | PUT | SWEEP | BULLISH | 01/15/27 | $9.5 | $9.4 | $9.45 | $67.50 | $43.4K | 0 | 618 |
About Charles Schwab
Charles Schwab operates in brokerage, wealth management, banking, and asset management. It runs a large network of brick-and-mortar brokerage branch offices and a well-established online investing website, and it has mobile trading capabilities. It also operates a bank and a proprietary asset-management business and offers services to independent investment advisors. Schwab is among the largest firms in the investment business, with over $8 trillion of client assets at the end of December 2023. Nearly all of its revenue is from the United States.
Charles Schwab’s Current Market Status
- Trading volume stands at 2,022,582, with SCHW’s price up by 0.53%, positioned at $68.04.
- RSI indicators show the stock to be may be approaching overbought.
- Earnings announcement expected in 1 days.
Professional Analyst Ratings for Charles Schwab
Over the past month, 4 industry analysts have shared their insights on this stock, proposing an average target price of $70.0.
Unusual Options Activity Detected: Smart Money on the Move
Benzinga Edge’s Unusual Options board spots potential market movers before they happen. See what positions big money is taking on your favorite stocks. Click here for access.
* Maintaining their stance, an analyst from Morgan Stanley continues to hold a Equal-Weight rating for Charles Schwab, targeting a price of $68.
* An analyst from Jefferies has decided to maintain their Buy rating on Charles Schwab, which currently sits at a price target of $73.
* Consistent in their evaluation, an analyst from Citigroup keeps a Neutral rating on Charles Schwab with a target price of $72.
* Maintaining their stance, an analyst from Goldman Sachs continues to hold a Neutral rating for Charles Schwab, targeting a price of $67.
Options are a riskier asset compared to just trading the stock, but they have higher profit potential. Serious options traders manage this risk by educating themselves daily, scaling in and out of trades, following more than one indicator, and following the markets closely.
If you want to stay updated on the latest options trades for Charles Schwab, Benzinga Pro gives you real-time options trades alerts.
Market News and Data brought to you by Benzinga APIs
© 2024 Benzinga.com. Benzinga does not provide investment advice. All rights reserved.
Expert Finds Trump's Tax Proposal Drains Money From 95% Of Households And Funnels It To The Top 5%, Widening Wealth Gap
Former President Donald Trump’s proposed tax plan has stirred up fresh controversy. A new analysis shows that it could provide substantial tax cuts for the nation’s wealthiest while burdening the rest with tax increases by 2026.
According to a recent Institute on Taxation and Economic Policy (ITEP) report, the top 1% of earners could enjoy an average tax cut of over $36,300. In comparison, the next 4% would see cuts averaging $7,200. Meanwhile, 95% of Americans could face tax hikes ranging from $600 to $1,800, depending on their income bracket.
Don’t Miss:
Trump, who often touts his tax plan as a boon for everyday Americans, would instead disproportionately benefit the wealthiest, the ITEP analysis suggests. Steve Wamhoff, ITEP’s federal policy director and lead researcher, put it bluntly in an interview with Salon: “It does seem like there’s a whole bunch of complicated proposals here to just make the rich a little bit richer and then make everyone else worse off.”
See Also: A billion-dollar investment strategy with minimums as low as $10 — you can become part of the next big real estate boom today.
The middle 20% of American households, earning between $55,100 and $94,100, would be hit with an average tax increase of $1,530 – about 2.1% of their income, per the ITEP findings. The poorest 20% of households, those earning under $28,600, would face an average tax hike of $800, accounting for 4.8% of their income. Essentially, as family income decreases, the burden of these tax hikes increases.
Other experts, like Erica York, senior economist at the Tax Foundation, have offered a more nuanced take. She noted that Trump’s proposals often combine regressive taxes, like tariffs, with more progressively distributed income tax cuts.
Trending: Studies show 50% of consumers think Financial Advisors cost much more than they do — to debunk this, this company provides matching for free and a complimentary first call with the matched advisor.
“How each income group fares will depend on which combinations of tax and tariff ideas Trump ultimately pursues,” York told Salon in an email. She added that higher tariffs could “outweigh the benefits of the reduced taxes for lower and middle-income groups.”
Key to Trump’s tax strategy is his plan to extend most of the provisions from his 2017 tax law, which expires at the end of 2025. His new proposals include reducing the corporate tax rate from 21% to 20% or even 15% for certain U.S.-made products and eliminating overtime pay and tips taxes. Additionally, Trump has suggested a sweeping 20% tariff on all imported goods and a steeper 60% tariff on goods from China.
See Also: These five entrepreneurs are worth $223 billion – they all believe in one platform that offers a 7-9% target yield with monthly dividends
Proponents argue that Trump’s plan would boost U.S. jobs and support working-class families. “President Donald Trump passed the largest tax CUTS for working families in history,” his campaign said in a statement to Salon. However, critics warn that the tariffs would function as a federal consumption tax, disproportionately affecting low-income and middle-class families.
Read Next:
UNLOCKED: 5 NEW TRADES EVERY WEEK. Click now to get top trade ideas daily, plus unlimited access to cutting-edge tools and strategies to gain an edge in the markets.
Get the latest stock analysis from Benzinga?
This article Expert Finds Trump’s Tax Proposal Drains Money From 95% Of Households And Funnels It To The Top 5%, Widening Wealth Gap originally appeared on Benzinga.com
© 2024 Benzinga.com. Benzinga does not provide investment advice. All rights reserved.
Decoding Futu Hldgs's Options Activity: What's the Big Picture?
High-rolling investors have positioned themselves bearish on Futu Hldgs FUTU, and it’s important for retail traders to take note.
This activity came to our attention today through Benzinga’s tracking of publicly available options data. The identities of these investors are uncertain, but such a significant move in FUTU often signals that someone has privileged information.
Today, Benzinga’s options scanner spotted 16 options trades for Futu Hldgs. This is not a typical pattern.
The sentiment among these major traders is split, with 43% bullish and 50% bearish. Among all the options we identified, there was one put, amounting to $41,700, and 15 calls, totaling $1,030,484.
Expected Price Movements
After evaluating the trading volumes and Open Interest, it’s evident that the major market movers are focusing on a price band between $70.0 and $190.0 for Futu Hldgs, spanning the last three months.
Analyzing Volume & Open Interest
In terms of liquidity and interest, the mean open interest for Futu Hldgs options trades today is 896.83 with a total volume of 2,304.00.
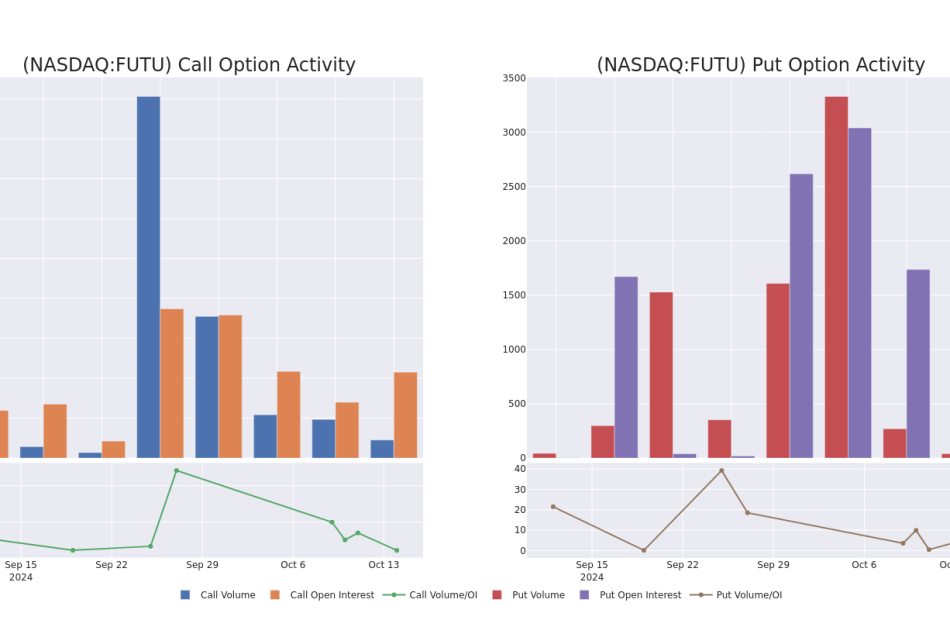
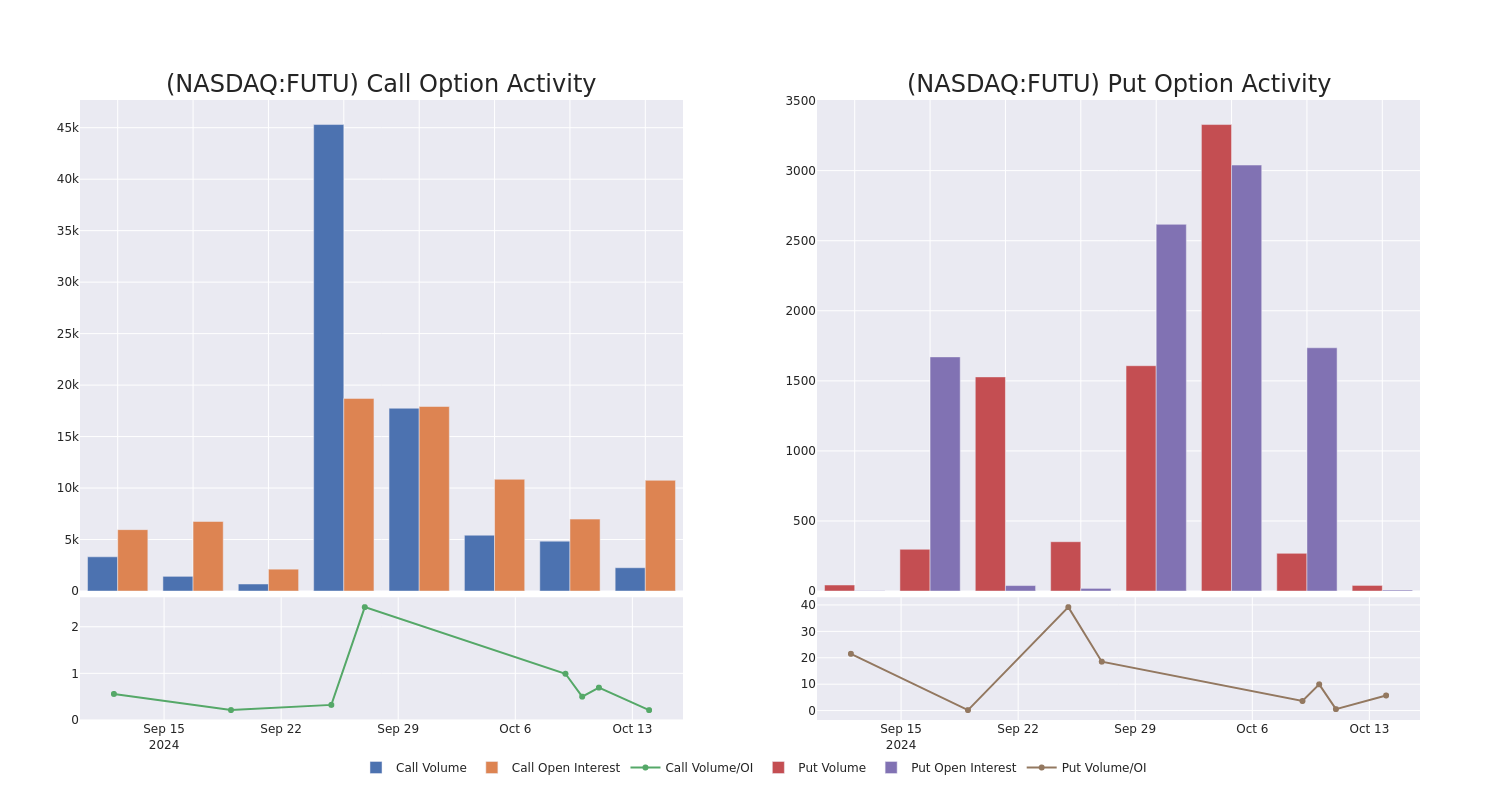
In the following chart, we are able to follow the development of volume and open interest of call and put options for Futu Hldgs’s big money trades within a strike price range of $70.0 to $190.0 over the last 30 days.
Futu Hldgs Call and Put Volume: 30-Day Overview
Noteworthy Options Activity:
| Symbol | PUT/CALL | Trade Type | Sentiment | Exp. Date | Ask | Bid | Price | Strike Price | Total Trade Price | Open Interest | Volume |
|---|---|---|---|---|---|---|---|---|---|---|---|
| FUTU | CALL | TRADE | BEARISH | 11/15/24 | $14.95 | $13.95 | $14.0 | $100.00 | $151.2K | 787 | 295 |
| FUTU | CALL | TRADE | BULLISH | 12/20/24 | $9.3 | $8.95 | $9.31 | $120.00 | $93.1K | 1.3K | 148 |
| FUTU | CALL | SWEEP | BULLISH | 12/20/24 | $18.0 | $17.0 | $18.0 | $100.00 | $90.0K | 1.0K | 50 |
| FUTU | CALL | TRADE | BEARISH | 01/16/26 | $31.5 | $29.4 | $29.85 | $115.00 | $89.5K | 105 | 30 |
| FUTU | CALL | SWEEP | BULLISH | 01/17/25 | $42.4 | $39.75 | $42.45 | $70.00 | $84.8K | 1.2K | 0 |
About Futu Hldgs
Futu Holdings Ltd is an online broker providing one-stop online investing services. The company provides its services through its digital platform Futu NiuNiu, which includes market data, trading service, and news feed of Hong Kong, Mainland China, Singapore, and United States equity markets. It generates its revenue in the form of brokerage commission and handling charge services.
Having examined the options trading patterns of Futu Hldgs, our attention now turns directly to the company. This shift allows us to delve into its present market position and performance
Present Market Standing of Futu Hldgs
- With a trading volume of 2,438,259, the price of FUTU is down by -2.95%, reaching $107.74.
- Current RSI values indicate that the stock is may be overbought.
- Next earnings report is scheduled for 38 days from now.
Expert Opinions on Futu Hldgs
1 market experts have recently issued ratings for this stock, with a consensus target price of $90.0.
Unusual Options Activity Detected: Smart Money on the Move
Benzinga Edge’s Unusual Options board spots potential market movers before they happen. See what positions big money is taking on your favorite stocks. Click here for access.
* Maintaining their stance, an analyst from B of A Securities continues to hold a Buy rating for Futu Hldgs, targeting a price of $90.
Options are a riskier asset compared to just trading the stock, but they have higher profit potential. Serious options traders manage this risk by educating themselves daily, scaling in and out of trades, following more than one indicator, and following the markets closely.
If you want to stay updated on the latest options trades for Futu Hldgs, Benzinga Pro gives you real-time options trades alerts.
Market News and Data brought to you by Benzinga APIs
© 2024 Benzinga.com. Benzinga does not provide investment advice. All rights reserved.
Busbar Trunking System Market is Projected to Reach a Valuation of US$ 11,787.3 Million at a CAGR of 6.1% by 2034 | Fact.MR Report
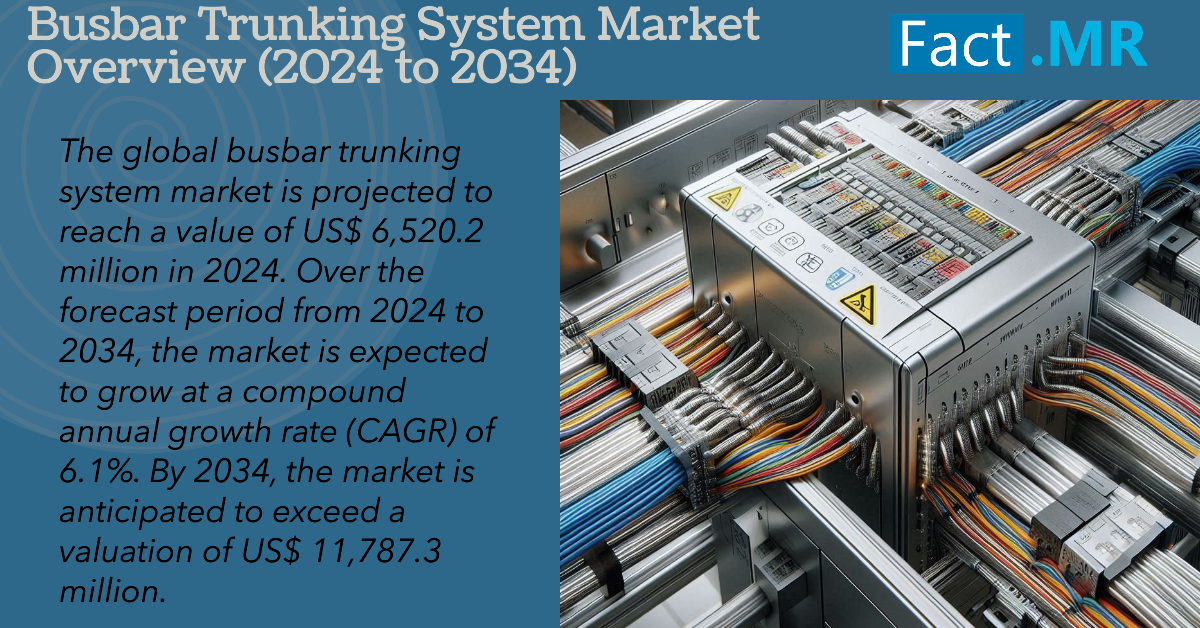
Rockville, MD , Oct. 14, 2024 (GLOBE NEWSWIRE) — The global Busbar Tunking System Market is estimated to be US$ 6,520.2 million in 2024. The market is projected to expand at a 6.1% CAGR through 2034. The market is projected to surpass US$ 11,787.3 million by 2034.
The increased demand for dependable and efficient power distribution systems across various industries. Busbar trunking systems have been praised for their high capacity, minimal maintenance requirements, and ease of installation, making them an excellent choice for power distribution in industrial and commercial environments.
The growing use of renewable energy sources and the demand for smart grid infrastructure have all contributed to market expansion. Furthermore, the development of advanced technologies such as intelligent monitoring systems and the incorporation of IoT into busbar trunking systems has accelerated the growth of this industry. Another factor fueling the industry’s growth is an increasing focus on energy efficiency and sustainability.
The high initial cost of installing busbar trunking systems is one of the primary limitations limiting industry expansion. These systems necessitate a considerable initial investment for purchase and installation, which is predicted to be difficult for many companies and organizations, particularly those with limited resources.
For More Insights into the Market, Request a Sample of this Report: https://www.factmr.com/connectus/sample?flag=S&rep_id=9697
Key Takeaways from the Market Study:
- North America’s busbar trunking system market is expected to grow at a CAGR of 6.3% from 2024 to 2034.
- The market is projected to register a CAGR of 6.1% in the United States over the forecast period.
- China’s busbar trunking system market is anticipated to rise at a CAGR of 6.8% through 2034.
- Based on application type, the diesel engine segment leads the market, with an expected market share of 75.7% in 2024.
“The busbar trunking system manufacturers offer a highly efficient and dependable solution to satisfy the rising demand, making it a popular option for businesses to strengthen their power infrastructure. Furthermore, the system’s ease of installation, versatility, and low maintenance requirements have boosted its popularity.” says a Fact.MR analyst.
Leading Players Driving Innovation in the Busbar Trunking System Market:
General Electric Company, Legrand, Schneider Electric SE, Rittal GmbH and Co. KG, Sati Italia S.p.A., ARJ Group, C and S Electric Limited, EAE Inc., Eaton Corporation, Siemens AG
These players are well-known for their high-quality products and exceptional customer service, which has helped them maintain a dominant market position. However, several smaller companies are gaining traction by providing more economical solutions to customers.
Busbar Trunking System Industry News:
- ABB completed the acquisition of GE Industrial Solutions in 2018. It is anticipated that this move will strengthen the company’s electrification business segment, boosting revenue in the power distribution sector and strengthening ABB’s standing in the electrification market.
- In 2021, ABB completed its acquisition of GE Industrial Solutions. This advancement is expected to strengthen the company’s electrification business segment, increasing ABB’s revenue in the power distribution industry and thereby improving the company’s position in the electrification market.
Get Customization on this Report for Specific Research Solutions: https://www.factmr.com/connectus/sample?flag=S&rep_id=9697
Segmentation of Busbar Trunking System Market Research:
- By Product Type:
- Low Voltage Rated Busbar Trunking Systems (Up to 1.1kV)
- Medium Voltage Rated Busbar Trunking Systems (3kV – 40 kV)
- By Application:
- Gasoline Engines
- Diesel Engines
Checkout More Related Studies Published by Fact.MR Research:
Fire Protection System Market: The global fire protection system market is estimated to achieve a size of US$ 70.48 billion in 2024, according to a revised research report published by Fact.MR. Demand is projected to expand at a notable CAGR of 9.1% to touch a valuation of US$ 168.4 billion by 2034-end.
Land Survey Equipment System Market: The global land survey equipment system market is expected to reach a valuation of US$ 8,523.2 million in 2024 and is projected to climb to US$ 13,363.4 million by 2034, expanding at a CAGR of 4.6% during the forecast period of 2024 to 2034.
Acoustic Emission-based NDT Market: The global acoustic emission-based NDT market is estimated to generate revenue worth US$ 307.5 million in 2024 and thereafter forecasted to a reach value of US$ 477.6 million by the end of 2034. The market has been projected to rise at a 4.5% CAGR between 2024 and 2034.
Bandsaw Machine Market: Revenue from the global bandsaw machine market is projected to reach US$ 3.48 billion in 2024. The market has been forecasted to increase to a size of US$ 4.96 billion by the end of 2034, expanding at a CAGR of 3.6% over the next ten years.
Construction Equipment Rental Market: Revenue from the global construction equipment rental market is estimated to reach US$ 131.2 billion in 2024. The market has been projected to climb to a value of US$ 201.81 billion by the end of 2034, expanding at a CAGR of 4.4% between 2024 and 2034.
About Us:
Fact.MR is a distinguished market research company renowned for its comprehensive market reports and invaluable business insights. As a prominent player in business intelligence, we deliver deep analysis, uncovering market trends, growth paths, and competitive landscapes. Renowned for its commitment to accuracy and reliability, we empower businesses with crucial data and strategic recommendations, facilitating informed decision-making and enhancing market positioning.
With its unwavering dedication to providing reliable market intelligence, FACT.MR continues to assist companies in navigating dynamic market challenges with confidence and achieving long-term success. With a global presence and a team of experienced analysts, FACT.MR ensures its clients receive actionable insights to capitalize on emerging opportunities and stay ahead in the competitive landscape.
Contact:
US Sales Office:
11140 Rockville Pike
Suite 400
Rockville, MD 20852
United States
Tel: +1 (628) 251-1583
Sales Team: sales@factmr.com
Follow Us: LinkedIn | Twitter | Blog

© 2024 Benzinga.com. Benzinga does not provide investment advice. All rights reserved.
Johnson & Johnson Preps For Q3 Earnings As MedTech Expands, But Stock Sends Mixed Signals
Johnson & Johnson JNJ is set to announce its third quarter earnings on Oct. 15 before the market opens. Wall Street is expecting the pharmaceutical and healthcare giant to post earnings per share (EPS) of $2.21 and revenue of $22.16 billion.
But while J&J’s numbers are in focus, recent headlines about its MedTech acquisitions and drug trial halts are stealing the spotlight.
MedTech Grows, Drug Trials Stumble
Johnson & Johnson recently completed its acquisition of V-Wave, adding a minimally invasive cardiovascular treatment to its MedTech portfolio. The Ventura Interatrial Shunt is expected to strengthen J&J’s position in tackling heart failure, but the acquisition comes with a short-term cost. The company has warned that this move will dilute adjusted EPS by around 24 cents in 2024 and 6 cents in 2025, an update they’ll likely address in Tuesday’s earnings report.
On the flip side, the company had to discontinue its Phase 3 SunRISe-2 trial, which was investigating a treatment for muscle-invasive bladder cancer. The trial didn’t show superiority over chemoradiation, leading to its early termination, though J&J remains optimistic about the future of its TARIS platform, forecasting a $5 billion potential.
The Charts Are Sending Mixed Signals
Despite some positive news in the MedTech arena, Johnson & Johnson’s stock has had a relatively stagnant year, up just 0.93% year-to-date and only 2.49% over the past year. But in the past six months, the stock has seen a 9.40% rise, reflecting a slow but steady recovery.
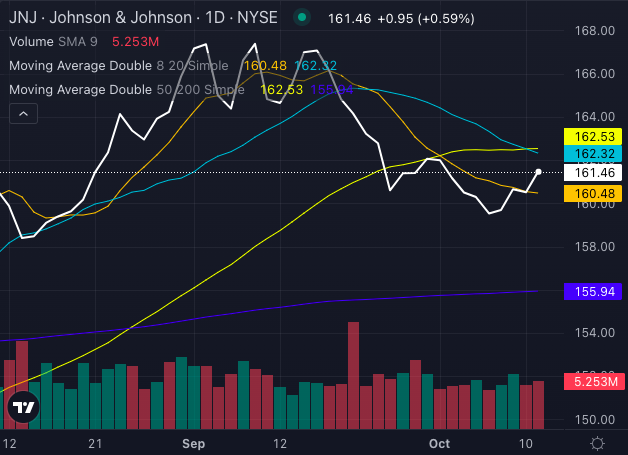
Chart created using Benzinga Pro
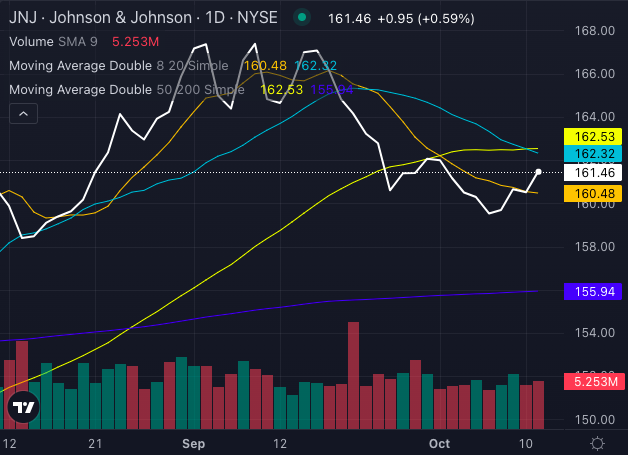
At its current price of $161.46, JNJ stock is just above its eight-day simple moving average of $160.48, a positive sign. However, the stock is lagging behind its 20-day and 50-day simple moving averages, sitting at $162.32 and $162.53, respectively. This signals some underlying selling pressure that may persist in the near term.
Read Also: What Analysts Are Saying About Johnson & Johnson Stock
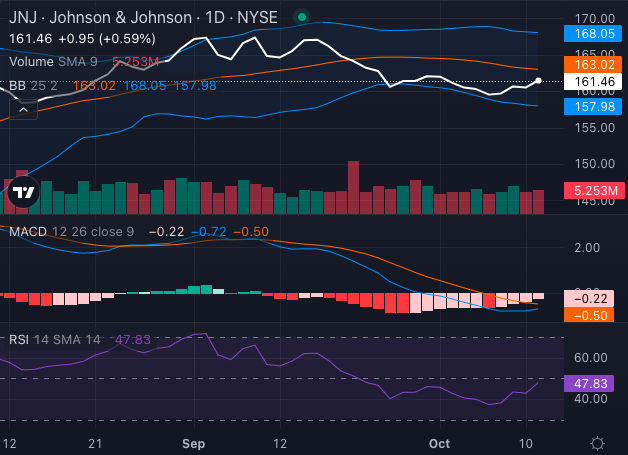
Chart created using Benzinga Pro
The Moving Average Convergence/Divergence (MACD) indicator at a negative 0.72 leans toward bearishness, hinting at continued downward pressure. Meanwhile, JNJ stock’s Relative Strength Index (RSI) of 47.83 suggests the stock is in neutral territory.
The Bollinger Bands show a range between $157.98 and $168.05, with JNJ stock nestled in the lower bearish band. This positioning could suggest that the stock is poised for a bounce, but given the selling pressure, caution is warranted.
Can Q3 Earnings Change The Tune?
All eyes will be on J&J’s third-quarter earnings report. Investors are particularly interested in any updates to the company’s guidance following the V-Wave acquisition and the ongoing performance of its MedTech and Innovative Medicine segments.
Johnson & Johnson’s charts may not be flashing strong bullish signals, but its strategic moves in MedTech and future product pipeline could offer long-term growth potential.
Investors will have to weigh the upcoming earnings report to see if J&J stock can shake off recent pressures and revitalize its performance.
Read Next:
Photo: Shutterstock
Market News and Data brought to you by Benzinga APIs
© 2024 Benzinga.com. Benzinga does not provide investment advice. All rights reserved.
3 No-Brainer Stocks to Buy If Kamala Harris and Democrats Sweep in November
Vice President Kamala Harris has a slight edge in becoming the next president, according to Decision Desk HQ’s model. The Democratic Party could have a tougher time gaining control of Congress, though. Decision Desk HQ estimates that the GOP has a 54% probability of holding onto its majority in the House and a 71% chance of recapturing a majority in the Senate.
Still, it’s possible that momentum could swing toward the Democrats in the final weeks of the campaign. How might investors take advantage of such a scenario? Here are three no-brainer stocks to buy if Harris and Democrats sweep in November.
1. D.R. Horton
D.R. Horton (NYSE: DHI) would likely be among the biggest winners if Harris wins and Democrats control Congress in the upcoming elections. The company has been the largest U.S. homebuilder by volume since 2002. It operates in 121 markets across 33 states.
Harris has proposed a plan that she says will promote the construction of 3 million new homes over the next four years. She wants to give $25,000 to first-time homebuyers to help them with down payments. The Democratic presidential nominee also seeks to provide a tax incentive for homebuilders who sell homes to first-time homebuyers. Both proposals would almost certainly boost D.R. Horton’s revenue.
Another key reason many D.R. Horton shareholders might cheer a Democratic sweep is inflation. A survey of nearly 40 top U.S. economists by the Financial Times and the University of Chicago found that 70% believed Harris’ policies would lead to lower inflation than those proposed by former President Donald Trump. Lower inflation translates to lower interest rates — an important ingredient to D.R. Horton’s success.
Regardless of which party is in control after the elections, though, D.R. Horton should be in great shape over the long run. The U.S. continues to face a housing shortage. And there’s only one practical solution to the problem: Building more homes.
2. Brookfield Renewable
Democrats have been vocal supporters of renewable energy for years. Harris is no exception. She promises to “invest in building the energy industries of the future.” The Vice President also wants to cut red tape to allow clean energy projects to be completed quickly. Brookfield Renewable (NYSE: BEP) (NYSE: BEPC) could be a beneficiary of these policies.
Harris seeks to protect the energy security of the U.S. and keep the country from having to rely on foreign oil. While domestic production of oil and natural gas will be needed to achieve this goal, renewable power will be increasingly important.
Brookfield Renewable is one of the largest producers of clean energy with hydroelectric, wind, and solar facilities across the world. The company currently has an operating capacity of around 37 gigawatts, twice as much as it had in 2020. Its development capacity is roughly 200 gigawatts.
Two other factors should help Brookfield Renewable even if Democrats don’t win across the board in November. First, renewable power is already the lowest-cost energy alternative. Second, the demand for electricity is growing rapidly, especially with the surging number of data centers.
3. UnitedHealth Group
Harris has committed to making permanent the tax credits available to working and middle-class families purchasing health insurance on the Affordable Care Act (ACA) marketplace if elected president. She wants to accelerate the speed of Medicare drug price negotiations.
Both proposals should help companies that offer health plans on the marketplace and Medicare Part D prescription drug plans. UnitedHealth Group (NYSE: UNH) is the biggest health insurer in the group.
UnitedHealth Group offers individual and family health plans on ACA health insurance marketplaces in 26 states. Last year, the company enrolled 10.2 million people in Medicare Part D plans, including stand-alone plans and Medicare Advantage plans.
There’s a bigger tailwind, though, that should be more important to UnitedHealth Group over the long term than which party is in power in Washington, D.C.: an aging population. The number of Medicare enrollees is projected to soar by 2030 as baby boomers retire. Look for Medicare Advantage to become an even more important part of UnitedHealth’s business in the coming years.
Should you invest $1,000 in UnitedHealth Group right now?
Before you buy stock in UnitedHealth Group, consider this:
The Motley Fool Stock Advisor analyst team just identified what they believe are the 10 best stocks for investors to buy now… and UnitedHealth Group wasn’t one of them. The 10 stocks that made the cut could produce monster returns in the coming years.
Consider when Nvidia made this list on April 15, 2005… if you invested $1,000 at the time of our recommendation, you’d have $826,069!*
Stock Advisor provides investors with an easy-to-follow blueprint for success, including guidance on building a portfolio, regular updates from analysts, and two new stock picks each month. The Stock Advisor service has more than quadrupled the return of S&P 500 since 2002*.
*Stock Advisor returns as of October 7, 2024
Keith Speights has positions in Brookfield Renewable and Brookfield Renewable Partners. The Motley Fool has positions in and recommends Brookfield Renewable and D.R. Horton. The Motley Fool recommends Brookfield Renewable Partners and UnitedHealth Group. The Motley Fool has a disclosure policy.
3 No-Brainer Stocks to Buy If Kamala Harris and Democrats Sweep in November was originally published by The Motley Fool

