Earnings Outlook For OFG Bancorp
OFG Bancorp OFG is preparing to release its quarterly earnings on Wednesday, 2024-10-16. Here’s a brief overview of what investors should keep in mind before the announcement.
Analysts expect OFG Bancorp to report an earnings per share (EPS) of $1.02.
Investors in OFG Bancorp are eagerly awaiting the company’s announcement, hoping for news of surpassing estimates and positive guidance for the next quarter.
It’s worth noting for new investors that stock prices can be heavily influenced by future projections rather than just past performance.
Earnings Track Record
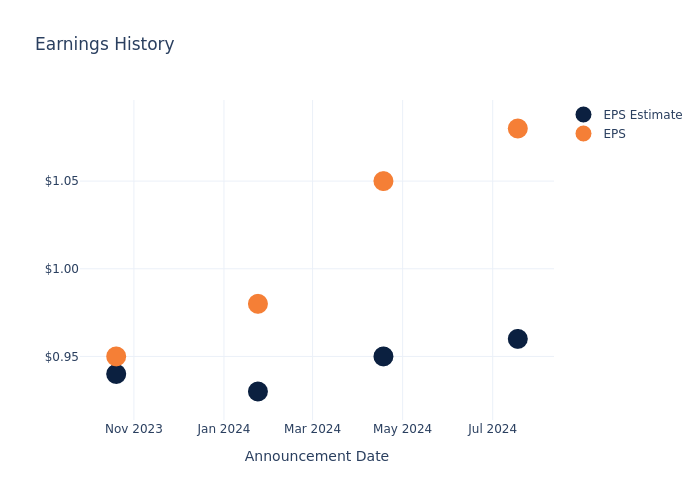
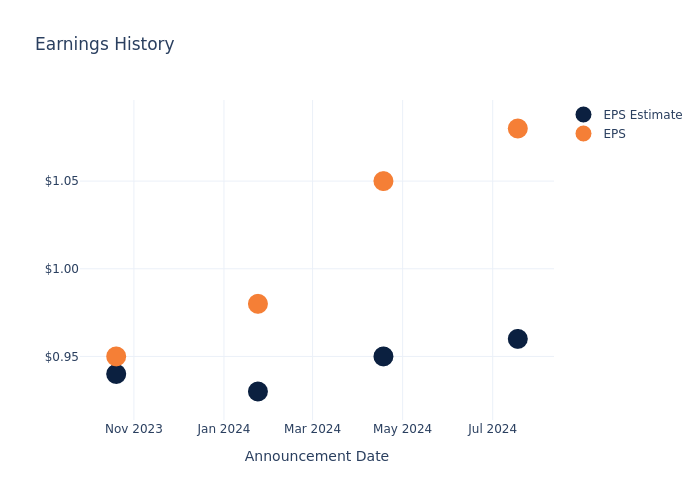
The company’s EPS beat by $0.12 in the last quarter, leading to a 1.53% increase in the share price on the following day.
Here’s a look at OFG Bancorp’s past performance and the resulting price change:
| Quarter | Q2 2024 | Q1 2024 | Q4 2023 | Q3 2023 |
|---|---|---|---|---|
| EPS Estimate | 0.96 | 0.95 | 0.93 | 0.94 |
| EPS Actual | 1.08 | 1.05 | 0.98 | 0.95 |
| Price Change % | 2.0% | 4.0% | 4.0% | -4.0% |
Stock Performance
Shares of OFG Bancorp were trading at $44.41 as of October 14. Over the last 52-week period, shares are up 50.73%. Given that these returns are generally positive, long-term shareholders are likely bullish going into this earnings release.
To track all earnings releases for OFG Bancorp visit their earnings calendar on our site.
This article was generated by Benzinga’s automated content engine and reviewed by an editor.
Market News and Data brought to you by Benzinga APIs
© 2024 Benzinga.com. Benzinga does not provide investment advice. All rights reserved.
Boeing Shares Jump As Troubled Aerospace Company Inks $10B Supplemental Credit Agreement With Big Banks
Boeing Company BA shares are trading higher on Tuesday. The company inked a $10 billion supplemental credit agreement with several big banks.
Bank of America, Citibank, Goldman Sachs, and JPMorgan are on board as joint lead arrangers and bookrunners.
Boeing plans to pay a 0.5% funding fee on each advance under the credit agreement and a 0.50%-1.00% duration fee on outstanding advances after 90 to 270 days.
Non-SOFR loans will accrue interest at the higher of Citibank’s base rate, federal funds rate plus 0.50%, or Adjusted Term SOFR plus 1.00%, with an additional 0.375%-1.00%, based on Boeing’s credit rating.
SOFR loans will bear interest at Adjusted Term SOFR plus 1.375%-2.00%. Commitments end in 120 days, with advances maturing in 364 days.
The credit agreement limits Boeing’s debt to 60% of total capital. It also restricts liens to $250 million, and allows mergers only if Boeing is the surviving entity.
Apart from this, Boeing disclosed a mixed shelf offering of up to $25 billion, which includes Senior and Subordinated Debt Securities, Common Stock, and Preferred Stock.
This week, Boeing announced a 10% workforce reduction of approximately 17,000 jobs in an effort to stem financial losses.
Investors can gain exposure to the stock via IShares U.S. Aerospace & Defense ETF ITA and Gabelli Commercial Aerospace and Defense ETF GCAD.
Price Action: BA shares are up 0.95% at $150.40 premarket at the last check Tuesday.
Read Next:
Image: Shutterstock
Market News and Data brought to you by Benzinga APIs
© 2024 Benzinga.com. Benzinga does not provide investment advice. All rights reserved.
[Latest] Global Renewable Methanol Market Size/Share Worth USD 26.7 Billion by 2033 at a 54.7% CAGR: Custom Market Insights (Analysis, Outlook, Leaders, Report, Trends, Forecast, Segmentation, Growth, Growth Rate, Value)
Austin, TX, USA, Oct. 15, 2024 (GLOBE NEWSWIRE) — Custom Market Insights has published a new research report titled “Renewable Methanol Market Size, Trends and Insights By Feedstock (Agriculture Waste, Municipal Waste, Renewable Energy, Others), By Application (Gasoline, Formaldehyde, MTBE, Dimethyl Ether, MTO, Acetic Acid, Others), and By Region – Global Industry Overview, Statistical Data, Competitive Analysis, Share, Outlook, and Forecast 2024–2033“ in its research database.
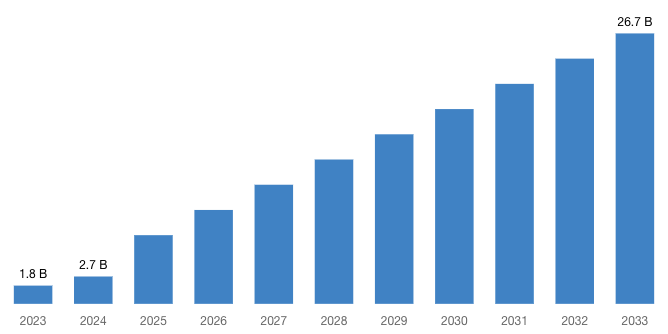
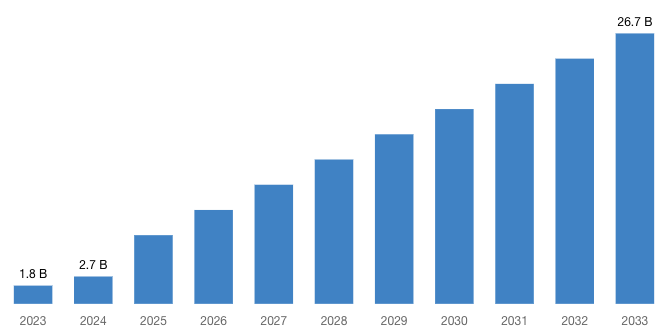
“According to the latest research study, the demand of global Renewable Methanol Market size & share was valued at approximately USD 1.8 Billion in 2023 and is expected to reach USD 2.7 Billion in 2024 and is expected to reach a value of around USD 26.7 Billion by 2033, at a compound annual growth rate (CAGR) of about 54.7% during the forecast period 2024 to 2033.”
Click Here to Access a Free Sample Report of the Global Renewable Methanol Market @ https://www.custommarketinsights.com/request-for-free-sample/?reportid=52609
Renewable Methanol Market: Overview
Methanol that is created using sustainable energy sources, like carbon dioxide, hydrogen, and biomass, is known as renewable methanol. Second-generation methanol made from renewable energy sources as opposed to classic methanol, which is made from fossil fuels, is called renewable methanol.
The industry is growing because using renewable methanol as an energy carrier allows for the chemical storage of excess renewable energy for later use. By taking the place of traditional gasoline and diesel in some applications, the use of renewable methanol as a fuel substitute for internal combustion engines and fuel cells to lower emissions from the transportation sector has created chances for market growth.
Furthermore, as companies search for methods to reduce emissions and repurpose residual carbon, the use of carbon dioxide (CO2) as a feedstock for the synthesis of renewable methanol is becoming more and more popular. However, the cost of producing methanol from renewable sources is higher than that of conventional methods that use fossil fuels, which limits the expansion of the market.
However, it is anticipated that the market will grow during the projected period due to increased industrialization activities, expanded residential infrastructure development, a desire to reduce emissions through fuel consumption, and innovations in the field of using renewable sources to produce fuel.
Request a Customized Copy of the Renewable Methanol Market Report @ https://www.custommarketinsights.com/inquire-for-discount/?reportid=52609
By feedstock, the renewable energy segment held the highest market share in 2023 and is expected to keep its dominance during the forecast period 2024-2033. The growth of the renewable methanol market is also being aided by the increasing number of industrial installations, the escalation of commercial activities like transportation, and the emission of dangerous gases like carbon dioxide and carbon monoxide when normal fuels burn.
By application, the formaldehyde segment held the highest market share in 2023 and is expected to keep its dominance during the forecast period 2024-2033. Formaldehyde an integral component and a backbone for the majority of chemical products.
Methyl-t-Butyl Ether is a widely used component in fuel for gasoline-driven engines and therefore has significant applications in the global transportation sector. Furthermore, the use of renewable methanol in gasoline blends is being encouraged because of its many uses, including as an octane booster, transition fuel, and fuel extender.
European Parliament and the European Council agreed to increase the maritime transport sector’s contribution to the European Union Green Deal, which aims to EU reduce greenhouse gas emissions by at least 55% by 2030, and reach climate neutrality by 2050.
BASF SE is a European multinational company and the largest chemical producer in the world. Its headquarters are located in Ludwigshafen, Germany. The BASF Group develops, produces and markets about 700 intermediates around the world. The most important of the division’s product groups include amines, diols, polyalcohols, acids and specialties.
Report Scope
| Feature of the Report | Details |
| Market Size in 2024 | USD 2.7 Billion |
| Projected Market Size in 2033 | USD 26.7 Billion |
| Market Size in 2023 | USD 1.8 Billion |
| CAGR Growth Rate | 54.7% CAGR |
| Base Year | 2023 |
| Forecast Period | 2024-2033 |
| Key Segment | By Feedstock, Application and Region |
| Report Coverage | Revenue Estimation and Forecast, Company Profile, Competitive Landscape, Growth Factors and Recent Trends |
| Regional Scope | North America, Europe, Asia Pacific, Middle East & Africa, and South & Central America |
| Buying Options | Request tailored purchasing options to fulfil your requirements for research. |
(A free sample of the Renewable Methanol report is available upon request; please contact us for more information.)
Request a Customized Copy of the Renewable Methanol Market Report @ https://www.custommarketinsights.com/report/renewable-methanol-market/
Our Free Sample Report Consists of the following:
- Introduction, Overview, and in-depth industry analysis are all included in the 2024 updated report.
- The COVID-19 Pandemic Outbreak Impact Analysis is included in the package.
- About 220+ Pages Research Report (Including Recent Research)
- Provide detailed chapter-by-chapter guidance on the Request.
- Updated Regional Analysis with a Graphical Representation of Size, Share, and Trends for the Year 2024
- Includes Tables and figures have been updated.
- The most recent version of the report includes the Top Market Players, their Business Strategies, Sales Volume, and Revenue Analysis
- Custom Market Insights (CMI) research methodology
(Please note that the sample of the Renewable Methanol report has been modified to include the COVID-19 impact study prior to delivery.)
Request a Customized Copy of the Renewable Methanol Market Report @ https://www.custommarketinsights.com/report/renewable-methanol-market/
CMI has comprehensively analyzed renewable methanol market. The driving forces, restraints, challenges, opportunities, and key trends have been explained in depth to depict an depth scenario of the market. Segment wise market size and market share during the forecast period are duly addressed to portray the probable picture of this global renewable methanol application.
The competitive landscape includes key innovators, after market service providers, market giants as well as niche players are studied and analyzed extensively concerning their strengths, weaknesses as well as value addition prospects. In addition, this report covers key players profiling, market shares, mergers and acquisitions, consequent market fragmentation, new trends and dynamics in partnerships.
Key questions answered in this report:
- What is the size of the Renewable Methanol market and what is its expected growth rate?
- What are the primary driving factors that push the Renewable Methanol market forward?
- What are the Renewable Methanol Industry’s top companies?
- What are the different categories that the Renewable Methanol Market caters to?
- What will be the fastest-growing segment or region?
- In the value chain, what role do essential players play?
- What is the procedure for getting a free copy of the Renewable Methanol market sample report and company profiles?
Key Offerings:
- Market Share, Size & Forecast by Revenue | 2024−2033
- Market Dynamics – Growth Drivers, Restraints, Investment Opportunities, and Leading Trends
- Market Segmentation – A detailed analysis by Types of Services, by End-User Services, and by regions
- Competitive Landscape – Top Key Vendors and Other Prominent Vendors
Buy this Premium Renewable Methanol Research Report | Fast Delivery Available – [220+ Pages] @ https://www.custommarketinsights.com/report/renewable-methanol-market/
Renewable Methanol Market: Regional Analysis
By Region, Renewable Methanol Market is segmented into North America, Europe, Asia Pacific, Latin America, the Middle East & Africa. Europe is the leading region in the Renewable Methanol Market in 2023 with a market share of 33.4% and is expected to keep its dominance during the forecast period 2024-2033.
Europe has posed a substantial market for renewable methanol since the introduction of the biofuel policy in the region in 2003, which set regulations and obligations to utilize 10% of renewable energy in the transportation sector of the region.
European Parliament and the European Council agreed to increase the maritime transport sector’s contribution to the European Union Green Deal, which aims to EU reduce greenhouse gas emissions by at least 55% by 2030, and reach climate neutrality by 2050.
The European Investment Bank is aiming to support more than Eur1 trillion of environmentally sustainable investments by 2030. In 2022, Danish company Topsøe AS signed a USD 45 million loan agreement with EIB to support its research into innovative green hydrogen technologies that may be used in several downstream sectors.
Request a Customized Copy of the Renewable Methanol Market Report @ https://www.custommarketinsights.com/report/renewable-methanol-market/
(We customized your report to meet your specific research requirements. Inquire with our sales team about customizing your report.)
Still, Looking for More Information? Do OR Want Data for Inclusion in magazines, case studies, research papers, or Media?
Email Directly Here with Detail Information: support@custommarketinsights.com
Browse the full “Renewable Methanol Market Size, Trends and Insights By Feedstock (Agriculture Waste, Municipal Waste, Renewable Energy, Others), By Application (Gasoline, Formaldehyde, MTBE, Dimethyl Ether, MTO, Acetic Acid, Others), and By Region – Global Industry Overview, Statistical Data, Competitive Analysis, Share, Outlook, and Forecast 2024–2033“ Report at https://www.custommarketinsights.com/report/renewable-methanol-market/
List of the prominent players in the Renewable Methanol Market:
- Advanced Chemical Technologies
- Apex Energy Teterow GmbH
- Carbon Recycling International
- BASF SE
- Enerkem
- Fraunhofer
- Innogy
- Nordic Green
- OCI N.V.
- Sodra
- Uniper SE
- Vertimass LLC
- Methanex Corporation
- BioMCN
- Chemrec Inc.
- VarmlandsMethanol
- Alberta Pacific
- New Hope Energy
- Trans World Energy
- ENI
- Liquid wind
- Veolia
- Others
Click Here to Access a Free Sample Report of the Global Renewable Methanol Market @ https://www.custommarketinsights.com/report/renewable-methanol-market/
Spectacular Deals
- Comprehensive coverage
- Maximum number of market tables and figures
- The subscription-based option is offered.
- Best price guarantee
- Free 35% or 60 hours of customization.
- Free post-sale service assistance.
- 25% discount on your next purchase.
- Service guarantees are available.
- Personalized market brief by author.
Browse More Related Reports:
Synthetic Ethanol Market: Synthetic Ethanol Market Size, Trends and Insights By Feedstock (Starch, Sugar, Cellulose Based, Others), By Application (Fuel & Fuel Additives, Industrial Solvents, Beverages, Disinfectant, Personal Care, Others), and By Region – Global Industry Overview, Statistical Data, Competitive Analysis, Share, Outlook, and Forecast 2024–2033
US Building Insulation Market: US Building Insulation Market Size, Trends and Insights By Type (Mineral Wool, Glass Wool, Stone Wool, Foamed Plastics, Expanded Polystyrene (EPS), Extruded Polystyrene (XPS), Polyurethane (PU), Polyisocyanurate (PIR), Other, Fiberglass, Cellulose, Aerogels, Others), By Application (Floor Basement, Wall, Roof Ceiling), By End User (Residential, Non-Residential, Industrial, Commercial, Others), and By Region – Industry Overview, Statistical Data, Competitive Analysis, Share, Outlook, and Forecast 2024–2033
Acoustic Ceiling Tiles Market: Acoustic Ceiling Tiles Market Size, Trends and Insights By Type (Mineral Wool Ceiling Tiles, Metal Ceiling Tiles, Gypsum Ceiling Tiles, Wood Ceiling Tiles, Others), By Application (Commercial Buildings, Educational Institutions, Healthcare Facilities, Industrial Settings, Others), By End User (Architects and Interior Designers, Building Contractors, Facility Managers, Others), and By Region – Global Industry Overview, Statistical Data, Competitive Analysis, Share, Outlook, and Forecast 2024–2033
North America Spoolable Pipe Market: North America Spoolable Pipe Market Size, Trends and Insights By Product Type (Flexible Spoolable Pipe, Rigid Spoolable Pipe), By Reinforcement Type (Fiber Reinforcement, Glass Reinforcement, Carbon Reinforcement, Other Reinforcement, Steel Reinforcement, Hybrid Reinforcement), By Application (Onshore, Production and Gathering Lines, Injection Pipes, Disposal Lines, Others, Offshore, Flowlines, Jumpers, Others, Downhole, Water, Others), By End User (Oil & Gas, Municipalities, Mining, Chemical & Petrochemical, Food Processing, Others), and By Region – Industry Overview, Statistical Data, Competitive Analysis, Share, Outlook, and Forecast 2024–2033
Aerosol Disinfectants Market: Aerosol Disinfectants Market Size, Trends and Insights By Product Category (Plain, Scented), By Sale Channels (Hypermarkets/Supermarkets, Convenience Stores, Online Retail Stores, Others), By Application (Residential, Commercial, Industrial), and By Region – Global Industry Overview, Statistical Data, Competitive Analysis, Share, Outlook, and Forecast 2024–2033
Lead Smelting and Refining Market: Lead Smelting and Refining Market Size, Trends and Insights By Technology (Pyrometallurgical Methods, Hydrometallurgical Methods, Electrometallurgical Methods), By Environmental Compliance (Standard Compliance, Advanced Compliance), By Distribution Channel (Direct Sales, Distributors, Online Sales), By Application (Lead Acid Batteries, Radiation Shielding, Cable Sheathing, Others), and By Region – Global Industry Overview, Statistical Data, Competitive Analysis, Share, Outlook, and Forecast 2024–2033
Titanium Dioxide Market: Titanium Dioxide Market Size, Trends and Insights By Grade (Rutile, Anatase), By Application (Paints & Coatings, Plastics, Paper, Cosmetics, Inks, Textiles, Food Additives, Others), By Production Process (Sulfate Process, Chloride Process), By End-Use Industry (Automotive, Construction, Packaging, Consumer Goods, Others), and By Region – Global Industry Overview, Statistical Data, Competitive Analysis, Share, Outlook, and Forecast 2024–2033
Synthetic Organic Alcohol Market: Synthetic Organic Alcohol Market Size, Trends and Insights By Types of Alcohols (Methanol, Ethanol, Isopropanol, Butanol, Others), By Application (Solvents, Disinfectants, Antifreeze, Fuel Additives, Others), By End Users (Pharmaceuticals, Cosmetics, Automotive, Others), and By Region – Global Industry Overview, Statistical Data, Competitive Analysis, Share, Outlook, and Forecast 2024–2033
The Renewable Methanol Market is segmented as follows:
By Feedstock
- Agriculture Waste
- Municipal Waste
- Renewable Energy
- Others
By Application
- Gasoline
- Formaldehyde
- MTBE
- Dimethyl Ether
- MTO
- Acetic Acid
- Others
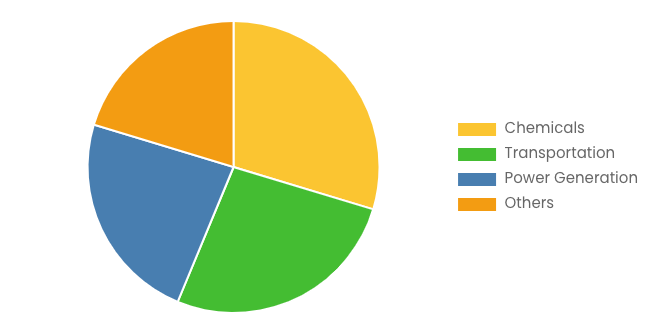
By End Use
- Chemicals
- Transportation
- Power Generation
- Others
Click Here to Get a Free Sample Report of the Global Renewable Methanol Market @ https://www.custommarketinsights.com/report/renewable-methanol-market/
Regional Coverage:
North America
- U.S.
- Canada
- Mexico
- Rest of North America
Europe
- Germany
- France
- U.K.
- Russia
- Italy
- Spain
- Netherlands
- Rest of Europe
Asia Pacific
- China
- Japan
- India
- New Zealand
- Australia
- South Korea
- Taiwan
- Rest of Asia Pacific
The Middle East & Africa
- Saudi Arabia
- UAE
- Egypt
- Kuwait
- South Africa
- Rest of the Middle East & Africa
Latin America
- Brazil
- Argentina
- Rest of Latin America
This Renewable Methanol Market Research/Analysis Report Contains Answers to the following Questions.
- Which Trends Are Causing These Developments?
- Who Are the Global Key Players in This Renewable Methanol Market? What are Their Company Profile, Product Information, and Contact Information?
- What Was the Global Market Status of the Renewable Methanol Market? What Was the Capacity, Production Value, Cost and PROFIT of the Renewable Methanol Market?
- What Is the Current Market Status of the Renewable Methanol Industry? What’s Market Competition in This Industry, Both Company and Country Wise? What’s Market Analysis of Renewable Methanol Market by Considering Applications and Types?
- What Are Projections of the Global Renewable Methanol Industry Considering Capacity, Production and Production Value? What Will Be the Estimation of Cost and Profit? What Will Be Market Share, Supply and Consumption? What about imports and exports?
- What Is Renewable Methanol Market Chain Analysis by Upstream Raw Materials and Downstream Industry?
- What Is the Economic Impact On Renewable Methanol Industry? What are Global Macroeconomic Environment Analysis Results? What Are Global Macroeconomic Environment Development Trends?
- What Are Market Dynamics of Renewable Methanol Market? What Are Challenges and Opportunities?
- What Should Be Entry Strategies, Countermeasures to Economic Impact, and Marketing Channels for Renewable Methanol Industry?
Click Here to Access a Free Sample Report of the Global Renewable Methanol Market @ https://www.custommarketinsights.com/report/renewable-methanol-market/
Reasons to Purchase Renewable Methanol Market Report
- Renewable Methanol Market Report provides qualitative and quantitative analysis of the market based on segmentation involving economic and non-economic factors.
- Renewable Methanol Market report outlines market value (USD) data for each segment and sub-segment.
- This report indicates the region and segment expected to witness the fastest growth and dominate the market.
- Renewable Methanol Market Analysis by geography highlights the consumption of the product/service in the region and indicates the factors affecting the market within each region.
- The competitive landscape incorporates the market ranking of the major players, along with new service/product launches, partnerships, business expansions, and acquisitions in the past five years of companies profiled.
- Extensive company profiles comprising company overview, company insights, product benchmarking, and SWOT analysis for the major market players.
- The Industry’s current and future market outlook concerning recent developments (which involve growth opportunities and drivers as well as challenges and restraints of both emerging and developed regions.
- Renewable Methanol Market Includes in-depth market analysis from various perspectives through Porter’s five forces analysis and provides insight into the market through Value Chain.
Reasons for the Research Report
- The study provides a thorough overview of the global Renewable Methanol market. Compare your performance to that of the market as a whole.
- Aim to maintain competitiveness while innovations from established key players fuel market growth.
Buy this Premium Renewable Methanol Research Report | Fast Delivery Available – [220+ Pages] @ https://www.custommarketinsights.com/report/renewable-methanol-market/
What does the report include?
- Drivers, restrictions, and opportunities are among the qualitative elements covered in the worldwide Renewable Methanol market analysis.
- The competitive environment of current and potential participants in the Renewable Methanol market is covered in the report, as well as those companies’ strategic product development ambitions.
- According to the component, application, and industry vertical, this study analyzes the market qualitatively and quantitatively. Additionally, the report offers comparable data for the important regions.
- For each segment mentioned above, actual market sizes and forecasts have been given.
Who should buy this report?
- Participants and stakeholders worldwide Renewable Methanol market should find this report useful. The research will be useful to all market participants in the Renewable Methanol industry.
- Managers in the Renewable Methanol sector are interested in publishing up-to-date and projected data about the worldwide Renewable Methanol market.
- Governmental agencies, regulatory bodies, decision-makers, and organizations want to invest in Renewable Methanol products’ market trends.
- Market insights are sought for by analysts, researchers, educators, strategy managers, and government organizations to develop plans.
Request a Customized Copy of the Renewable Methanol Market Report @ https://www.custommarketinsights.com/report/renewable-methanol-market/
About Custom Market Insights:
Custom Market Insights is a market research and advisory company delivering business insights and market research reports to large, small, and medium-scale enterprises. We assist clients with strategies and business policies and regularly work towards achieving sustainable growth in their respective domains.
CMI provides a one-stop solution for data collection to investment advice. The expert analysis of our company digs out essential factors that help to understand the significance and impact of market dynamics. The professional experts apply clients inside on the aspects such as strategies for future estimation fall, forecasting or opportunity to grow, and consumer survey.
Follow Us: LinkedIn | Twitter | Facebook | YouTube
Contact Us:
Joel John
CMI Consulting LLC
1333, 701 Tillery Street Unit 12,
Austin, TX, Travis, US, 78702
USA: +1 801-639-9061
India: +91 20 46022736
Email: support@custommarketinsights.com
Web: https://www.custommarketinsights.com/
Blog: https://www.techyounme.com/
Blog: https://atozresearch.com/
Blog: https://www.technowalla.com/
Blog: https://marketresearchtrade.com/
Buy this Premium Renewable Methanol Research Report | Fast Delivery Available – [220+ Pages] @ https://www.custommarketinsights.com/report/renewable-methanol-market/

© 2024 Benzinga.com. Benzinga does not provide investment advice. All rights reserved.
Martin Midstream Partners Earnings Preview
Martin Midstream Partners MMLP is set to give its latest quarterly earnings report on Wednesday, 2024-10-16. Here’s what investors need to know before the announcement.
Analysts estimate that Martin Midstream Partners will report an earnings per share (EPS) of $-0.03.
The announcement from Martin Midstream Partners is eagerly anticipated, with investors seeking news of surpassing estimates and favorable guidance for the next quarter.
It’s worth noting for new investors that guidance can be a key determinant of stock price movements.
Performance in Previous Earnings
Last quarter the company beat EPS by $0.01, which was followed by a 0.0% drop in the share price the next day.
Here’s a look at Martin Midstream Partners’s past performance and the resulting price change:
| Quarter | Q2 2024 | Q1 2024 | Q4 2023 | Q3 2023 |
|---|---|---|---|---|
| EPS Estimate | 0.08 | 0.07 | -0.04 | |
| EPS Actual | 0.09 | 0.08 | 0.02 | -0.03 |
| Price Change % | 0.0% | -3.0% | 9.0% | -2.0% |
Market Performance of Martin Midstream Partners’s Stock
Shares of Martin Midstream Partners were trading at $4.0 as of October 14. Over the last 52-week period, shares are up 72.0%. Given that these returns are generally positive, long-term shareholders are likely bullish going into this earnings release.
This article was generated by Benzinga’s automated content engine and reviewed by an editor.
Market News and Data brought to you by Benzinga APIs
© 2024 Benzinga.com. Benzinga does not provide investment advice. All rights reserved.
My $100,000 Dividend Portfolio Decision — JEPI, SPYI, Or XYLD
- So far in 2024, SPYI has offered a higher yield at 8.9% against JEPI’s 5.1% and XYLD’s 6.9%.
- Both XYLD and SPYI benefit from more favorable tax treatment due to Section 1256 contracts, which could mean more net income after taxes compared to JEPI.
- JEPI has delivered a total return of 13.3% during the first nine months of 2024 — capturing only 58% of the S&P 500 Index’s total return.
- If broad market strength continues, SPYI’s strategy seems better positioned due to its out-of-the-money calls and diversified holdings.
- In volatile or declining markets, JEPI’s lower volatility might appeal to those prioritizing principal protection over total return.
Introduction
2024 has been quite the year thus far — especially for income-focused investors.
We saw ETFs like the Amplify CWP Enhanced Dividend Income ETF DIVO and Schwab U.S. Dividend Equity ETF SCHD break out to new all-time-highs — driven by broad-based market breadth. While other riskier ETFs like the Defiance Nasdaq 100 Enhanced Options 0DTE Income ETF QQQY lose -35% of their share price while delivering single-digit total returns year-to-date.
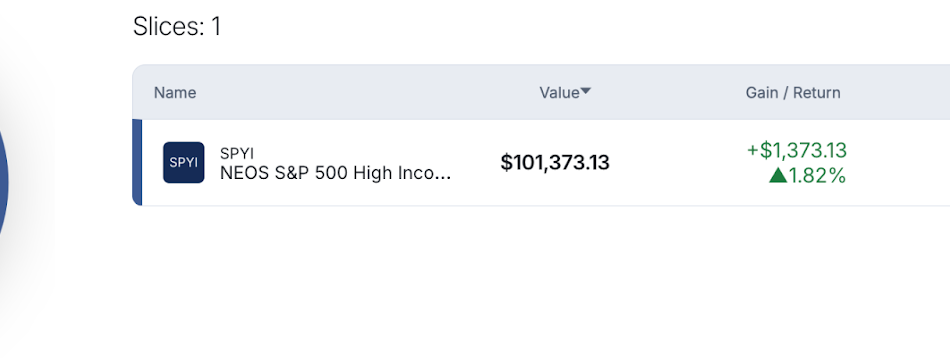
It has never been harder for income-focused investors to balance perceived risk with long-term gains. In this post, I want to share a year-to-date update on my “perfect balance” income-focused ETF that holds over $100K of my hard earned money.
2024 In Review
If you’re an income-focused investor like me, your portfolio is anchored by covered call ETFs that are benchmarked against the total return of the S&P 500. Unfortunately for some investors, 2024 is proving that not every S&P 500 covered call ETF is made equal.
Now before you all come after me with “You can’t compare JEPI to the S&P 500 Index! JEPI doesn’t hold the same stocks, it’s a completely different strategy!”
You’re right. However, the fund’s investment objective as shared in their summary prospectus states the following:
“The investment objective of the Fund is to seek current income while maintaining prospects for capital appreciation.
The Fund seeks to achieve this objective by (1) creating an actively managed portfolio of equity securities comprised significantly of those included in the Fund’s primary benchmark, the Standard & Poor’s 500 Total Return Index (S&P 500 Index)…”
And as shown below on Morningstar, JEPI’s benchmark index is the S&P 500.
Now that we’re all on the same page, let’s dive into the numbers, starting with JEPI.
JPMorgan Equity Premium ETF
The total return of JEPI thus far in 2024 is 13.3%, capturing only 58% of the total return of the S&P 500 Index.
As we all know, the S&P 500 Index was led higher in 2023 by the Magnificent Seven — seven stocks JEPI’s JEPI fund managers understandably decided to leave out of the fund’s holdings. In 2024, however, given the broad-based strength of the market JEPI was able to participate meaningfully more in the continued upside the S&P 500 experienced.
58% total return capture in 2024 is better than the fund’s only 37% total return capture in 2023, but still not enough to excite an income-focused investor also looking for price appreciation.
As stated in the summary prospectus, “The Fund seeks a lower volatility level than the S&P 500 Index.” JEPI certainly achieved this, as the price of their shares only slipped -3.3% during the -7.9% drawdown the S&P 500 experienced between July and August of 2024. And when you add monthly distributions to that figure, risk-averse investors become increasingly happier — a win in my book.
However, it’s equally as important to ask yourself the question “Is the return I see the return I get?“
JEPI uses Equity Linked Notes (ELNs) to generate monthly income for their investors. In the eyes of the IRS, the income generated by these ELNs are taxed as ordinary income — meaning after taxes, this 13.3% figure might be materially lower for some folks depending on their tax brackets.
As a fellow JEPI investor, I’m constantly weighing my opportunity cost. By choosing JEPI over the next best thing, I’m capturing only 58% of the S&P 500’s total return. Sure, I’m doing so in an effort to smooth out the volatility of my portfolio while also generating monthly income — but at the expense of upside potential and higher taxes.
Let’s move on.
Global X S&P 500 Covered Call ETF
The total return of XYLD thus far in 2024 is 13.0%, capturing only 57% of the total return of the S&P 500 Index. XYLD marginally underperformed JEPI by -0.3%, which is weird considering the fund held “all the equity securities in the S&P 500 Index in substantially similar weight.“
But if the fund held all of the constituents of the S&P 500, why did it underperform the index by nearly half?
Unfortunately for my fellow XYLD investors, because the fund wrote at-the-money (ATM) covered calls against their holdings their total upside was capped at just the premium generated by the option contracts.
According to XYLD’s summary prospectus…
“The Fund writes a single “at-the-money” call option, which is when the strike price is near to the market price of the underlying asset, as determined on the monthly option writing date of the Underlying Index in accordance with the Underlying Index methodology.
The Fund’s covered call options may partially protect the Fund from a decline in the price of the Reference Index through means of the premiums received by the Fund. However, when the equity market is rallying rapidly, the Underlying Index is expected to underperform the Reference Index.“
And underperform it did.
However, unlike JEPI, XYLD uses Section 1256 contracts to generate their monthly income for investors. These Section 1256 contracts are treated much more favorably than ELNs in the eyes of the IRS — with income to be taxed as 60% long-term capital gains and 40% short-term, allowing investors to keep more of that 9.7% yield come tax time in April.
NEOS S&P 500 High Income ETF
The total return on SPYI thus far in 2024 is 16.5%, capturing over 72% of the S&P 500 Index’s total return. SPYI SPYI has been able to outperform both XYLD and JEPI in 2024 by 3.5% and 3.2%, respectively. SPYI is able to do this by “investing in a portfolio of stocks that make up the S&P 500 Index,” while also implementing a covered call option strategy that writes covered call option contracts up to 5% out-of-the-money.
Let’s take a look at SPYI’s holdings (as of 10/7/24) to get a better understanding as to why this covered call ETF outperformed its competitors by such a wide margin:
As you can see above, the management team behind SPYI decided to write two covered call option contracts against the S&P 500 expiring on November 11th at the strike prices of 5,840 and 5,910. Assuming these contracts are rolled monthly, something SPYI’s management team has stated in multiple interviews, they were likely written early-October.
The S&P 500 Index was trading around ~5,700 during this time frame — which means their management team wrote these option contracts 2.5% and 3.7% out-of-the-money. These percentage points might not seem like a big deal, but when we have weeks like we did when these contracts were written (new all-time-highs in the S&P 500 Index), writing out-of-the-money contracts vs. at-the-money contracts can really move the needle from a total return perspective.
For added color, below are XYLD’s covered call option contracts (as of 10/7/24) — choosing to write option contracts at the 5,690 strike price. At time of writing, the S&P 500 is 5,750 — which would mean investors in XYLD aren’t capturing any upside beyond 5,690 at the moment.
Similar to XYLD, SPYI uses Section 1256 contracts to generate their monthly income for investors — allowing them to keep more of that 12.11% annual distribution yield in their pockets when Uncle Sam comes knocking.
All in all, SPYI has offered material outperformance against XYLD and JEPI thus far in 2024 — from an income generation, total return, and tax-efficiency perspective.
JEPI has paid out $3.05 per share so far this year, a 5.1% yield against their $59.11 closing price on September 30, 2024. XYLD has paid out $2.88 per share so far this year, a 6.9% yield against their $41.50 closing price on September 30, 2024. SPYI paid out $4.57 per share so far this year, an 8.9% yield against their $51.23 closing price on September 30, 2024.
That’s a 3.8% higher yield than JEPI, and 2.0% higher yield than XYLD.
What Does Q4 Have In Store For Income-Focused Investors?
It’s hard to say.
2023 was dominated by AI, as has been some aspects of 2024. However, I’d argue 2024 — especially after the Fed signaled upcoming rate cuts — was accompanied by broad-based strength as AI-related earnings acceleration by the Mag 7 has lapsed and the “S&P 493” begins to deliver an uptick in earnings growth for the first time since 2021.
Additionally, BofA’s Global Fund Manager Survey tells us that over half of FMS investors say no recession for the US in the next 18-months. Now you can agree or disagree with their assumption — that’s not the point. The point is this is the assumption these money managers are using to position their portfolios.
And as the Fed cuts rates, the most important factor to keep an eye on is if the US economy will avoid a recession or not. If we do, history tells us there’s more upside to be had over the coming 12-24 months. If we do not, these covered call ETFs will become an increasingly larger position in my portfolio as I weather the storm.
Conclusion
As a fellow income-focused investor, I’m always weighing my options in efforts to determine the best possible way to invest my money. At time of writing, I’m not sure JEPI is the answer here.
If markets continue to rally because of broad-based strength, both XYLD and SPYI’s underlying portfolios would likely benefit from their exposure to these types of companies. With that being said, I do acknowledge that XYLD’s option contracts are written at-the-money, while JEPI and SPYI seem to be written slightly out-of-the-money. If markets fall, both XYLD and SPYI offer a higher annualized distribution yield than JEPI, offsetting potential downward pressure on price. If markets rally, fall, trade sideways, or even in circles — both XYLD and SPYI will offer more tax-efficient income for their investors given their Section 1256 contracts.
Based on the factors shared in this analysis, I’ve chosen SPYI to be a six-figure core holding inside of my income-focused portfolio.
Disclaimer:
This is not financial advice or recommendation for any investment. The content is for informational purposes only, you should not construe any such information or other material as legal, tax, investment, financial, or other advice.
Austin Hankwitz is a writer, which means he’s not always right with his predictions or recommendations. Since that also applies to his grammar, please excuse any typos you may find. Also, this article is free: Written and distributed only to assist in research while providing a forum for second-level thinking. In some circumstances, he has a business relationship with a company whose stock is mentioned in this article.
Each investor is responsible to conduct their own due diligence and to understand the risks associated with any information that is reviewed. The information contained herein does not constitute and shouldn’t be construed as a solicitation of advisory services. Consult a registered financial advisor and/or certified financial planner before making any investment decisions.
© 2024 Benzinga.com. Benzinga does not provide investment advice. All rights reserved.
Electric Vehicle Testing, Inspection, and Certification Market Size to Surpass USD 4.15 Billion by 2033 | Straits Research
New York, United States, Oct. 15, 2024 (GLOBE NEWSWIRE) — Electric vehicles were developed to replace conventional modes of transportation that pollute the environment. Electric vehicles have grown in popularity as a result of numerous technological advancements. Electric vehicles (EVs) outperform conventional vehicles in fuel economy, greenhouse gas emissions, ease of home charging, smoother ride, and lower engine noise. Battery, hybrid, and plug-in hybrid electric vehicles are the three types of electric vehicles. In addition, electric vehicles do not require oil changes, but they are marginally more expensive than gasoline-powered vehicles. Installation and system integration of electric vehicles necessitates stringent safety checks. Testing, inspection, and certification of electric vehicles are prominent service factors for the development of electric vehicles and a crucial step for the advancement of automakers and suppliers.
Download Free Sample Report PDF @ https://straitsresearch.com/report/electric-vehicle-testing-inspection-and-certification-market/request-sample
Market Dynamics
Growing Numbers of Electric Vehicles Worldwide Drive the Global Market
The escalating environmental concerns and the negative impact of conventional vehicles have opened the market to alternative vehicles. EVs are predicted to have a bright future, and the price of batteries, one of the essential components of an EV, is expected to drop significantly over time, making them more affordable. Automakers are anticipated to make substantial investments to meet the rising demand for electric vehicles and play a crucial role in market expansion. The deployment of electric vehicles will be boosted by factors such as increased fuel economy, low carbon emissions and maintenance, the convenience of charging at home, a smoother ride, and reduced engine noise. The rate at which electric vehicle manufacturers introduce new EV models is accelerating.
Increased Demand for Electric Vehicle Testing, Inspection, and Certification in Emerging Economies Creates Tremendous Opportunities
The competitive landscape of the global market is highly fragmented, with a large number of key players. According to the SR report, intense competition will be among the world’s leading companies for a larger market share. In order to increase their market share, businesses will be compelled to employ aggressive marketing and business strategies, such as mergers and acquisitions. Emerging economies like China and India will likely present businesses with lucrative opportunities. In addition, the market in these developing nations is extremely promising. The quantity of goods exported from these countries to developed nations has increased dramatically in recent years. The middle-class populations of Britain, Russia, India, China, and South Africa (BRICS) are experiencing rapid economic growth, and as a result, they require high-quality resources with appropriate certifications.
Regional Analysis
Europe is the most significant global electric vehicle testing, inspection, and certification market shareholder and is estimated to exhibit a CAGR of 13.94% during the forecast period. The need for testing, inspection, and certification in this region is primarily driven by the government’s increasing mandates for certification and enforcement to sell and the growing consumer awareness of quality requirements. Recent safety scandals involving Volkswagen, BMW, and Daimler demonstrate the need for independent testing and certification facilities. Companies have not only imposed more stringent rules and requirements but have also increased their reliance on a third party for evaluation, allowing independent testing, inspection, and certification businesses to flourish in the region. Several automotive OEMs are headquartered in Europe, including Volkswagen Group, Groupe PSA, Bayerische Motoren Werke AG, Fiat Chrysler Automobiles, Volvo, and Daimler AG.
North America is anticipated to exhibit a CAGR of 11.93% over the forecast period. Emerging technology and strict environmental standards altered the entire industry’s outlook for enforcing regional requirements and regulations. In addition, the rising demand for periodic inspection and testing of electric vehicles is anticipated to boost the market. Bureau Veritas, an international leader in testing, inspection, and certification facilities, intended to hire more engineers, surveyors, regulators, auditors, laboratory technicians, and company support personnel in 2020. The company intends to hire over 2,000 individuals in the United States. It is anticipated that the national availability of testing, inspection, and certification services will increase.
To Gather Additional Insights on the Regional Analysis of the Electric Vehicle Testing, Inspection, and Certification Market @ https://straitsresearch.com/report/electric-vehicle-testing-inspection-and-certification-market/request-sample
Key Highlights
- Based on application, the global electric vehicle testing, inspection, and certification market is bifurcated into safety and security, connectors, communication, and EV charging. The safety and security segment dominates the global market and is projected to exhibit a CAGR of 14.23% over the forecast period.
- Based on service type, the global electric vehicle testing, inspection, and certification market is bifurcated into testing, inspection, and certification. The testing segment owns the highest market share and is anticipated to grow at a CAGR of 15.03% over the forecast period.
- Based on source, the global electric vehicle testing, inspection, and certification market is divided into in-house and outsourcing. The outsourcing segment is the most significant contributor to the market and is anticipated to exhibit a CAGR of 14.95% over the forecast period.
- Europe is the most significant global electric vehicle testing, inspection, and certification market shareholder and is estimated to exhibit a CAGR of 13.94% during the forecast period.
Competitive Players
- DEKRA SE
- SGS Group
- TUV SUD
- Bureau Veritas S.A.
- Applus Services S.A.
- Intertek Group PLC
- British Standards Institution
- Eurofins Scientific
- Rina S.P.A.
- Norges Elektriske Materiellkontroll
- TUV Rheinland Group
- NSF International
- UL LLC
- Lloyd’sLloyd’s Register Group Limited
- Element Materials Technology
Recent Developments
- March 2023- UL Solutions revealed plans to establish a new battery testing laboratory in Auburn Hills, Michigan, in the middle of 2024. The facility will be one of North America’s most comprehensive battery testing and engineering laboratories.
- January 2023- Contemporary Amperex Technology Co., Limited (CATL), along with UL Solutions, entered into a Memorandum of Understanding (MoU) for strategic cooperation to promote the deployment and use of battery energy storage systems (BESS) and electric vehicle (EV) batteries more securely.
Segmentation
- By Applications
- Safety and Security
- Connectors
- Communication
- EV Charging
- By Service Type
- Testing
- Inspection
- Certification
- By Sourcing
- In-House
- Outsourcing
- By Region
- North America
- Europe
- Asia Pacific
- Latin America
- Middle East and Africa
Get Detailed Market Segmentation @ https://straitsresearch.com/report/electric-vehicle-testing-inspection-and-certification-market/segmentation
About Straits Research Pvt. Ltd.
Straits Research is a market intelligence company providing global business information reports and services. Our exclusive blend of quantitative forecasting and trends analysis provides forward-looking insight for thousands of decision-makers. Straits Research Pvt. Ltd. provides actionable market research data, especially designed and presented for decision making and ROI.
Whether you are looking at business sectors in the next town or crosswise over continents, we understand the significance of being acquainted with the client’s purchase. We overcome our clients’ issues by recognizing and deciphering the target group and generating leads with utmost precision. We seek to collaborate with our clients to deliver a broad spectrum of results through a blend of market and business research approaches.
For more information on your target market, please contact us below:
Phone: +1 646 905 0080 (U.S.)
+91 8087085354 (India)
+44 203 695 0070 (U.K.)
Email: sales@straitsresearch.com
Follow Us: LinkedIn | Facebook | Instagram | Twitter

© 2024 Benzinga.com. Benzinga does not provide investment advice. All rights reserved.
Silica Flour Market Size Expected to Hit USD 1.3 Billion by 2031 with 5% CAGR, as Applications in Additives and Industrial Coatings Expand: Transparency Market Research
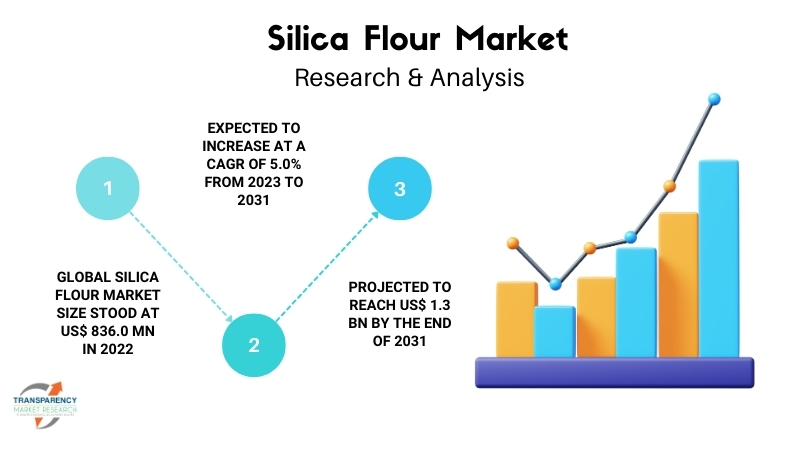
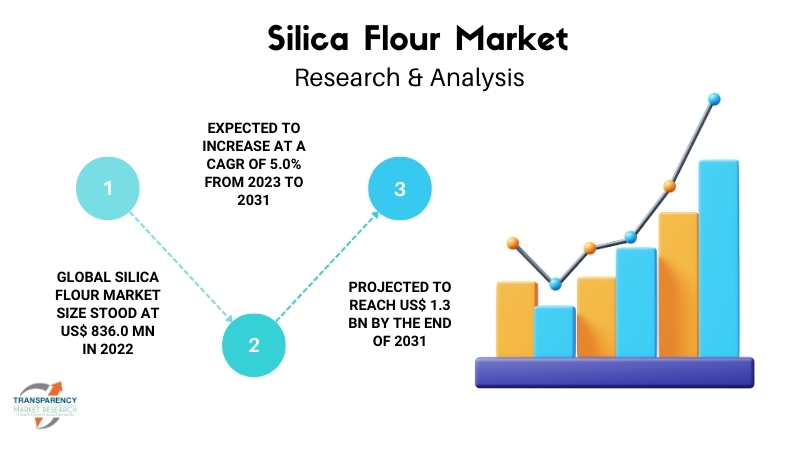
Wilmington, Delaware, United States, Transparency Market Research, Inc. , Oct. 15, 2024 (GLOBE NEWSWIRE) — The global Silica flour’s market size (سوق دقيق السيليكا) was estimated at US$ 836.0 million in 2022. A CAGR of 5.0% is predicted between 2023 and 2031, reaching US$ 1.3 billion by 2031. The robustness, durability, and resistance to corrosion and chemical attacks of silica flour make it an appealing choice for use in cementitious materials, concrete, and grouts, leading to a rapid market expansion.
The oil and gas industry relies heavily on silica flour during hydraulic fracturing, or fracking, because it holds open cracks and improves oil and gas flow from reservoirs.
Silica flour is used extensively in the glass manufacturing industry to manufacture specialized glasses, fiberglass, bottles, and other glassware. In addition to improving clarity and strength, silica flour increases the thermal resistance of glass. Paint and coatings manufacturers use silica flour more frequently than ever since it improves coating durability, adhesion, and resistance to weathering and abrasion, driving market growth.
Download Sample PDF Brochure: https://www.transparencymarketresearch.com/sample/sample.php?flag=S&rep_id=6988
Due to its ability to facilitate metal casting processes, silica flour is a primary market driver for foundries. As technology advances in silica flour production, such as particle size control and refining procedures, silica flour’s range of applications and performance attributes expand, supporting product innovation, quality enhancements, and market expansion.
Key Players Profiled
- Premier Silica LLC
- Silica International
- U.S. Silica
- Sil Industrial Minerals
- Adwan Chemical Industries Co. Ltd.
- Delmon Group of Companies
- Opta Minerals Inc.
- AI Marbaie Group
- Saudi Emirates Pulverization Industries Company (SEPICO)
Key Findings of the Market Report
- In terms of application, fiberglass accounted for the majority of shares in 2022
- Over the next few years, the Asia Pacific region is expected to dominate the market.
- Silica flour market dynamics in North America are expected to be positively impacted by the expansion of oil & gas and paints & coatings sectors.
- Fiberglass in concrete structures is expected to be in high demand due to the growing construction sector.
Global Silica Flour Market: Growth Drivers
- A growing field of study called nanotechnology has several uses for silica nanoparticles. Nanotechnology applications, including electronics, drug delivery systems, sensors, and nanocomposites, may heavily rely on silica flour. Due to ongoing nanotechnology research and development, the need for silica flour may increase.
- With the growing awareness of environmental issues, companies are looking for sustainable substitutes for traditional materials. A low-emissions manufacturing process and responsible sourcing of silica flour could make silica flour a desirable option in various applications.
- The future of the silica flour industry could be influenced by workplace safety and health laws, environmental protection policies, and product quality regulations. Innovation and investment in sustainable practices may be driven by compliance with regulations and standards.
- Silica flour is used in the chemical industry to make silicon compounds, specialty chemicals, and catalysts. As a reinforcing filler in polymer formulations and an anti-blocking agent in plastics and rubber, silica flour is in demand. Plastic and rubber products benefit from silica flour because it enhances mechanical properties, dimensional stability, and processing characteristics.
Global Silica Flour Market: Regional Landscape
- Silica flour is experiencing rapid growth in the Asia Pacific region. In China, several industries have increased their consumption of silica flour in recent years, including the electronics, cement, and glass industries. Ceramics and glasses are also gaining popularity among consumers, contributing to the market’s growth. In addition, demand for casting products has surged in the automotive and semiconductor sectors in China, thus further boosting silica flour consumption.
- The rapid increase in infrastructure investments throughout the Asia-Pacific region has contributed to this growth. Adding silica flour in paint manufacturing creates uniformity and enables new applications, including oil-based paints and coatings, where uniformity and suitability matter.
- Ceramics are gaining traction in this sector, especially in developing economies in Asia Pacific, and thus, silica flour is expected to gain traction in the construction industry. It is also used in aerospace and semiconductor industries as a starting material for optical fiber production.
Unlock Growth Potential in Your Industry! Download PDF Brochure: https://www.transparencymarketresearch.com/sample/sample.php?flag=S&rep_id=6988
Global Silica Flour Market: Competitive Landscape
The global silica flour industry is highly consolidated, with several major players accounting for major market shares. To consolidate their position in the global market, leading silica flour suppliers and manufacturers focus on acquiring smaller entities.
Key Developments
- Premier Silica LLC- produces silica sand products for oil and gas fracking, glass making, foundry molds, filtration, and more. Several mining and processing facilities are operated by the company across the country, ensuring customers receive high-quality silica products regularly.
- Silica International supplies silica products to various industries, including automotive, electronics, construction, and consumer goods. As a leading provider of silica-based materials, the company is prepared to provide customers with customized materials tailored to their specific needs, including silica flour, silica gel, silica fume, and colloidal silica.
- U.S. Silica- major producer of hydraulic fracturing (fracking) silica sand for the oil and gas industry. Along with manufacturing and selling fracking sand, the company also sells glassmaking, building, chemical manufacturing, recreation, and industrial silica products. U.S. Silica operates North American mines and processing plants.
Global Silica Flour Market: Segmentation
Application
- Sodium Silicate
- Fiberglass
- Cultured Marble
- Reinforcing Fillers (Plastics, Rubbers, Paints & Coatings, etc.)
- Foundry Work
- Ceramic Frits & Glaze
- Oil Well Cement
- Glass & Clay Production
- Others (Pharmaceuticals, etc.)
Region
- North America
- Europe
- Asia Pacific
- Latin America
- Middle East & Africa
Purchase the Report for Market-Driven Insights: https://www.transparencymarketresearch.com/checkout.php?rep_id=6988<ype=S
Have a Look at More Valuable Insights of Chemicals And Materials
- Copper Market: The copper pipes & tubes market (سوق أنابيب وأنابيب النحاس) was valued at US$ 32.1 billion in 2021. A CAGR of 3.1% is projected from 2022 to 2031. By the end of 2031, the global copper pipes and tubes market is expected to reach US$ 44 billion.
- High Purity Alumina Market: The high purity alumina market (سوق الألومينا عالية النقاء) is anticipated to rise at a CAGR of 15.1% during 2022 to 2031. In 2021, the market was valued at US$ 2 Bn.
- Nickel Alloy Welding Consumables Market – The global nickel alloy welding consumables market (سوق المواد الاستهلاكية لحام سبائك النيكل) is estimated to grow at a CAGR of 5.4% from 2023 to 2031 and reach US$ 6.9 Billion by the end of 2031.
- Expanded Perlite Market – The global expanded perlite market (توسيع سوق البيرلايت) is expected to grow at a CAGR of 7.6% from 2023 to 2031 and reach US$ 1.7 Billion by the end of 2031.
About Transparency Market Research
Transparency Market Research, a global market research company registered at Wilmington, Delaware, United States, provides custom research and consulting services. Our exclusive blend of quantitative forecasting and trends analysis provides forward-looking insights for thousands of decision makers. Our experienced team of Analysts, Researchers, and Consultants use proprietary data sources and various tools & techniques to gather and analyses information.
Our data repository is continuously updated and revised by a team of research experts, so that it always reflects the latest trends and information. With a broad research and analysis capability, Transparency Market Research employs rigorous primary and secondary research techniques in developing distinctive data sets and research material for business reports.
Contact:
Transparency Market Research Inc.
CORPORATE HEADQUARTER DOWNTOWN,
1000 N. West Street,
Suite 1200, Wilmington, Delaware 19801 USA
Tel: +1-518-618-1030
USA – Canada Toll Free: 866-552-3453
Website: https://www.transparencymarketresearch.com
Email: sales@transparencymarketresearch.com
Follow Us: LinkedIn| Twitter| Blog | YouTube

Market News and Data brought to you by Benzinga APIs
© 2024 Benzinga.com. Benzinga does not provide investment advice. All rights reserved.
Chinese E-Commerce Firms Alibaba, JD, PDD Gear Up For Singles' Day Shopping Festival
Alibaba Group Holding BABA and other Chinese e-commerce stocks listed in the U.S. continued to see a volatile session Tuesday as the fiscal stimulus by China failed to impress investors.
China’s economy has been battling weak growth, further escalated the domestic crackdown on the hyperscalars.
As the Chinese companies started recuperating from the crackdown, the U.S. launched its semiconductor sanctions on the country, depriving it of advanced artificial intelligence technology and reducing its dependence on the country by consolidating its semiconductor base.
Also Read: Alibaba’s Lazada Courts Armani and Other Luxury Brands, Seeks Edge Over Rivals in Southeast Asia
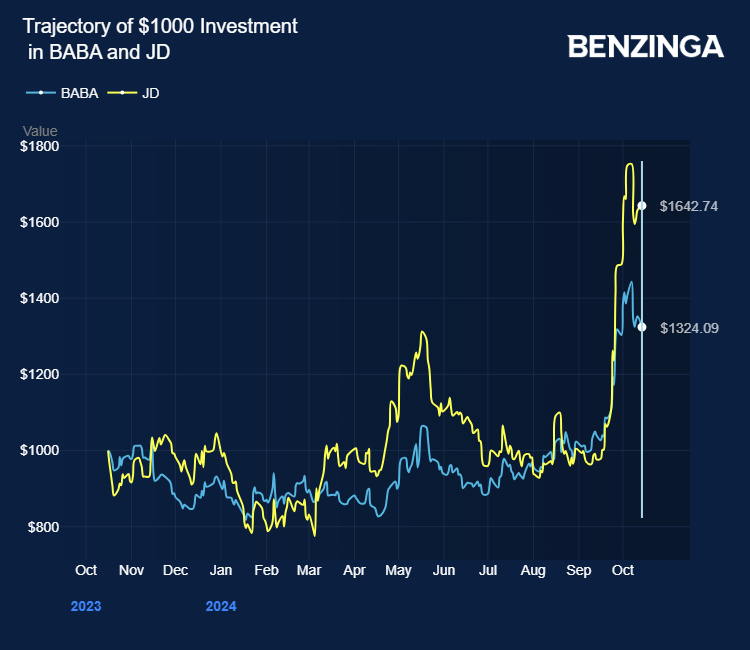
Chinese e-commerce companies, including JD.com, Inc. JD and PDD Holdings Inc. PDD, continued their downward trajectory on Tuesday.
Reportedly, China is weighing a fiscal stimulus of 6 trillion yuan, or $850 billion, in ultra-long special treasury bonds over the next three years to drive the economy.
Prior reports indicated that China’s central bank planned to slash banks’ reserve requirement ratio (RRR) by 50 basis points or half a percentage point and reduce the seven-day reverse repurchase rate to 1.5% from 1.7% to spur domestic spending.
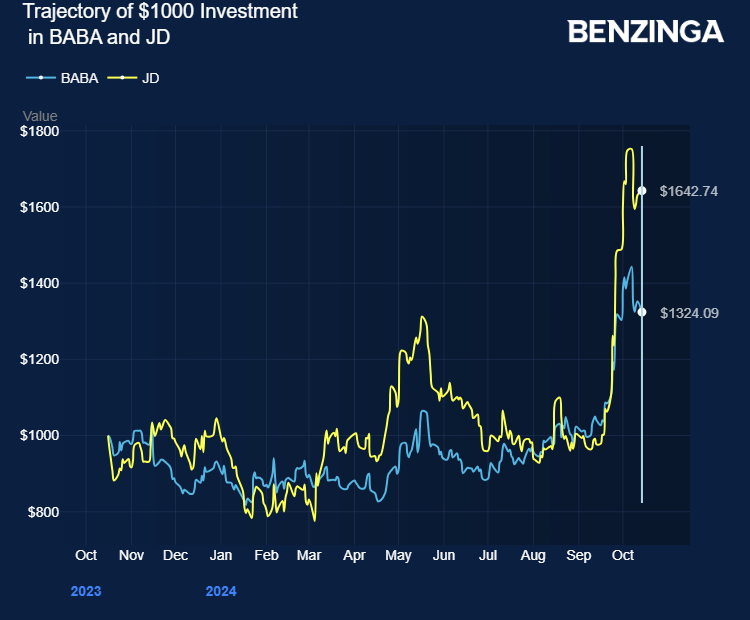
Reportedly, China’s stimulus package on September 24 restored over $3 trillion in market value to Chinese stocks trading in global markets. Alibaba, JD.com, and PDD stocks gained 29%-68% in the last 30 days.
Alibaba, JD.com, and PDD have officially started their promotions for the upcoming Singles’ Day shopping festival as the stimulus reports do the rounds.
The annual festival, which takes place on November 11, launched earlier than previous years in 2024, SCMP reports.
Alibaba launched its presale event on October 16, with at least 50% discounts and free nationwide shipping available across its platforms. JD.com and PDD have also rolled out their Singles’ Day promotions on the same day.
Alibaba has committed over $5.7 billion in resources to bolster its platforms during the event. JD.com has introduced price cuts on over a billion products, with significant discounts on high-ticket items.
Price Actions: At the last check on Tuesday, BABA stock was down 4.17% to $103.31. JD is down 7.68%, PDD is down 5.44%.
Also Read:
Image by Tada Images via Shutterstock
This content was partially produced with the help of AI tools and was reviewed and published by Benzinga editors.
Market News and Data brought to you by Benzinga APIs
© 2024 Benzinga.com. Benzinga does not provide investment advice. All rights reserved.
MINTO APARTMENT REIT ANNOUNCES OCTOBER 2024 CASH DISTRIBUTION
OTTAWA, ON, Oct. 15, 2024 /CNW/ – Minto Apartment Real Estate Investment Trust (the “REIT”) MI today announced a cash distribution of $0.04208 per REIT unit for the month of October 2024, representing $0.505 per REIT unit on an annualized basis. Payment will be made on November 15, 2024 to unitholders of record as at October 31, 2024.
About Minto Apartment Real Estate Investment Trust
Minto Apartment Real Estate Investment Trust is an unincorporated, open-ended real estate investment trust established pursuant to a declaration of trust under the laws of the Province of Ontario to own income-producing multi-residential properties located in urban markets in Canada. The REIT owns a portfolio of high-quality income-producing multi-residential rental properties located in Toronto, Montreal, Ottawa and Calgary. For more information on Minto Apartment REIT, please visit the REIT’s website at: https://www.mintoapartmentreit.com.
Forward-Looking Statements
This news release may contain forward-looking statements (within the meaning of applicable securities laws) relating to the business of the REIT. Forward-looking statements are identified by words such as “believe”, “anticipate”, “project”, “expect”, “intend”, “plan”, “will”, “may”, “estimate” and other similar expressions. These statements are based on the REIT’s expectations, estimates, forecasts and projections and include, without limitation, statements regarding the intended monthly distributions of the REIT. The forward-looking statements in this news release are based on certain assumptions, including without limitation that the REIT will have sufficient cash to pay its distributions. They are not guarantees of future performance and involve risks and uncertainties that are difficult to control or predict. A number of factors could cause actual results to differ materially from the results discussed in the forward-looking statements, including, but not limited to, the factors discussed and referenced under the heading “Risks and Uncertainties” in the REIT’s Q2 2024 management’s discussion and analysis dated August 13, 2024, which is available at www.sedarplus.ca. There can be no assurance that forward-looking statements will prove to be accurate as actual outcomes and results may differ materially from those expressed in these forward-looking statements. Readers, therefore, should not place undue reliance on any such forward-looking statements. Further, these forward-looking statements are made as of the date of this news release and, except as expressly required by applicable law, the REIT assumes no obligation to publicly update or revise any forward-looking statement, whether as a result of new information, future events or otherwise.
SOURCE Minto Apartment Real Estate Investment Trust

![]() View original content to download multimedia: http://www.newswire.ca/en/releases/archive/October2024/15/c4419.html
View original content to download multimedia: http://www.newswire.ca/en/releases/archive/October2024/15/c4419.html
Market News and Data brought to you by Benzinga APIs
© 2024 Benzinga.com. Benzinga does not provide investment advice. All rights reserved.
Preview: Triumph Financial's Earnings
Triumph Financial TFIN is gearing up to announce its quarterly earnings on Wednesday, 2024-10-16. Here’s a quick overview of what investors should know before the release.
Analysts are estimating that Triumph Financial will report an earnings per share (EPS) of $0.21.
Triumph Financial bulls will hope to hear the company announce they’ve not only beaten that estimate, but also to provide positive guidance, or forecasted growth, for the next quarter.
New investors should note that it is sometimes not an earnings beat or miss that most affects the price of a stock, but the guidance (or forecast).
Earnings History Snapshot
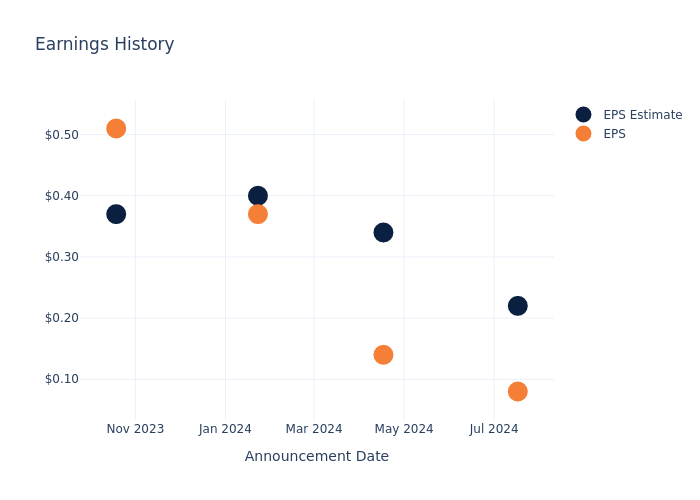
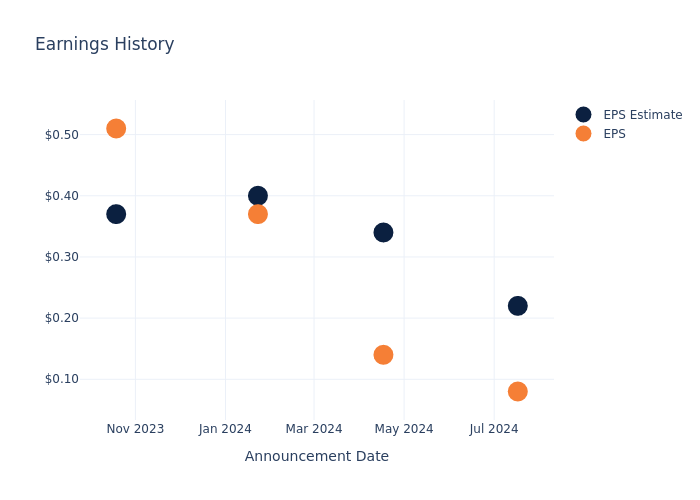
Last quarter the company missed EPS by $0.14, which was followed by a 12.04% drop in the share price the next day.
Here’s a look at Triumph Financial’s past performance and the resulting price change:
| Quarter | Q2 2024 | Q1 2024 | Q4 2023 | Q3 2023 |
|---|---|---|---|---|
| EPS Estimate | 0.22 | 0.34 | 0.40 | 0.37 |
| EPS Actual | 0.08 | 0.14 | 0.37 | 0.51 |
| Price Change % | -12.0% | -8.0% | -4.0% | 6.0% |
Stock Performance
Shares of Triumph Financial were trading at $78.9 as of October 14. Over the last 52-week period, shares are up 36.1%. Given that these returns are generally positive, long-term shareholders should be satisfied going into this earnings release.
To track all earnings releases for Triumph Financial visit their earnings calendar on our site.
This article was generated by Benzinga’s automated content engine and reviewed by an editor.
Market News and Data brought to you by Benzinga APIs
© 2024 Benzinga.com. Benzinga does not provide investment advice. All rights reserved.

