Jim Cramer Says 'I'm Worried' About Boeing After Plane Maker Lays Off 17,000 Employees Amid Safety And Financial Woes
Benzinga and Yahoo Finance LLC may earn commission or revenue on some items through the links below.
Jim Cramer expressed his concerns regarding Boeing Co.’s (NYSE:BA) financial health after the plane maker announced plans to lay off 17,000 employees in the wake of ongoing safety issues and worker strikes.
Don’t Miss Out:
What Happened: Cramer, in CNBC‘s Lightning Round on Saturday, voiced his worries about Boeing’s financial situation, stating, “I’m worried…The balance sheet’s not great, and they should have raised capital when they had a chance to.”
“This was a very jarring series of news tonight, and I don’t have any conviction whatsoever that they are getting this right,” he added.
Trending Now: This billion-dollar fund has invested in the next big real estate boom, here’s how you can join for $10.
This is a paid advertisement. Carefully consider the investment objectives, risks, charges and expenses of the Fundrise Flagship Fund before investing. This and other information can be found in the Fund’s prospectus. Read them carefully before investing.
Boeing’s CEO, Kelly Ortberg, disclosed the impending job cuts in an email to staff. The layoffs, which will affect a range of employees including executives and managers, represent about 10% of the company’s workforce and will be implemented over the coming months.
Why It Matters: The aerospace giant has been grappling with a series of challenges this year. In January, its 737 Max planes were grounded following a mid-flight incident. In July, Boeing admitted guilt in crashes involving the 737 Max in 2018 and 2019, which resulted in over 300 fatalities.
Further complications arose with Boeing’s Starliner spacecraft, which returned from the International Space Station in September without astronauts due to technical issues. Additionally, nearly 33,000 Boeing factory workers have been on strike since mid-September, further complicating the company’s situation.
Ortberg stressed the need for the layoffs to align with Boeing’s financial reality and future recovery plans. The delivery of the first 777X airplane has now been postponed to 2026, as stated in Ortberg’s memo.
Wondering if your investments can get you to a $5,000,000 nest egg? Speak to a financial advisor today. SmartAsset’s free tool matches you up with up to three vetted financial advisors who serve your area, and you can interview your advisor matches at no cost to decide which one is right for you.
Keep Reading:
This article Jim Cramer Says ‘I’m Worried’ About Boeing After Plane Maker Lays Off 17,000 Employees Amid Safety And Financial Woes originally appeared on Benzinga.com
Altair Engineering 10% Owner Trades $9.52M In Company Stock
It was reported on October 15, that GC Investments LLC, 10% Owner at Altair Engineering ALTR executed a significant insider sell, according to an SEC filing.
What Happened: A Form 4 filing from the U.S. Securities and Exchange Commission on Tuesday showed that LLC sold 100,000 shares of Altair Engineering. The total transaction amounted to $9,523,390.
During Tuesday’s morning session, Altair Engineering shares down by 0.0%, currently priced at $95.5.
Unveiling the Story Behind Altair Engineering
Altair Engineering Inc is a provider of enterprise-class engineering software enabling origination of the entire product lifecycle from concept design to in-service operation. The integrated suite of software provided by the company optimizes design performance across multiple disciplines encompassing structures, motion, fluids, thermal management, system modeling, and embedded systems. It operates through two segments: Software which includes the portfolio of software products such as solvers and optimization technology products, modeling and visualization tools, industrial and concept design tools, and others; and Client Engineering Services which provides client engineering services to support customers. Majority of its revenue comes from the software segment.
Altair Engineering: A Financial Overview
Revenue Growth: Altair Engineering’s remarkable performance in 3 months is evident. As of 30 June, 2024, the company achieved an impressive revenue growth rate of 5.41%. This signifies a substantial increase in the company’s top-line earnings. As compared to competitors, the company encountered difficulties, with a growth rate lower than the average among peers in the Information Technology sector.
Navigating Financial Profits:
-
Gross Margin: The company excels with a remarkable gross margin of 79.49%, indicating superior cost efficiency and profitability compared to its industry peers.
-
Earnings per Share (EPS): Altair Engineering’s EPS is below the industry average. The company faced challenges with a current EPS of -0.06. This suggests a potential decline in earnings.
Debt Management: Altair Engineering’s debt-to-equity ratio is below the industry average. With a ratio of 0.33, the company relies less on debt financing, maintaining a healthier balance between debt and equity, which can be viewed positively by investors.
Financial Valuation:
-
Price to Earnings (P/E) Ratio: Altair Engineering’s current Price to Earnings (P/E) ratio of 298.62 is higher than the industry average, indicating that the stock may be overvalued according to market sentiment.
-
Price to Sales (P/S) Ratio: The current P/S ratio of 12.84 is above industry norms, reflecting an elevated valuation for Altair Engineering’s stock and potential overvaluation based on sales performance.
-
EV/EBITDA Analysis (Enterprise Value to its Earnings Before Interest, Taxes, Depreciation & Amortization): Altair Engineering’s EV/EBITDA ratio, surpassing industry averages at 95.97, positions it with an above-average valuation in the market.
Market Capitalization Analysis: The company exhibits a lower market capitalization profile, positioning itself below industry averages. This suggests a smaller scale relative to peers.
Now trade stocks online commission free with Charles Schwab, a trusted and complete investment firm.
Uncovering the Importance of Insider Activity
It’s important to note that insider transactions alone should not dictate investment decisions, but they can provide valuable insights.
Within the legal framework, an “insider” is defined as any officer, director, or beneficial owner holding more than ten percent of a company’s equity securities as per Section 12 of the Securities Exchange Act of 1934. This includes executives in the c-suite and major hedge funds. These insiders are mandated to disclose their transactions through a Form 4 filing, to be submitted within two business days of the transaction.
The initiation of a new purchase by a company insider serves as a strong indication that they expect the stock to rise.
However, insider sells may not always signal a bearish view and can be influenced by various factors.
Transaction Codes To Focus On
When dissecting transactions, the focal point for investors is often those occurring in the open market, meticulously detailed in Table I of the Form 4 filing. A P in Box 3 denotes a purchase, while S signifies a sale. Transaction code C indicates the conversion of an option, and transaction code A denotes a grant, award, or other acquisition of securities from the company.
Check Out The Full List Of Altair Engineering’s Insider Trades.
Insider Buying Alert: Profit from C-Suite Moves
Benzinga Edge reveals every insider trade in real-time. Don’t miss the next big stock move driven by insider confidence. Unlock this ultimate sentiment indicator now. Click here for access.
This article was generated by Benzinga’s automated content engine and reviewed by an editor.
Market News and Data brought to you by Benzinga APIs
© 2024 Benzinga.com. Benzinga does not provide investment advice. All rights reserved.
First Community Earnings Preview
First Community FCCO is gearing up to announce its quarterly earnings on Wednesday, 2024-10-16. Here’s a quick overview of what investors should know before the release.
Analysts are estimating that First Community will report an earnings per share (EPS) of $0.44.
Investors in First Community are eagerly awaiting the company’s announcement, hoping for news of surpassing estimates and positive guidance for the next quarter.
It’s worth noting for new investors that stock prices can be heavily influenced by future projections rather than just past performance.
Performance in Previous Earnings
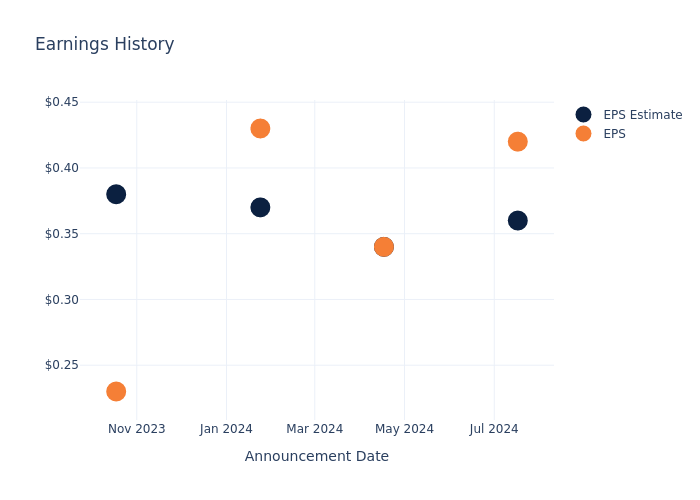
During the last quarter, the company reported an EPS beat by $0.06, leading to a 2.01% drop in the share price on the subsequent day.
Here’s a look at First Community’s past performance and the resulting price change:
| Quarter | Q2 2024 | Q1 2024 | Q4 2023 | Q3 2023 |
|---|---|---|---|---|
| EPS Estimate | 0.36 | 0.34 | 0.37 | 0.38 |
| EPS Actual | 0.42 | 0.34 | 0.43 | 0.23 |
| Price Change % | -2.0% | 0.0% | 4.0% | -1.0% |
Stock Performance
Shares of First Community were trading at $21.3 as of October 14. Over the last 52-week period, shares are up 21.35%. Given that these returns are generally positive, long-term shareholders are likely bullish going into this earnings release.
To track all earnings releases for First Community visit their earnings calendar on our site.
This article was generated by Benzinga’s automated content engine and reviewed by an editor.
Market News and Data brought to you by Benzinga APIs
© 2024 Benzinga.com. Benzinga does not provide investment advice. All rights reserved.
1 Stock-Split Stock to Buy Hand Over Fist in October and 1 to Avoid
A continually rising share price is generally a good thing. However, that price can eventually get so high that individual investors can’t afford to accumulate company shares. To rectify this, companies sometimes perform stock splits, which lower the share price by proportionately increasing the number of shares on the market.
It’s a sign that a company has enjoyed prolonged success, and the lower share price often attracts investors, even though a split doesn’t change anything about the stock’s fundamental valuation or its per-share financials.
Earlier this year, Chipotle Mexican Grill (NYSE: CMG) and Williams-Sonoma (NYSE: WSM) performed respective 50-for-1 and 2-for-1 stock splits.
Ironically, neither stock has done well since splitting back over the summer. That said, one stands out as a buy, while investors are probably better off avoiding the other for now.
A management shake-up and strong growth outlook make this popular restaurant stock an obvious buy
Chipotle is a straightforward business with an eye-popping history of success. The casual dining chain sells Mexican inspired cuisine using fresh ingredients, and its popularity has fueled steady store expansion over the years. Since 2006, the stock has returned a mouth-watering 6,590%, trouncing the return of the S&P 500 index. Chipotle’s beauty lies in its simplicity. The product menu is simple, consisting of a handful of proteins and sides, served in a few form factors, such as burritos, bowls, or salads.
The company is profitable, generating $1.3 billion in free cash flow over the past four quarters, on $10.66 billion in sales. Management funds store expansion with some of Chipotle’s profits and repurchases stock with the rest, further boosting earnings growth. Chipotle’s split-adjusted share count has decreased nearly 12% over the past decade, while earnings per share have increased 262%. The great thing about Chipotle is that it still has just 3,146 stores, primarily located in the United States. It can continue opening stores and repurchasing stock for the foreseeable future.
Recently, Chipotle’s CEO Brian Niccol abruptly left the company to join Starbucks. His departure helped contribute to the stock’s lackluster post-split performance.
Market-beating stocks are seldom cheap, so it could be wise to snatch up Chipotle while it’s trading at a reasonable price. Analysts believe Chipotle will grow earnings by an average of 22% annually over the long term, making the stock’s forward P/E of 54 digestible for those planning to hold the stock for years since it can grow into its valuation.
Luxury goods aren’t in style while consumers struggle
People with money have seemingly always had a taste for the finer things. Williams-Sonoma is a specialty retailer that sells high-end home goods and furnishings. It operates store brands like Pottery Barn and has a strong e-commerce footprint. The company has been public since the 1980s and has delivered market-beating returns for decades. The stock’s lifetime total returns, between share price appreciation and dividends, exceed 42,000%. This is a company you want to keep in your portfolio.
If so, why should investors avoid the stock? Companies like Williams-Sonoma can struggle when consumers tighten up on discretionary purchases. While a $300 frying pan is probably nice to have, it’s not something most people will buy during tough times. Inflation has eaten away at consumers’ buying power over the past few years. Household savings in the United States are near multiyear lows, and credit card debt is at all-time highs. That’s not conducive to luxury purchases. Williams-Sonoma anticipates a 1.5% to 4% revenue decline in 2024 after lowering guidance in the second quarter.
Williams-Sonoma appears to be a much less expensive stock than Chipotle, at just under 18 times its estimated 2024 earnings. However, it doesn’t look like a better value. Analysts anticipate just over 6% annualized earnings growth over the next three to five years, and it’s hard to know whether that will hold if consumers continue struggling. High-earners can sometimes be resilient spenders, but Williams-Sonoma’s reduced guidance is reason to pause and exercise patience. I still like the company as a long-term stock, but economic turbulence could easily afford investors better buying opportunities in the future.
Should you invest $1,000 in Chipotle Mexican Grill right now?
Before you buy stock in Chipotle Mexican Grill, consider this:
The Motley Fool Stock Advisor analyst team just identified what they believe are the 10 best stocks for investors to buy now… and Chipotle Mexican Grill wasn’t one of them. The 10 stocks that made the cut could produce monster returns in the coming years.
Consider when Nvidia made this list on April 15, 2005… if you invested $1,000 at the time of our recommendation, you’d have $826,069!*
Stock Advisor provides investors with an easy-to-follow blueprint for success, including guidance on building a portfolio, regular updates from analysts, and two new stock picks each month. The Stock Advisor service has more than quadrupled the return of S&P 500 since 2002*.
*Stock Advisor returns as of October 7, 2024
Justin Pope has no position in any of the stocks mentioned. The Motley Fool has positions in and recommends Chipotle Mexican Grill, Starbucks, and Williams-Sonoma. The Motley Fool recommends the following options: short December 2024 $54 puts on Chipotle Mexican Grill. The Motley Fool has a disclosure policy.
1 Stock-Split Stock to Buy Hand Over Fist in October and 1 to Avoid was originally published by The Motley Fool
3 Small-Cap Stocks Ready to Deliver Significant Growth
Small-cap stocks faced a challenging environment for the last several years as inflation and high interest rates dampened lending opportunities. These companies—which are often in the early stages of development and lack stability—rely heavily on debt to fuel their growth.
Fortunately for the small-cap space, the Federal Reserve’s September rate cut of 50 basis points is a welcome relief that should make borrowing more accessible. The fact that the Fed has signaled that additional rate cuts are likely in the months to come makes the coming economic environment look all the more appealing for small-cap companies.
In anticipation of lowered rates, the small-cap-focused Russell 2000 Index is up by more than a quarter in the last year. While the increasingly favorable rate landscape should be a boon to small-caps in general, some companies will benefit more than others. Investors looking to small-cap stocks should consider a range of fundamentals and analyst forecasts.
TZOO: Shift to Paid Model Has Driven Stock Rally
Travelzoo Inc. TZOO provides a variety of websites and mobile apps relating to travel. The firm instituted a $40 annual membership fee at the start of 2024 after previously providing a similar set of services for free. While the shift to a fee-based subscription undoubtedly upset some members, the benefits for the company have so far dramatically outweighed the costs: the firm has yet to see a year-over-year drop in quarterly revenue and maintained more than 30 million members as of the end of the second quarter.
To be sure, Travelzoo has not yet completed its transition to a fee-based service. The company plans to monetize 95% of its existing member base through paid subscriptions by the beginning of 2025. This plan has fueled investor optimism in recent months, and Travelzoo shares have surged by almost 30% year-to-date and 130% in the last year. What’s more, based on a forward P/E ratio of 12.6 and projected earnings growth of 17.5%, the company may still have plenty of room to grow.
FBRT: REIT With Strong Projected Growth
The residential real estate market broadly stands to benefit from reduced interest rates, as buyers have an easier time accessing mortgages, and sellers are more motivated to offload when they have the prospect of a relatively low mortgage rate as well. Franklin BSP Realty Trust Inc. FBRT invests in residential mortgage pass-through securities, making it especially likely to benefit from a boost to home sales.
This real estate investment trust (REIT) has strong new commitments of well over $600 million in the most recent quarter, and cash on hand to be able to repurchase 3 million shares during that period as well. Its dividend payment history is strong and it has a dividend yield of 11.2%. Analysts project earnings to grow by more than 24% and see upside potential of more than 21%, too.
AURA: Positive Trial Results Fuel Optimism
Clinical-stage biotech firm Aura Biosciences Inc. AURA has had a tumultuous year with a number of brief spikes in stock price, though shares are down about 5% in the last 12 months as of October 10. Still, analysts are widely optimistic about the company, as AURA shares enjoy a “buy” rating and a consensus price target of $21.67, more than 160% above current levels.
Driving this optimism is the company’s recent positive results from its Phase 2 study of bel-sar, a treatment for certain types of ocular cancers. These results showed strong tumor control rates and vision preservation among patients, as well as a favorable safety profile.
Risk vs. Reward for Small-Cap Stocks
Small-cap stocks tend to be riskier investments than larger, well-established companies, but they can also offer the prospect of outsized returns when they succeed. Managing risk in the small-cap space also depends on the type of company, the industry and sector, and other factors. Biotechnology companies like Aura, for example, may remain unprofitable for a long period of time before seeing top- and bottom-line (and share price) spikes based on the success of a new drug treatment. This may make firms like this even more volatile than other small-cap companies.
The article “3 Small-Cap Stocks Ready to Deliver Significant Growth” first appeared on MarketBeat.
Market News and Data brought to you by Benzinga APIs
© 2024 Benzinga.com. Benzinga does not provide investment advice. All rights reserved.
Earnings Preview: PPG Indus
PPG Indus PPG is set to give its latest quarterly earnings report on Wednesday, 2024-10-16. Here’s what investors need to know before the announcement.
Analysts estimate that PPG Indus will report an earnings per share (EPS) of $2.15.
Anticipation surrounds PPG Indus’s announcement, with investors hoping to hear about both surpassing estimates and receiving positive guidance for the next quarter.
New investors should understand that while earnings performance is important, market reactions are often driven by guidance.
Performance in Previous Earnings
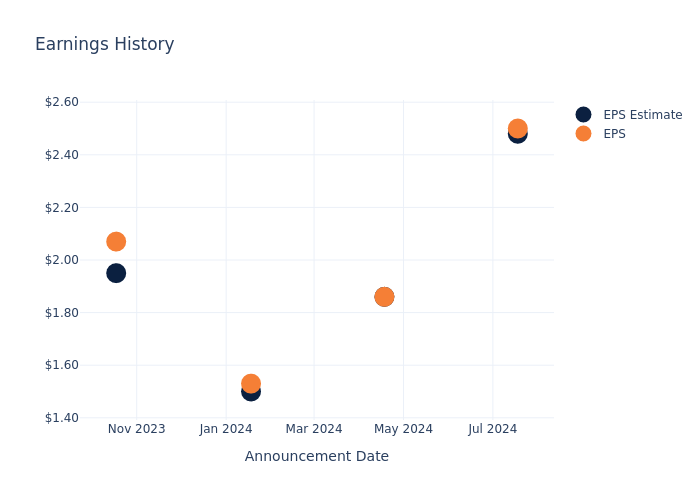
During the last quarter, the company reported an EPS beat by $0.02, leading to a 2.79% drop in the share price on the subsequent day.
Here’s a look at PPG Indus’s past performance and the resulting price change:
| Quarter | Q2 2024 | Q1 2024 | Q4 2023 | Q3 2023 |
|---|---|---|---|---|
| EPS Estimate | 2.48 | 1.86 | 1.50 | 1.95 |
| EPS Actual | 2.50 | 1.86 | 1.53 | 2.07 |
| Price Change % | -3.0% | -3.0% | -2.0% | -3.0% |
Tracking PPG Indus’s Stock Performance
Shares of PPG Indus were trading at $128.5 as of October 14. Over the last 52-week period, shares are up 2.63%. Given that these returns are generally positive, long-term shareholders are likely bullish going into this earnings release.
Analysts’ Take on PPG Indus
For investors, staying informed about market sentiments and expectations in the industry is paramount. This analysis provides an exploration of the latest insights on PPG Indus.
Analysts have given PPG Indus a total of 7 ratings, with the consensus rating being Neutral. The average one-year price target is $147.57, indicating a potential 14.84% upside.
Peer Ratings Comparison
In this comparison, we explore the analyst ratings and average 1-year price targets of Intl Flavors & Fragrances, DuPont de Nemours and RPM Intl, three prominent industry players, offering insights into their relative performance expectations and market positioning.
- The consensus among analysts is an Outperform trajectory for Intl Flavors & Fragrances, with an average 1-year price target of $109.78, indicating a potential 14.57% downside.
- For DuPont de Nemours, analysts project an Buy trajectory, with an average 1-year price target of $93.0, indicating a potential 27.63% downside.
- As per analysts’ assessments, RPM Intl is favoring an Neutral trajectory, with an average 1-year price target of $132.92, suggesting a potential 3.44% upside.
Peers Comparative Analysis Summary
The peer analysis summary provides a snapshot of key metrics for Intl Flavors & Fragrances, DuPont de Nemours and RPM Intl, illuminating their respective standings within the industry. These metrics offer valuable insights into their market positions and comparative performance.
| Company | Consensus | Revenue Growth | Gross Profit | Return on Equity |
|---|---|---|---|---|
| PPG Indus | Neutral | -1.60% | $2.06B | 6.72% |
| Intl Flavors & Fragrances | Outperform | -1.37% | $1.07B | 1.19% |
| DuPont de Nemours | Buy | 2.49% | $1.18B | 0.76% |
| RPM Intl | Neutral | -2.14% | $836.67M | 8.79% |
Key Takeaway:
PPG Indus ranks in the middle for revenue growth among its peers. It ranks at the top for gross profit. It is at the bottom for return on equity.
Unveiling the Story Behind PPG Indus
PPG is a global producer of coatings. The company is the world’s largest producer of coatings after the purchase of selected Akzo Nobel assets. PPG’s products are sold to a wide variety of end users, including the automotive, aerospace, construction, and industrial markets. The company has a footprint in many regions around the globe, with less than half of sales coming from North America in recent years. PPG is focused on its coatings and specialty products and expansion into emerging regions, as exemplified by the Comex acquisition.
PPG Indus: Delving into Financials
Market Capitalization Highlights: Above the industry average, the company’s market capitalization signifies a significant scale, indicating strong confidence and market prominence.
Revenue Challenges: PPG Indus’s revenue growth over 3 months faced difficulties. As of 30 June, 2024, the company experienced a decline of approximately -1.6%. This indicates a decrease in top-line earnings. As compared to its peers, the revenue growth lags behind its industry peers. The company achieved a growth rate lower than the average among peers in Materials sector.
Net Margin: The company’s net margin is a standout performer, exceeding industry averages. With an impressive net margin of 11.01%, the company showcases strong profitability and effective cost control.
Return on Equity (ROE): The company’s ROE is a standout performer, exceeding industry averages. With an impressive ROE of 6.72%, the company showcases effective utilization of equity capital.
Return on Assets (ROA): PPG Indus’s ROA excels beyond industry benchmarks, reaching 2.42%. This signifies efficient management of assets and strong financial health.
Debt Management: PPG Indus’s debt-to-equity ratio is below the industry average. With a ratio of 0.93, the company relies less on debt financing, maintaining a healthier balance between debt and equity, which can be viewed positively by investors.
To track all earnings releases for PPG Indus visit their earnings calendar on our site.
This article was generated by Benzinga’s automated content engine and reviewed by an editor.
© 2024 Benzinga.com. Benzinga does not provide investment advice. All rights reserved.
Price Over Earnings Overview: Estee Lauder Cos
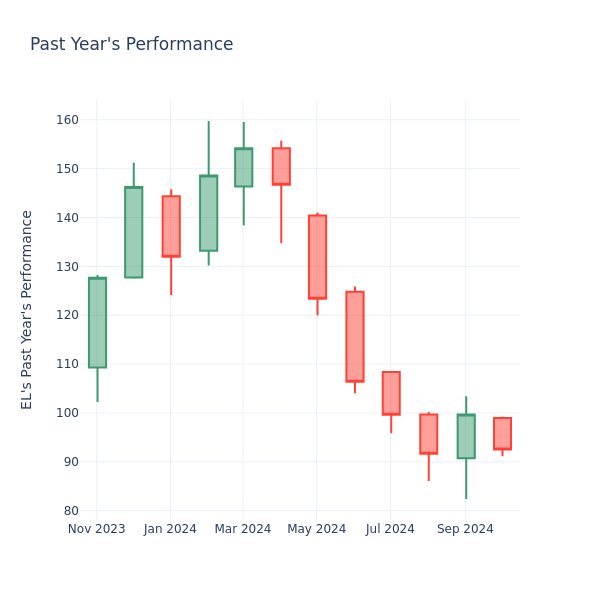
In the current market session, Estee Lauder Cos Inc. EL share price is at $92.53, after a 2.02% decrease. Over the past month, the stock went up by 5.03%, but over the past year, it actually fell by 33.25%. With good short-term performance like this, and questionable long-term performance, long-term shareholders might want to start looking into the company’s price-to-earnings ratio.
Evaluating Estee Lauder Cos P/E in Comparison to Its Peers
The P/E ratio measures the current share price to the company’s EPS. It is used by long-term investors to analyze the company’s current performance against it’s past earnings, historical data and aggregate market data for the industry or the indices, such as S&P 500. A higher P/E indicates that investors expect the company to perform better in the future, and the stock is probably overvalued, but not necessarily. It also could indicate that investors are willing to pay a higher share price currently, because they expect the company to perform better in the upcoming quarters. This leads investors to also remain optimistic about rising dividends in the future.
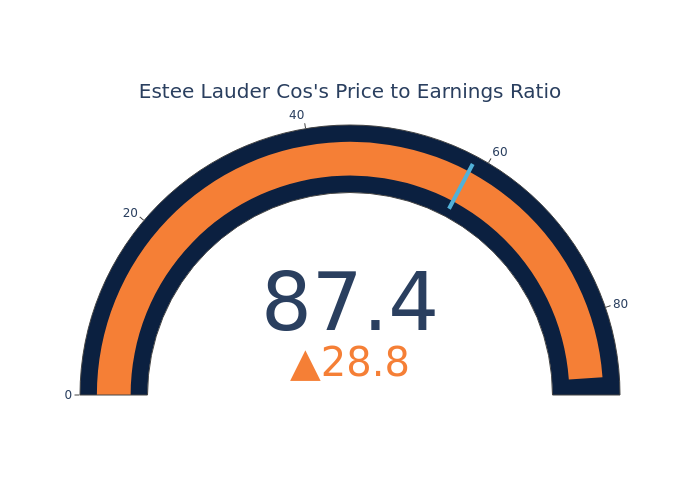
Compared to the aggregate P/E ratio of 58.64 in the Personal Products industry, Estee Lauder Cos Inc. has a higher P/E ratio of 87.44. Shareholders might be inclined to think that Estee Lauder Cos Inc. might perform better than its industry group. It’s also possible that the stock is overvalued.
In conclusion, the price-to-earnings ratio is a useful metric for analyzing a company’s market performance, but it has its limitations. While a lower P/E can indicate that a company is undervalued, it can also suggest that shareholders do not expect future growth. Additionally, the P/E ratio should not be used in isolation, as other factors such as industry trends and business cycles can also impact a company’s stock price. Therefore, investors should use the P/E ratio in conjunction with other financial metrics and qualitative analysis to make informed investment decisions.
Market News and Data brought to you by Benzinga APIs
© 2024 Benzinga.com. Benzinga does not provide investment advice. All rights reserved.
Home Sequential Compression Devices Market Size is Estimated to Touch USD 1.9 billion, Advancing at a CAGR of 6.8% by 2031: Transparency Market Research Inc.
Wilmington, Delaware, United States, Transparency Market Research Inc. -, Oct. 15, 2024 (GLOBE NEWSWIRE) — The global home sequential compression devices market (가정용 순차 압축 장치 시장) is estimated to flourish at a CAGR of 6.8% from 2023 to 2031. Transparency Market Research projects that the overall sales revenue for home sequential compression devices is estimated to reach US$ 1.9 billion by the end of 2031.
In the home sequential compression devices market, consumer education initiatives are emerging as significant drivers. As awareness grows about the benefits of compression therapy for various health conditions beyond the traditional scope, such as sports recovery and pregnancy-related swelling, demand for these devices is expanding.
Download Sample Copy of the Report:
https://www.transparencymarketresearch.com/sample/sample.php?flag=S&rep_id=85882

Manufacturers and healthcare providers are investing in educational campaigns to inform consumers about the therapeutic benefits and proper usage of sequential compression devices, thereby stimulating market growth.
Advancements in remote monitoring technology are shaping the market landscape. Integrated monitoring features in sequential compression devices allow healthcare providers to remotely track patient compliance and progress, optimizing treatment outcomes and reducing the need for in-person follow-ups. This trend aligns with the broader shift towards telehealth and remote patient monitoring, driving the adoption of home sequential compression devices as part of comprehensive remote care solutions.
Home Sequential Compression Devices Market: Competitive Landscape
The competitive landscape of the home sequential compression devices market is characterized by a mix of established players and emerging entrants.
Key companies like DJO Global, Inc., NormaTec, and BioCompression Systems, Inc. dominate with their extensive product portfolios and widespread distribution networks. Niche players focusing on specialized applications or innovative features are gaining traction.
The market is witnessing increased collaboration between manufacturers and healthcare providers to develop customized solutions and enhance patient outcomes.
As demand for home-based medical devices continues to rise, competition intensifies, prompting companies to innovate and differentiate to maintain their market positions. Some prominent players are as follows:
- Compression Solutions
- AIROS Medical Inc.
- Lympha Press USA
- Biocompression Systems
- Huntleigh Healthcare
- Globus Corporation
- Fisiopress
- Welbutech
- Devon Medical Products
- Tactile Medica
Product Portfolio
- Compression Solutions specializes in providing innovative compression therapy products for medical and wellness applications. With a commitment to quality and patient care, they offer a comprehensive range of garments and devices designed to improve circulation and manage lymphatic conditions effectively.
- AIROS Medical Inc. is a leading provider of pneumatic compression therapy systems for treating lymphedema and venous insufficiency. Their state-of-the-art devices offer customizable treatment options and advanced features to meet the diverse needs of patients and healthcare professionals.
Key Findings of the Market Report
- Intermittent pneumatic compression devices lead the home sequential compression devices market due to their versatility and effectiveness in managing vascular conditions.
- Venous thromboembolism is leading the home sequential compression devices market due to its high prevalence and need for long-term management.
- Online sales lead the home sequential compression devices market due to the convenience and accessibility of purchasing products directly from manufacturers or retailers.
To Get Sample PDF Brochure Here:
https://www.transparencymarketresearch.com/sample/sample.php?flag=S&rep_id=85882
Home Sequential Compression Devices Market Growth Drivers & Trends
- Increasing incidence of conditions like lymphedema and venous insufficiency drives demand for home sequential compression devices for long-term management.
- Continuous innovation in device design and features enhances patient comfort, usability, and treatment efficacy, driving market growth.
- Growing elderly population worldwide fuels demand for home healthcare solutions, including sequential compression devices, to manage age-related vascular conditions.
- Preference for home-based treatment options over hospital stays accelerates the adoption of sequential compression devices for convenient and cost-effective management.
- Rising awareness of the importance of vascular health and preventive care prompts individuals to seek early intervention and adopt home-based treatment modalities.
Global Home Sequential Compression Devices Market: Regional Profile
- North America leads with a mature market driven by a rising prevalence of chronic conditions like lymphedema and venous insufficiency. Key players like DJO Global, Inc. and BioCompression Systems, Inc. dominate, offering a wide range of devices tailored to patient needs and lifestyle preferences.
- In Europe, a strong emphasis on preventive healthcare and patient-centric treatment models shapes the market landscape. Companies like NormaTec and Game Ready lead innovation, offering advanced compression therapy systems that cater to diverse patient populations. The region’s aging population and increasing awareness of the benefits of home-based healthcare drive market growth.
- In the Asia Pacific region, rapid urbanization and healthcare infrastructure development fuel demand for home sequential compression devices. Leading players such as A&D Company, Limited and Daesung Maref Co., Ltd. cater to diverse patient needs, offering affordable and accessible solutions for managing vascular conditions.
- Increasing healthcare expenditure and government initiatives to promote home healthcare services drive market expansion, positioning the region as a key market for growth in the global home sequential compression devices market.
Home Sequential Compression Devices Market: Key Segments
By Device Type
- Intermittent Pneumatic Compression (IPC) Devices
- Lymphedema Pumps
- Foot and Calf Compression Devices
- Others
By Application
- Deep Vein Thrombosis (DVT)
- Venous Thromboembolism (VTE)
- Pulmonary Embolus (PE)
- Others
By Distribution Channel
- Retail Channels
- Online Sales
By Region
- North America
- Europe
- Asia Pacific
- Latin America
- Middle East & Africa
Buy this Premium Research Report: https://www.transparencymarketresearch.com/checkout.php?rep_id=85882<ype=S
Explore More Trending Report by Transparency Market Research:
Active Pharmaceutical Ingredients (API) Market (医薬品原薬(API)市場) is projected to flourish at a CAGR of 6.4% from 2023 to 2031: TMR Report
CINV Existing and Pipeline Drugs Market (سوق أدوية CINV الحالية وخطوط الأنابيب) to reach US$ 3.2 billion in 2031, expanding at a CAGR of 5.8%: TMR Report
About Transparency Market Research
Transparency Market Research, a global market research company registered at Wilmington, Delaware, United States, provides custom research and consulting services. Our exclusive blend of quantitative forecasting and trends analysis provides forward-looking insights for thousands of decision makers. Our experienced team of Analysts, Researchers, and Consultants use proprietary data sources and various tools & techniques to gather and analyses information.
Our data repository is continuously updated and revised by a team of research experts, so that it always reflects the latest trends and information. With a broad research and analysis capability, Transparency Market Research employs rigorous primary and secondary research techniques in developing distinctive data sets and research material for business reports.
Contact:
Transparency Market Research Inc.
CORPORATE HEADQUARTER DOWNTOWN,
1000 N. West Street,
Suite 1200, Wilmington, Delaware 19801 USA
Tel: +1-518-618-1030
USA – Canada Toll Free: 866-552-3453
Website: https://www.transparencymarketresearch.com
Email: sales@transparencymarketresearch.com
Follow Us: LinkedIn| Twitter| Blog | YouTube

© 2024 Benzinga.com. Benzinga does not provide investment advice. All rights reserved.
Electrotherapy Market Size to Hit USD 1997.67 Million by 2033 | Straits Research
New York, United States, Oct. 15, 2024 (GLOBE NEWSWIRE) — The use of electric impulses to relax muscles, improve blood flow, repair tissues, and encourage bone formation is known as electrotherapy. Global demand for electrotherapy has increased as a result of the use of physiotherapy in the treatment of various ailments. Electrotherapy is the application of electrical impulses to relax muscles, enhance blood flow, heal tissues, and promote bone growth.
Market Dynamics
New Product Launches and Technological Advances Drive the Global Market
Technological advancements in interferential therapy, ultrasound therapy, and transcutaneous electrical nerve stimulation are anticipated to support market growth. Recent product innovations from manufacturers allow us to see how far technology has come. For instance, in February 2021, KT Tape LLC (US) unveiled the newest addition to its recovery product line, KT Recovery+ Wave. The KT Wave, the powerful electromagnetic technology previously only available at a doctor’s office, is transformed into a wearable, convenient solution by the FDA-approved wearable device KT Wave. It provides drug-free relief for sprains, arthritis, back pain, carpal tunnel syndrome, sports injuries, knee pain, and other symptoms. The increasing number of product launches and strategic moves made by manufacturers in the global electrotherapy market are expected to speed up market growth.
Download Free Sample Report PDF @ https://straitsresearch.com/report/electrotherapy-market/request-sample
High Market Growth to Support the Launch of New Products Creates Tremendous Opportunities
New products that can help patients in various ways, including pain relief, have also been developed as electrotherapy technology advances. According to data from the US Bureau of Economic Analysis, domestic production of medical supplies and equipment is increasing in real output and value-added (BEA). The larger “Medical Equipment and Supplies Manufacturing” industry had USD 102 billion in gross output and USD 62 billion in value added in 2018. This includes the two most essential subcategories, “Surgical and Medical Instrument Manufacturing” (USD 45.9 billion) and “Surgical Appliance and Supplies Manufacturing” (USD 37.4 billion). The latter category, which includes ventilators, masks, and numerous other essential medical supplies, saw an increase in real output of nearly 90% during the period under consideration. Manufacturing of analytical laboratory instruments (121.8%), irradiation apparatus (468.0%), and electromedical and electrotherapeutic apparatus (418.1%) were among the sectors that experienced notable increases in real output.
Regional Analysis
Americas is the most significant shareholder in the global electrotherapy market and is expected to grow at a CAGR of 5.53% during the forecast period. The developed healthcare system, growing demand for electrotherapy, and the existence of significant regional players are all factors in the Americas’ 40.44% market share. Another aspect of the market’s growth in the region is the high rate of sports-related injuries. For instance, according to estimates from the Centers for Disease Control and Prevention (CDC), 273,272 children (age 17 or younger) were treated in emergency departments (EDs) in the US in 2016 for nonfatal traumatic brain injuries (TBIs) related to sports and recreation. It is estimated that 3.5 million children suffer injuries from sports-related incidents annually. Bicycling was the second riskiest sport, with about 417,000 injuries, while football and basketball were third and fourth, with 404,000 and 292,000 injuries, respectively. In addition, the increasing use of electrotherapy systems in treating sports injuries among professional athletes and sportsmen is thus another factor driving the market in North America.
Europe is expected to grow at a CAGR of 4.43% during the forecast period. The rise in diabetes prevalence and the resulting increase in diabetic nerve pain are blamed for the market expansion. According to the World Health Organization, there are about 60 million diabetics in Europe (WHO). Diabetes is increasing in prevalence among people of all ages in the European region, primarily due to increased overweight and obesity, a poor diet, and sedentary lifestyles. In addition, the region’s steadily rising cancer survivability rate and expanding geriatric population are also anticipated to contribute to the electrotherapy market’s expansion. High healthcare spending is also expected to fuel the market’s growth. According to a report released by the European Union, approximately 9.6% of the entire gross domestic product was spent on healthcare in European nations.
To Gather Additional Insights on the Regional Analysis of the Electrotherapy Market @ https://straitsresearch.com/report/electrotherapy-market/request-sample
Key Highlights
- Based on the treatment type, the global electrotherapy market is bifurcated into extracorporeal shock wave therapy, interferential current therapy (IC), magnetic field therapy, ultrasound therapy, transcutaneous electrical nerve stimulation (TENS) therapy, micro-current therapy, transcutaneous spinal electro analgesia (TSE), pulsed short wave diathermy (PSWD), spinal cord stimulation (SCS), percutaneous electrical nerve stimulation (PENS). The transcutaneous electrical nerve stimulation (tens) therapy segment is the highest contributor to the market and is expected to grow at a CAGR of 6.13% during the forecast period.
- Based on the device type, the global electrotherapy market is bifurcated into transcutaneous electrical neural stimulator (TENS), electronic muscle stimulator (EMS), interferential stimulator (IF), high voltage pulsed galvanic stimulator (HVPGS), microcurrent stimulator (MC) or microcurrent electrical neuromuscular stimulator (MENS). The transcutaneous electrical neural stimulator (TENS) segment owns the highest market share and is expected to grow at a CAGR of 5.91% during the forecast period.
- Based on the application, the global electrotherapy market is bifurcated into pain management, neuromuscular dysfunction, urine and fecal incontinence, acute and chronic edema, tissue repair, iontophoresis, orthopedics, and cardiology. The pain management segment is the highest contributor to the market and is expected to grow at a CAGR of 5.96% during the forecast period.
- Based on the end-user, the global electrotherapy market is bifurcated into hospitals and clinics, rehabilitation centers, and long-term care centers. The hospitals and clinics segment owns the highest market share and is expected to grow at a CAGR of 6.01% during the forecast period.
- Americas is the most significant shareholder in the global electrotherapy market and is expected to grow at a CAGR of 5.53% during the forecast period.
Competitive Players
- AliMedInc
- Cogentix Medical Inc
- St. Jude Medical Inc
- Zynex Medical
- DJO Global Inc
- Livanova Plc
- Nevro Corp
- Neurometrix Inc
- Boston Scientific Corporation
Recent Developments
- October 2022-Electromedical Technologies, Inc., a pioneer in developing and producing bioelectronic devices designed to relieve chronic, intractable, and acute pain through frequency and electro-modulation, introduced its new next-generation flagship device, the WellnessPro Infinity™.
Segmentation
- By Treatment Type
- Extracorporeal Shock Wave Therapy
- Interferential Current Therapy (IC)
- Magnetic Field Therapy
- Ultrasound Therapy
- Transcutaneous Electrical Nerve Stimulation (TENS) Therapy
- Micro-Current Therapy
- Transcutaneous Spinal Electro Analgesia (TSE)
- Pulsed Short WaveDiathermy (PSWD)
- Spinal Cord Stimulation (SCS)
- Percutaneous Electrical Nerve Stimulation (PENS)
- By Device Type
- Transcutaneous Electrical Neural Stimulator (TENS)
- Electronic Muscle Stimulator (EMS)
- Interferential Stimulator (IF)
- High Voltage Pulsed Galvanic Stimulator (HVPGS)
- Microcurrent Stimulator (MC) Or Microcurrent Electrical Neuromuscular Stimulator (MENS)
- By Applications
- Pain Management
- Neuromuscular Dysfunction
- Urine and Fecal Incontinence
- Acute and Chronic Edema
- Tissue Repair
- Iontophoresis
- Orthopedics
- Cardiology
- By End-User
- Hospitals and Clinics
- Rehabilitation Centers
- Long-Term Care Centers
- By Region
- North America
- Europe
- Asia Pacific
- Middle East and Africa
- Latin America
Get Detailed Market Segmentation @ https://straitsresearch.com/report/electrotherapy-market/segmentation
About Straits Research Pvt. Ltd.
Straits Research is a market intelligence company providing global business information reports and services. Our exclusive blend of quantitative forecasting and trends analysis provides forward-looking insight for thousands of decision-makers. Straits Research Pvt. Ltd. provides actionable market research data, especially designed and presented for decision making and ROI.
Whether you are looking at business sectors in the next town or crosswise over continents, we understand the significance of being acquainted with the client’s purchase. We overcome our clients’ issues by recognizing and deciphering the target group and generating leads with utmost precision. We seek to collaborate with our clients to deliver a broad spectrum of results through a blend of market and business research approaches.
For more information on your target market, please contact us below:
Phone: +1 646 905 0080 (U.S.)
+91 8087085354 (India)
+44 203 695 0070 (U.K.)
Email: sales@straitsresearch.com
Follow Us: LinkedIn | Facebook | Instagram | Twitter

© 2024 Benzinga.com. Benzinga does not provide investment advice. All rights reserved.
Fannie Mae Reminds Homeowners, Renters, and Mortgage Servicers of Disaster Relief Options for Those Affected by Hurricane Milton
WASHINGTON, Oct. 14, 2024 /PRNewswire/ — Fannie Mae FNMA is reminding homeowners and renters impacted by natural disasters, including those affected by Hurricane Milton, of available mortgage assistance and disaster relief options. Mortgage servicers also are reminded of options to assist homeowners under Fannie Mae’s guidelines during these circumstances.
“This is a devastating time for many homeowners and renters impacted by Hurricane Milton, especially as some are still feeling the impacts of Hurricane Helene,” said Cyndi Danko, Senior Vice President and Chief Credit Officer, Single-Family, Fannie Mae. “Once recovery efforts begin, we encourage homeowners experiencing hardship because of the storm(s) to contact their mortgage servicer about payment relief options as soon as possible. Homeowners and renters alike can learn more about disaster relief resources, including personalized support, by contacting Fannie Mae’s free disaster recovery counseling services.”
Homeowners and renters should call 855-HERE2HELP (855-437-3243) to access Fannie Mae’s disaster recovery counseling* or visit the Fannie Mae website for more information.
Under Fannie Mae’s guidelines for single-family mortgages impacted by a disaster:
- Homeowners may request mortgage assistance by contacting their mortgage servicer (the company listed on their mortgage statement) following a disaster.
- Homeowners affected by a disaster are often eligible to reduce or suspend their mortgage payments for up to 12 months by entering into a forbearance plan with their mortgage servicer. During this temporary reduction or pause in payments, homeowners will not incur late fees, and foreclosure along with other legal proceedings are suspended.
- In instances where contact with the homeowner has not been established, mortgage servicers are authorized to offer a forbearance plan for up to 90 days if the servicer believes the home was affected by a disaster.
- In addition, homeowners on a COVID-19-related forbearance plan who are subsequently impacted by a disaster may still be eligible for assistance and should contact their mortgage servicer to discuss options.
Homeowners and renters looking for disaster recovery resources may visit the Fannie Mae website to learn more about addressing immediate needs. Fannie Mae also offers help navigating the broader financial effects of a disaster to homeowners and renters through disaster recovery counseling at 855-HERE2HELP (855-437-3243).* Assistance is provided free of charge by U.S. Department of Housing and Urban Development (HUD)-approved housing counselors who are trained disaster-recovery experts that provide:
- A needs assessment and personalized recovery plan.
- Help requesting financial relief from the Federal Emergency Management Agency (FEMA), insurance companies, and other sources.
- Web resources and ongoing guidance for up to 18 months.
- Services available in multiple languages.
*Operated by Money Management International/MMI
About Fannie Mae
Fannie Mae advances equitable and sustainable access to homeownership and quality, affordable rental housing for millions of people across America. We enable the 30-year fixed-rate mortgage and drive responsible innovation to make homebuying and renting easier, fairer, and more accessible. To learn more, visit:
fanniemae.com | X (formerly Twitter) | Facebook | LinkedIn | Instagram | YouTube | Blog
Fannie Mae Newsroom
https://www.fanniemae.com/news
Photo of Fannie Mae
https://www.fanniemae.com/resources/img/about-fm/fm-building.tif
Fannie Mae Resource Center
1-800-2FANNIE (800-232-6643)
![]() View original content to download multimedia:https://www.prnewswire.com/news-releases/fannie-mae-reminds-homeowners-renters-and-mortgage-servicers-of-disaster-relief-options-for-those-affected-by-hurricane-milton-302275335.html
View original content to download multimedia:https://www.prnewswire.com/news-releases/fannie-mae-reminds-homeowners-renters-and-mortgage-servicers-of-disaster-relief-options-for-those-affected-by-hurricane-milton-302275335.html
SOURCE Fannie Mae
Market News and Data brought to you by Benzinga APIs
© 2024 Benzinga.com. Benzinga does not provide investment advice. All rights reserved.


