Insights Ahead: Synovus Finl's Quarterly Earnings
Synovus Finl SNV is preparing to release its quarterly earnings on Wednesday, 2024-10-16. Here’s a brief overview of what investors should keep in mind before the announcement.
Analysts expect Synovus Finl to report an earnings per share (EPS) of $1.09.
Anticipation surrounds Synovus Finl’s announcement, with investors hoping to hear about both surpassing estimates and receiving positive guidance for the next quarter.
New investors should understand that while earnings performance is important, market reactions are often driven by guidance.
Historical Earnings Performance
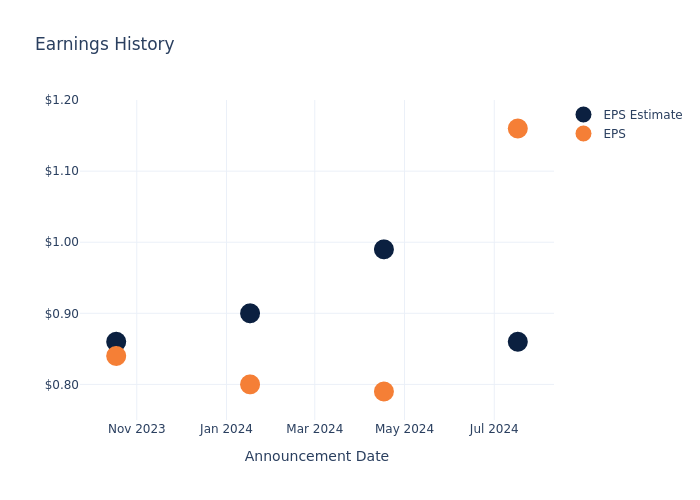
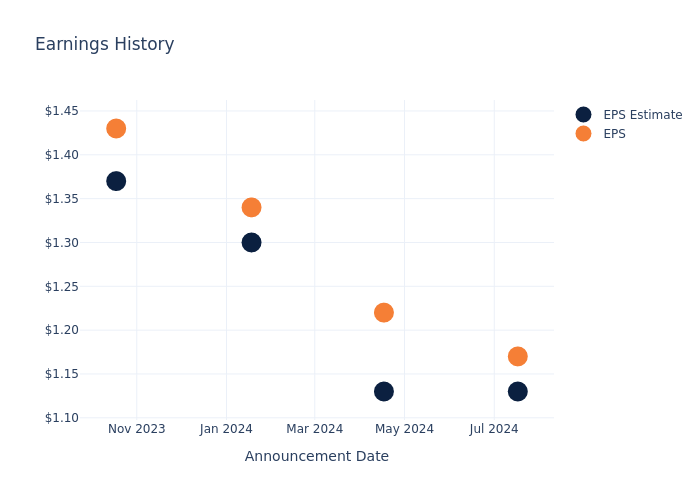
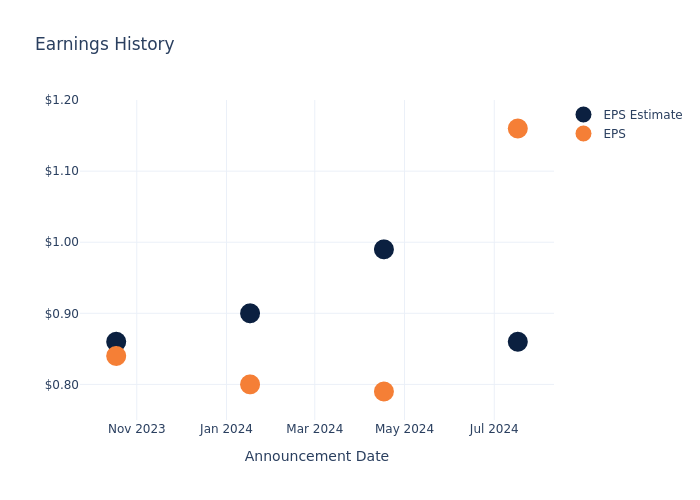
During the last quarter, the company reported an EPS beat by $0.30, leading to a 1.01% drop in the share price on the subsequent day.
Here’s a look at Synovus Finl’s past performance and the resulting price change:
| Quarter | Q2 2024 | Q1 2024 | Q4 2023 | Q3 2023 |
|---|---|---|---|---|
| EPS Estimate | 0.86 | 0.99 | 0.9 | 0.86 |
| EPS Actual | 1.16 | 0.79 | 0.8 | 0.84 |
| Price Change % | -1.0% | -7.000000000000001% | 5.0% | -2.0% |
Stock Performance
Shares of Synovus Finl were trading at $46.54 as of October 14. Over the last 52-week period, shares are up 74.65%. Given that these returns are generally positive, long-term shareholders are likely bullish going into this earnings release.
To track all earnings releases for Synovus Finl visit their earnings calendar on our site.
This article was generated by Benzinga’s automated content engine and reviewed by an editor.
Market News and Data brought to you by Benzinga APIs
© 2024 Benzinga.com. Benzinga does not provide investment advice. All rights reserved.
Teck Resources Vs. Freeport-McMoRan: China Stimulus Boost Or Trump Tariff Blues? Analyst Remains Bullish On Copper
The copper market is caught between a stimulus-fueled surge and the looming specter of Trump 2.0 tariffs.
According to JPMorgan’s Bill Peterson, investors are riding high on China’s stimulus optimism, but the road ahead may be rockier than expected.
China Stimulus: A Boost Or Bubble?
China’s recent stimulus announcements have sent copper stocks, including Teck Resources Ltd TECK and Freeport-McMoRan Inc FCX, climbing — TECK up 6% and FCX up 8% since late September.
But Peterson warns that expectations might have jumped the gun. While the initial stimulus gave equities a short-term boost, the hope for a massive fiscal package could be premature.
“We don’t expect anything major in the near term,” says JPM’s China economists. Translation: buckle up, copper bulls, you might need more patience.
Tariff Time Bomb?
Peterson isn’t just cautious on China. The underappreciated Trump 2.0 tariff risk could derail copper’s momentum, especially if U.S.-China trade tensions escalate.
With global demand already looking fragile outside of China, this is a wrinkle investors can’t ignore.
TECK: The Top Pick
Despite the near-term jitters, Peterson is bullish on TECK stock.
The company’s QB2 mine ramp is behind schedule, but there’s light at the end of the tunnel. Expectations are low for its ramp-up, which may actually work in Teck’s favor.
Investors have recognized the potential M&A premium here, and with a $78 price target, TECK remains JPMorgan’s favorite in the copper space. Teck “has a unique portfolio of greenfield copper projects… that could roughly double copper production… by the end of the decade,” Peterson highlights, setting the stock apart from its peers.
FCX: Stable But Neutral
On the other hand, Freeport is the steady ship in the stormy copper sea.
While Teck may offer more growth potential, Freeport’s minimal risk to production targets makes it a safe haven, at least for now.
However, the recent Indonesian smelter fire and the uncertainty around the country’s mining permit extension present new risks. The leaching potential at its flagship Grasberg mine is enticing, but near-term labor constraints could act as a drag.
Peterson sticks with a neutral rating for FCX, seeing it as a stable play but not a blockbuster growth story—at least not yet.
Election Overhang
Adding to the mix, the upcoming U.S. election and persistent interest rate hikes amplify macro uncertainty.
Investors should brace for volatility as these factors could shift sentiment in the coming months. While long-term trends remain positive, Peterson advises caution in the near term and “would wait for a better entry point.”
Copper may be on the rise, but it’s not all smooth sailing. Teck’s growth potential and strong cash position make it a top pick, while Freeport remains a safe bet for risk-averse investors.
As China stimulus optimism cools and tariff risks heat up, it’s a game of wait and watch.
Read Next:
Market News and Data brought to you by Benzinga APIs
© 2024 Benzinga.com. Benzinga does not provide investment advice. All rights reserved.
What's Next: Old Second Bancorp's Earnings Preview
Old Second Bancorp OSBC is set to give its latest quarterly earnings report on Wednesday, 2024-10-16. Here’s what investors need to know before the announcement.
Analysts estimate that Old Second Bancorp will report an earnings per share (EPS) of $0.47.
The announcement from Old Second Bancorp is eagerly anticipated, with investors seeking news of surpassing estimates and favorable guidance for the next quarter.
It’s worth noting for new investors that guidance can be a key determinant of stock price movements.
Performance in Previous Earnings
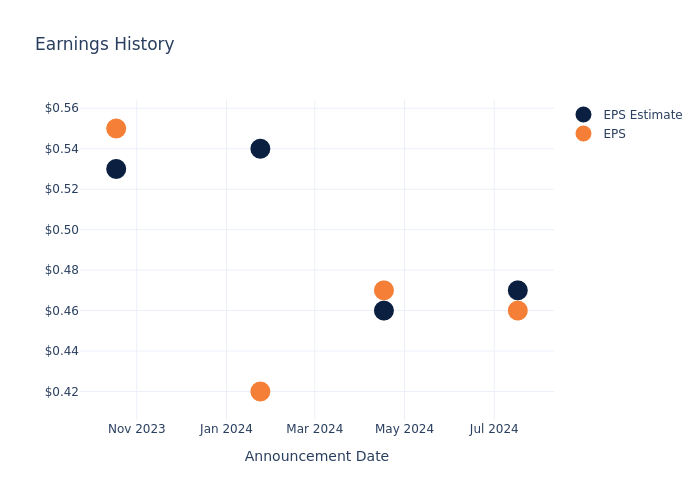
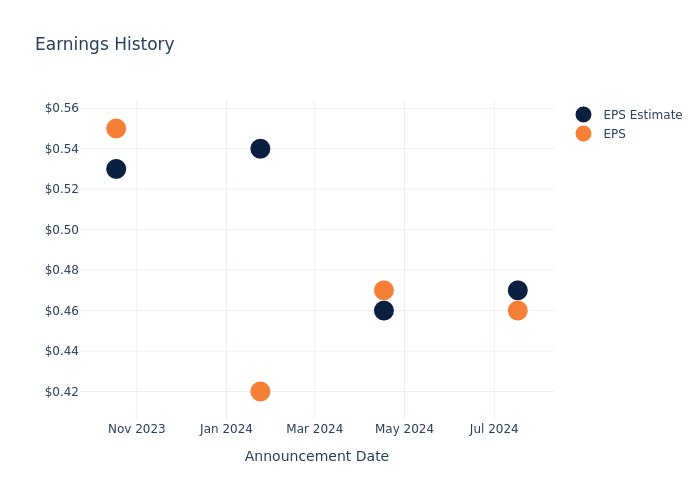
During the last quarter, the company reported an EPS missed by $0.01, leading to a 2.21% drop in the share price on the subsequent day.
Here’s a look at Old Second Bancorp’s past performance and the resulting price change:
| Quarter | Q2 2024 | Q1 2024 | Q4 2023 | Q3 2023 |
|---|---|---|---|---|
| EPS Estimate | 0.47 | 0.46 | 0.54 | 0.53 |
| EPS Actual | 0.46 | 0.47 | 0.42 | 0.55 |
| Price Change % | -2.0% | 2.0% | -8.0% | 2.0% |
Performance of Old Second Bancorp Shares
Shares of Old Second Bancorp were trading at $15.57 as of October 14. Over the last 52-week period, shares are up 18.69%. Given that these returns are generally positive, long-term shareholders are likely bullish going into this earnings release.
To track all earnings releases for Old Second Bancorp visit their earnings calendar on our site.
This article was generated by Benzinga’s automated content engine and reviewed by an editor.
Market News and Data brought to you by Benzinga APIs
© 2024 Benzinga.com. Benzinga does not provide investment advice. All rights reserved.
Looking At Duke Energy's Recent Unusual Options Activity
Investors with a lot of money to spend have taken a bullish stance on Duke Energy DUK.
And retail traders should know.
We noticed this today when the positions showed up on publicly available options history that we track here at Benzinga.
Whether these are institutions or just wealthy individuals, we don’t know. But when something this big happens with DUK, it often means somebody knows something is about to happen.
Today, Benzinga’s options scanner spotted 10 options trades for Duke Energy.
This isn’t normal.
The overall sentiment of these big-money traders is split between 50% bullish and 40%, bearish.
Out of all of the options we uncovered, there was 1 put, for a total amount of $33,762, and 9, calls, for a total amount of $627,974.
Projected Price Targets
Based on the trading activity, it appears that the significant investors are aiming for a price territory stretching from $75.0 to $105.0 for Duke Energy over the recent three months.
Analyzing Volume & Open Interest
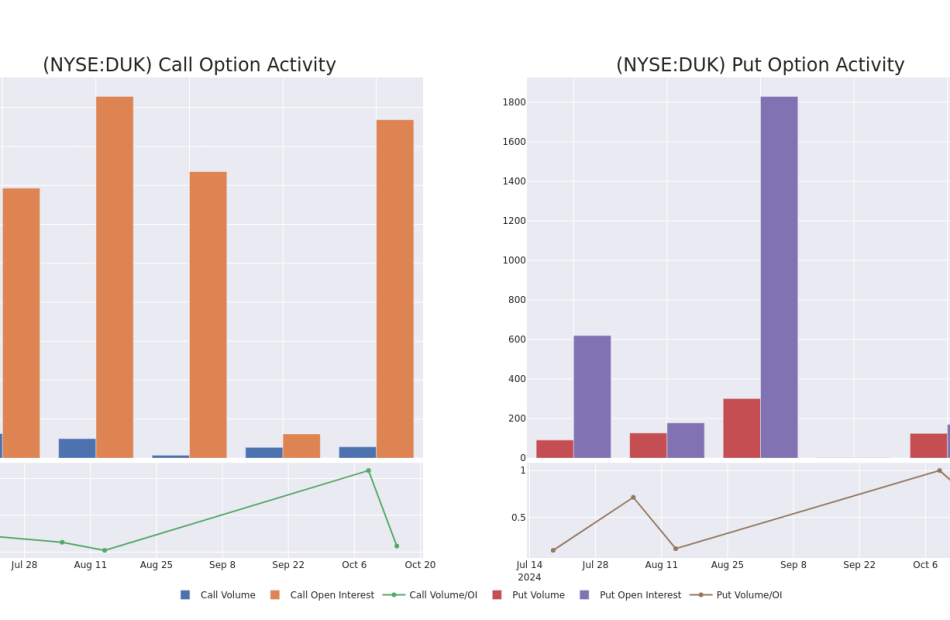
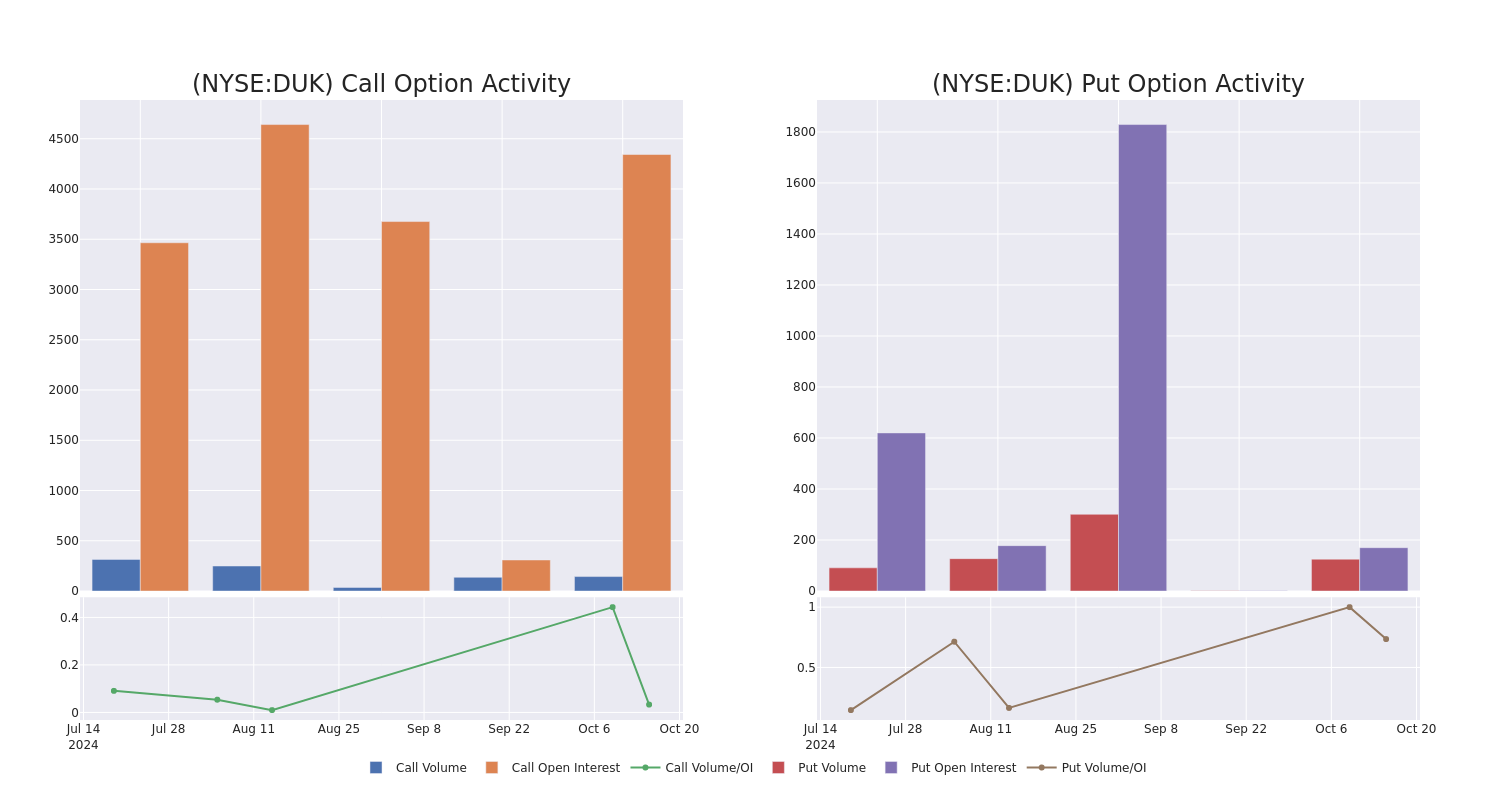
Examining the volume and open interest provides crucial insights into stock research. This information is key in gauging liquidity and interest levels for Duke Energy’s options at certain strike prices. Below, we present a snapshot of the trends in volume and open interest for calls and puts across Duke Energy’s significant trades, within a strike price range of $75.0 to $105.0, over the past month.
Duke Energy 30-Day Option Volume & Interest Snapshot
Largest Options Trades Observed:
| Symbol | PUT/CALL | Trade Type | Sentiment | Exp. Date | Ask | Bid | Price | Strike Price | Total Trade Price | Open Interest | Volume |
|---|---|---|---|---|---|---|---|---|---|---|---|
| DUK | CALL | SWEEP | BEARISH | 01/16/26 | $41.0 | $38.3 | $38.31 | $80.00 | $153.3K | 155 | 40 |
| DUK | CALL | SWEEP | BULLISH | 01/15/27 | $42.8 | $42.0 | $42.8 | $75.00 | $85.6K | 45 | 20 |
| DUK | CALL | TRADE | BEARISH | 01/15/27 | $40.5 | $37.5 | $38.5 | $80.00 | $77.0K | 21 | 20 |
| DUK | CALL | TRADE | BEARISH | 01/15/27 | $45.4 | $43.2 | $43.2 | $75.00 | $69.1K | 45 | 45 |
| DUK | CALL | TRADE | NEUTRAL | 04/17/25 | $29.1 | $27.8 | $28.45 | $90.00 | $56.9K | 23 | 20 |
About Duke Energy
Duke Energy is one of the largest us utilities, with regulated utilities in the Carolinas, Indiana, Florida, Ohio, and Kentucky that deliver electricity to 8.2 million customers. Its natural gas utilities serve more than 1.6 million customers.
Current Position of Duke Energy
- Trading volume stands at 1,063,954, with DUK’s price up by 2.45%, positioned at $117.91.
- RSI indicators show the stock to be may be approaching overbought.
- Earnings announcement expected in 23 days.
Expert Opinions on Duke Energy
In the last month, 5 experts released ratings on this stock with an average target price of $125.2.
Turn $1000 into $1270 in just 20 days?
20-year pro options trader reveals his one-line chart technique that shows when to buy and sell. Copy his trades, which have had averaged a 27% profit every 20 days. Click here for access.
* Maintaining their stance, an analyst from BMO Capital continues to hold a Outperform rating for Duke Energy, targeting a price of $126.
* An analyst from Keybanc persists with their Overweight rating on Duke Energy, maintaining a target price of $121.
* Reflecting concerns, an analyst from Jefferies lowers its rating to Buy with a new price target of $138.
* An analyst from Mizuho upgraded its action to Outperform with a price target of $121.
* An analyst from Morgan Stanley persists with their Equal-Weight rating on Duke Energy, maintaining a target price of $120.
Trading options involves greater risks but also offers the potential for higher profits. Savvy traders mitigate these risks through ongoing education, strategic trade adjustments, utilizing various indicators, and staying attuned to market dynamics. Keep up with the latest options trades for Duke Energy with Benzinga Pro for real-time alerts.
Market News and Data brought to you by Benzinga APIs
© 2024 Benzinga.com. Benzinga does not provide investment advice. All rights reserved.
Crude Oil Tumbles 5%; Goldman Sachs Earnings Top Views
U.S. stocks traded lower midway through trading, with the Dow Jones index falling around 150 points on Tuesday.
The Dow traded down 0.40% to 42,894.69 while the NASDAQ fell 0.93% to 18,331.05. The S&P 500 also fell, dropping, 0.44% to 5,833.93.
Check This Out: How To Earn $500 A Month From Morgan Stanley Stock Ahead Of Q3 Earnings
Leading and Lagging Sectors
Real estate shares jumped by 1.5% on Tuesday.
In trading on Tuesday, energy shares fell by 2%.
Top Headline
Goldman Sachs Group Inc. GS reported revenue of $12.70 billion for the third quarter, beating the consensus of $11.87 billion.
Sales increased 7% Y/Y, reflecting higher net revenues in Global Banking & Markets and Asset & Wealth Management, partially offset by lower net revenues in Platform Solutions. The U.S. financial services giant reported EPS of $8.40, beating the consensus of $7.03.
Equities Trading UP
- Wolfspeed, Inc. WOLF shares shot up 27% to $14.41 after the company announced it signed a signed a non-binding preliminary memorandum of terms for up to $750 million in proposed direct funding under the CHIPS and Science Act.
- Shares of MeiraGTx Holdings plc MGTX got a boost, surging 13% to $5.24 after safety and tolerability was confirmed in its gene therapy study for Parkinson’s.
- Telefonaktiebolaget LM Ericsson ERIC shares were also up, gaining 11% to $8.35 following a third-quarter earnings beat.
Equities Trading DOWN
- Seelos Therapeutics, Inc. SEEL shares dropped 52% to $1.1663. Seelos Therapeutics announced notice of delisting from Nasdaq and transfer of listing to Over-the-Counter Market.
- Shares of CareDx, Inc CDNA were down 17% to $25.93 as the company reported preliminary results for the third quarter.
- Pineapple Energy Inc. PEGY was down, falling 18% to $0.1028 after the company announced a 1-for-50 reverse stock split.
Commodities
In commodity news, oil traded down 4.9% to $70.19 while gold traded up 0.4% at $2,676.10.
Silver traded up 1.2% to $31.700 on Tuesday, while copper fell 1.4% to $4.3425.
Euro zone
European shares were mostly lower today. The eurozone’s STOXX 600 slipped 0.40%, Germany’s DAX slipped 0.01% and France’s CAC 40 fell 1.10%. Spain’s IBEX 35 Index rose 0.64%, while London’s FTSE 100 fell 0.37%.
Asia Pacific Markets
Asian markets closed mostly lower on Tuesday, with Japan’s Nikkei 225 gaining 0.77%, Hong Kong’s Hang Seng Index falling 3.67%, China’s Shanghai Composite Index dipping 2.53% and India’s BSE Sensex falling 0.19%.
Economics
The NY Empire State Manufacturing Index declined to -11.9 in October from 11.5 in the previous month and topping market estimates of 3.8.
Market News and Data brought to you by Benzinga APIs
© 2024 Benzinga.com. Benzinga does not provide investment advice. All rights reserved.
A Glimpse of Great Southern Bancorp's Earnings Potential
Great Southern Bancorp GSBC is gearing up to announce its quarterly earnings on Wednesday, 2024-10-16. Here’s a quick overview of what investors should know before the release.
Analysts are estimating that Great Southern Bancorp will report an earnings per share (EPS) of $1.26.
Investors in Great Southern Bancorp are eagerly awaiting the company’s announcement, hoping for news of surpassing estimates and positive guidance for the next quarter.
It’s worth noting for new investors that stock prices can be heavily influenced by future projections rather than just past performance.
Historical Earnings Performance
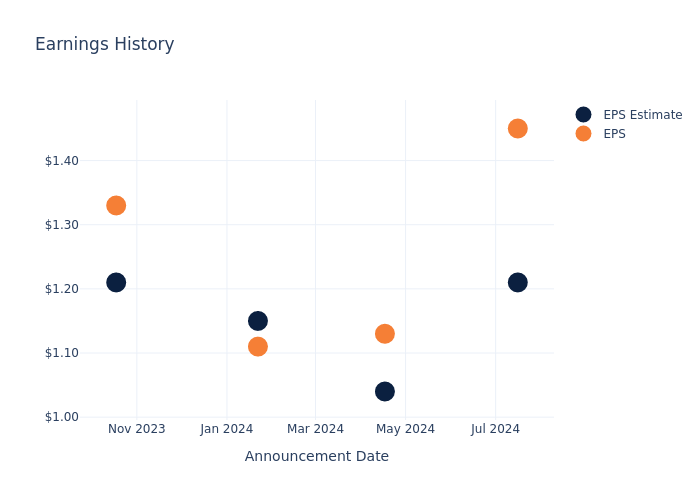
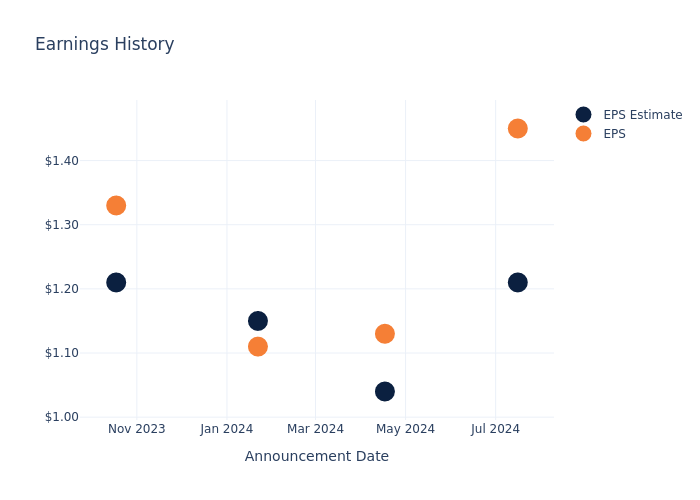
The company’s EPS beat by $0.24 in the last quarter, leading to a 1.14% increase in the share price on the following day.
Here’s a look at Great Southern Bancorp’s past performance and the resulting price change:
| Quarter | Q2 2024 | Q1 2024 | Q4 2023 | Q3 2023 |
|---|---|---|---|---|
| EPS Estimate | 1.21 | 1.04 | 1.15 | 1.21 |
| EPS Actual | 1.45 | 1.13 | 1.11 | 1.33 |
| Price Change % | 1.0% | 2.0% | -5.0% | 1.0% |
Market Performance of Great Southern Bancorp’s Stock
Shares of Great Southern Bancorp were trading at $57.4 as of October 14. Over the last 52-week period, shares are up 23.41%. Given that these returns are generally positive, long-term shareholders are likely bullish going into this earnings release.
To track all earnings releases for Great Southern Bancorp visit their earnings calendar on our site.
This article was generated by Benzinga’s automated content engine and reviewed by an editor.
Market News and Data brought to you by Benzinga APIs
© 2024 Benzinga.com. Benzinga does not provide investment advice. All rights reserved.
Decoding Oklo's Options Activity: What's the Big Picture?
Investors with a lot of money to spend have taken a bullish stance on Oklo OKLO.
And retail traders should know.
We noticed this today when the positions showed up on publicly available options history that we track here at Benzinga.
Whether these are institutions or just wealthy individuals, we don’t know. But when something this big happens with OKLO, it often means somebody knows something is about to happen.
Today, Benzinga’s options scanner spotted 17 options trades for Oklo.
This isn’t normal.
The overall sentiment of these big-money traders is split between 64% bullish and 29%, bearish.
Out of all of the options we uncovered, there was 1 put, for a total amount of $33,000, and 16, calls, for a total amount of $662,618.
What’s The Price Target?
Analyzing the Volume and Open Interest in these contracts, it seems that the big players have been eyeing a price window from $5.0 to $15.0 for Oklo during the past quarter.
Analyzing Volume & Open Interest
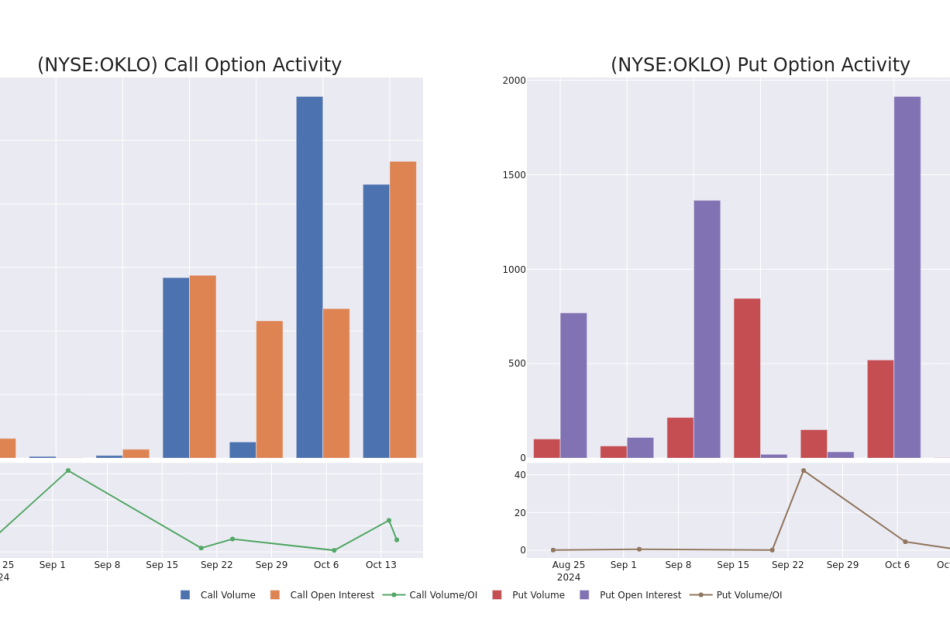
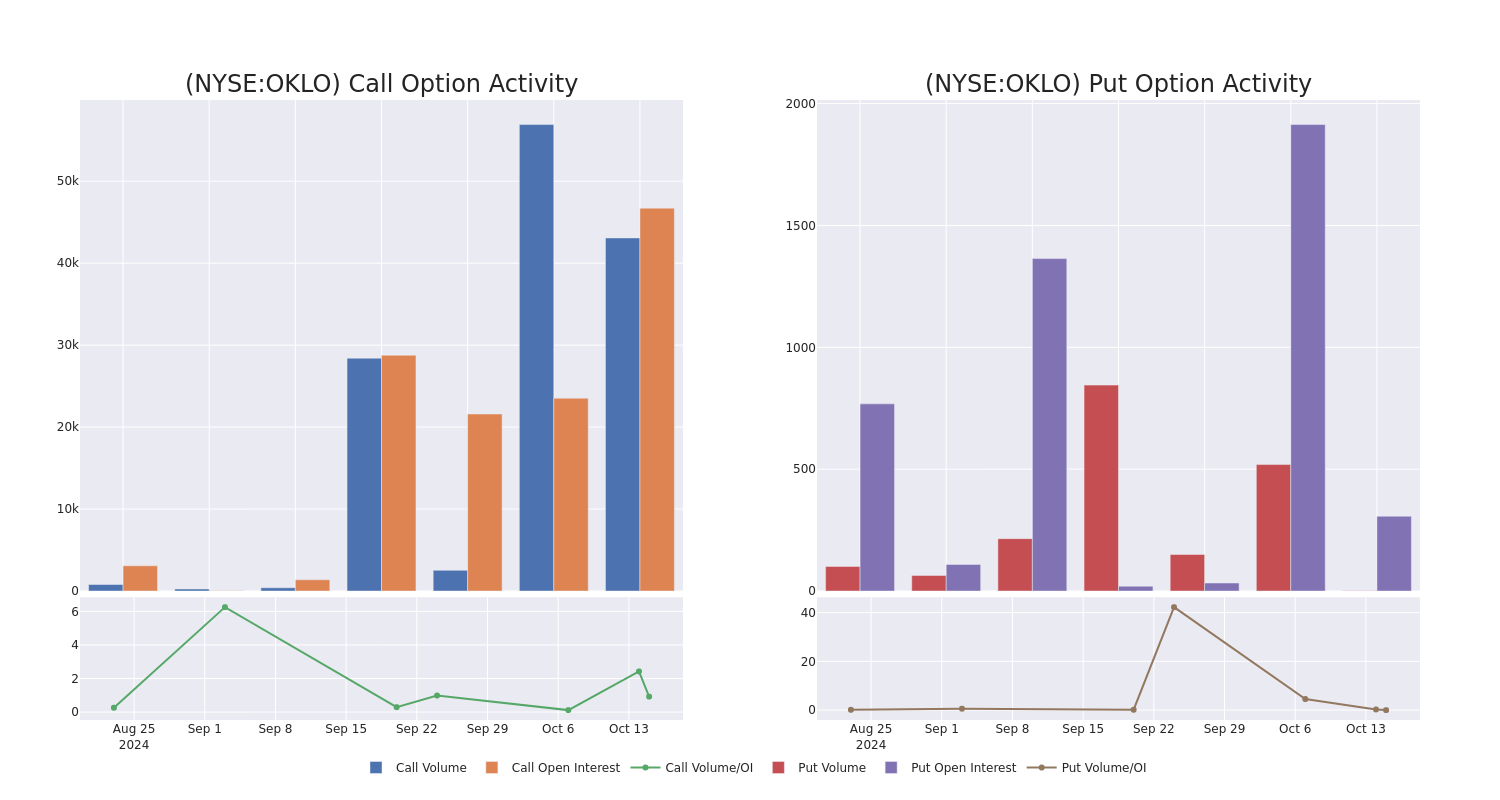
Examining the volume and open interest provides crucial insights into stock research. This information is key in gauging liquidity and interest levels for Oklo’s options at certain strike prices. Below, we present a snapshot of the trends in volume and open interest for calls and puts across Oklo’s significant trades, within a strike price range of $5.0 to $15.0, over the past month.
Oklo Option Volume And Open Interest Over Last 30 Days
Noteworthy Options Activity:
| Symbol | PUT/CALL | Trade Type | Sentiment | Exp. Date | Ask | Bid | Price | Strike Price | Total Trade Price | Open Interest | Volume |
|---|---|---|---|---|---|---|---|---|---|---|---|
| OKLO | CALL | SWEEP | BULLISH | 01/16/26 | $6.7 | $6.0 | $6.68 | $5.00 | $100.4K | 485 | 180 |
| OKLO | CALL | SWEEP | BULLISH | 11/15/24 | $1.5 | $1.35 | $1.5 | $10.00 | $75.0K | 8.4K | 2.0K |
| OKLO | CALL | SWEEP | BEARISH | 11/15/24 | $2.6 | $2.45 | $2.45 | $10.00 | $61.2K | 8.4K | 5.5K |
| OKLO | CALL | SWEEP | BULLISH | 11/15/24 | $1.15 | $1.05 | $1.13 | $12.50 | $58.0K | 2.5K | 2.3K |
| OKLO | CALL | SWEEP | BULLISH | 01/17/25 | $2.2 | $2.0 | $2.15 | $12.50 | $53.5K | 4.5K | 973 |
About Oklo
Oklo Inc is developing advanced fission power plants to provide clean, reliable, and affordable energy at scale. It is pursuing two complementary tracks to address this demand: providing reliable, commercial-scale energy to customers; and selling used nuclear fuel recycling services to the U.S. market. The Company plans to commercialize its liquid metal fast reactor technology with the Aurora powerhouse product line. The first commercial Aurora powerhouse is designed to produce up to 15 megawatts of electricity (MWe) on both recycled nuclear fuel and fresh fuel.
Having examined the options trading patterns of Oklo, our attention now turns directly to the company. This shift allows us to delve into its present market position and performance
Where Is Oklo Standing Right Now?
- With a volume of 13,500,351, the price of OKLO is up 12.25% at $11.27.
- RSI indicators hint that the underlying stock may be overbought.
- Next earnings are expected to be released in 29 days.
Professional Analyst Ratings for Oklo
2 market experts have recently issued ratings for this stock, with a consensus target price of $10.0.
Turn $1000 into $1270 in just 20 days?
20-year pro options trader reveals his one-line chart technique that shows when to buy and sell. Copy his trades, which have had averaged a 27% profit every 20 days. Click here for access.
* In a cautious move, an analyst from B. Riley Securities downgraded its rating to Buy, setting a price target of $10.
* Maintaining their stance, an analyst from Citigroup continues to hold a Neutral rating for Oklo, targeting a price of $10.
Options trading presents higher risks and potential rewards. Astute traders manage these risks by continually educating themselves, adapting their strategies, monitoring multiple indicators, and keeping a close eye on market movements. Stay informed about the latest Oklo options trades with real-time alerts from Benzinga Pro.
Market News and Data brought to you by Benzinga APIs
© 2024 Benzinga.com. Benzinga does not provide investment advice. All rights reserved.
What's Next: Banner's Earnings Preview
Banner BANR is gearing up to announce its quarterly earnings on Wednesday, 2024-10-16. Here’s a quick overview of what investors should know before the release.
Analysts are estimating that Banner will report an earnings per share (EPS) of $1.16.
The announcement from Banner is eagerly anticipated, with investors seeking news of surpassing estimates and favorable guidance for the next quarter.
It’s worth noting for new investors that guidance can be a key determinant of stock price movements.
Earnings History Snapshot
The company’s EPS beat by $0.04 in the last quarter, leading to a 1.35% drop in the share price on the following day.
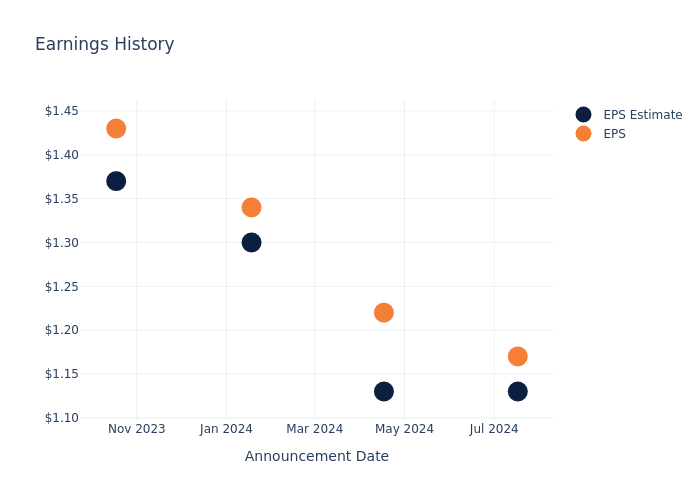
Here’s a look at Banner’s past performance and the resulting price change:
| Quarter | Q2 2024 | Q1 2024 | Q4 2023 | Q3 2023 |
|---|---|---|---|---|
| EPS Estimate | 1.13 | 1.13 | 1.30 | 1.37 |
| EPS Actual | 1.17 | 1.22 | 1.34 | 1.43 |
| Price Change % | -1.0% | 1.0% | -1.0% | 2.0% |
Stock Performance
Shares of Banner were trading at $64.28 as of October 14. Over the last 52-week period, shares are up 54.57%. Given that these returns are generally positive, long-term shareholders are likely bullish going into this earnings release.
To track all earnings releases for Banner visit their earnings calendar on our site.
This article was generated by Benzinga’s automated content engine and reviewed by an editor.
Market News and Data brought to you by Benzinga APIs
© 2024 Benzinga.com. Benzinga does not provide investment advice. All rights reserved.
D.R. Horton Unusual Options Activity
Investors with significant funds have taken a bearish position in D.R. Horton DHI, a development that retail traders should be aware of.
This was brought to our attention today through our monitoring of publicly accessible options data at Benzinga. The exact nature of these investors remains a mystery, but such a major move in DHI usually indicates foreknowledge of upcoming events.
Today, Benzinga’s options scanner identified 10 options transactions for D.R. Horton. This is an unusual occurrence. The sentiment among these large-scale traders is mixed, with 20% being bullish and 50% bearish. Of all the options we discovered, 9 are puts, valued at $283,812, and there was a single call, worth $48,990.
What’s The Price Target?
After evaluating the trading volumes and Open Interest, it’s evident that the major market movers are focusing on a price band between $185.0 and $195.0 for D.R. Horton, spanning the last three months.
Volume & Open Interest Trends
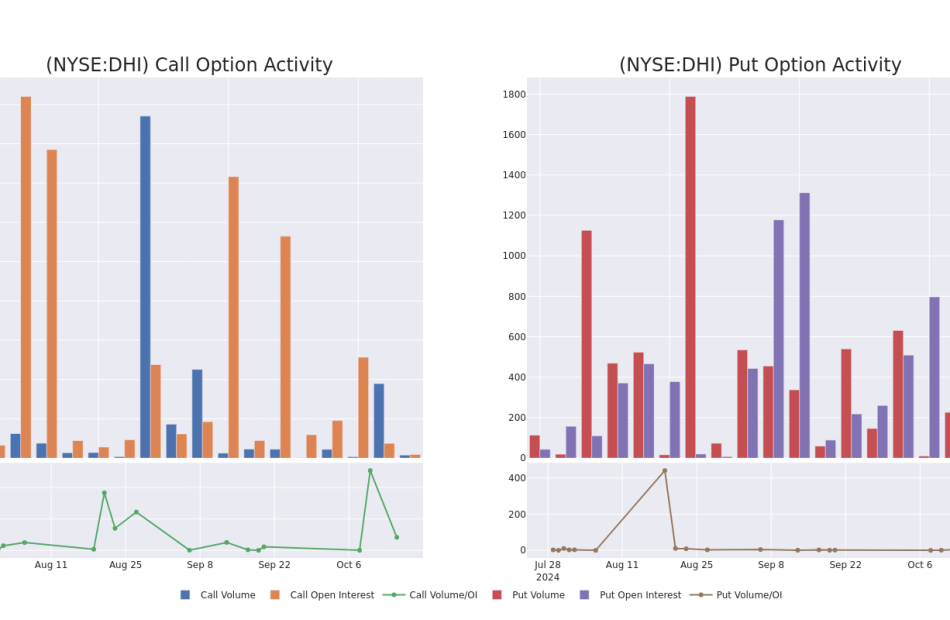
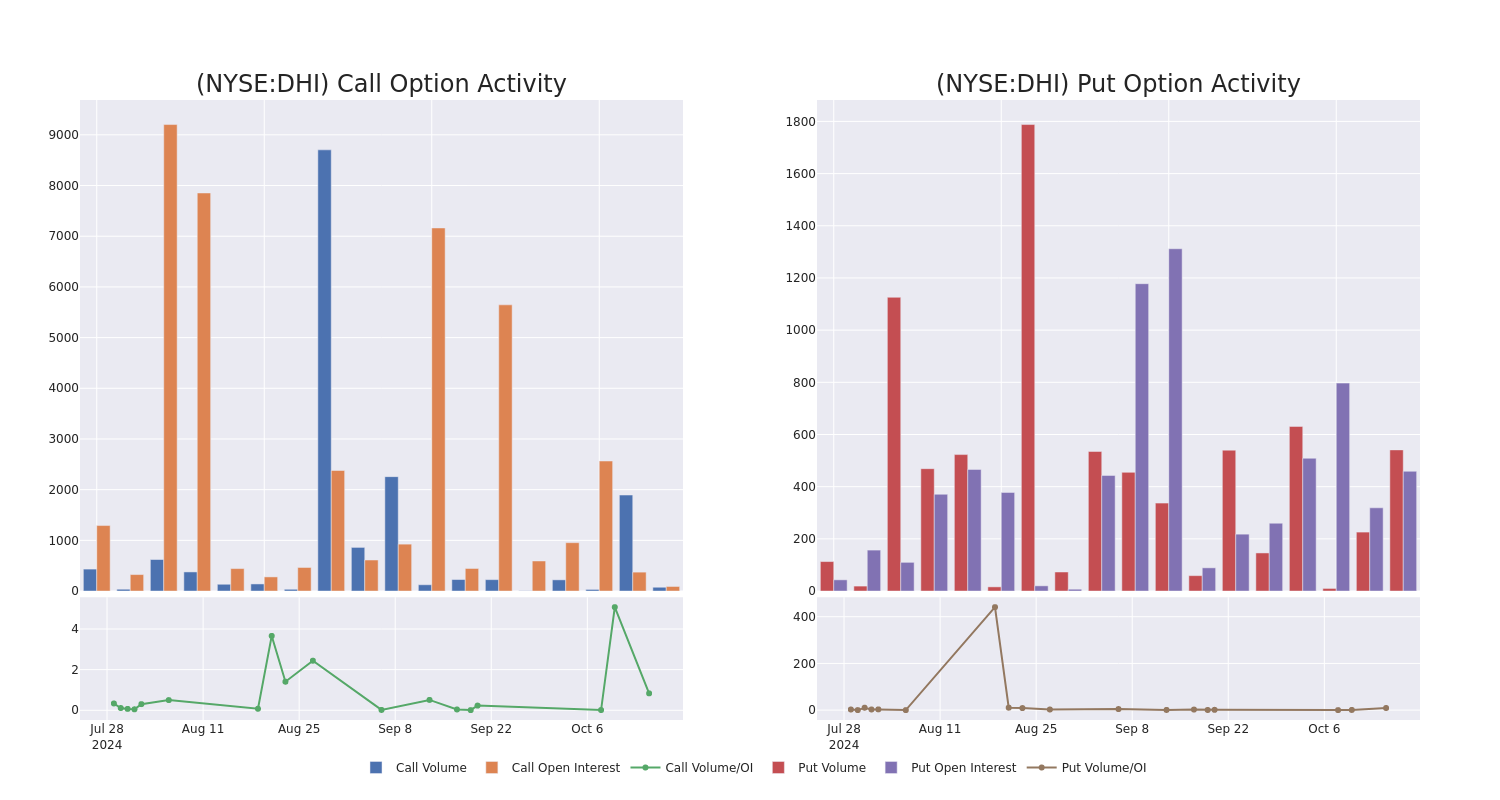
Looking at the volume and open interest is a powerful move while trading options. This data can help you track the liquidity and interest for D.R. Horton’s options for a given strike price. Below, we can observe the evolution of the volume and open interest of calls and puts, respectively, for all of D.R. Horton’s whale trades within a strike price range from $185.0 to $195.0 in the last 30 days.
D.R. Horton Call and Put Volume: 30-Day Overview
Significant Options Trades Detected:
| Symbol | PUT/CALL | Trade Type | Sentiment | Exp. Date | Ask | Bid | Price | Strike Price | Total Trade Price | Open Interest | Volume |
|---|---|---|---|---|---|---|---|---|---|---|---|
| DHI | CALL | TRADE | BEARISH | 10/25/24 | $7.4 | $6.9 | $6.9 | $185.00 | $48.9K | 90 | 75 |
| DHI | PUT | TRADE | NEUTRAL | 11/15/24 | $10.5 | $10.2 | $10.37 | $195.00 | $41.4K | 224 | 5 |
| DHI | PUT | SWEEP | BEARISH | 01/17/25 | $13.7 | $13.4 | $13.8 | $195.00 | $37.2K | 206 | 45 |
| DHI | PUT | SWEEP | BEARISH | 11/15/24 | $10.5 | $10.2 | $10.38 | $195.00 | $36.7K | 224 | 80 |
| DHI | PUT | SWEEP | BEARISH | 01/17/25 | $13.9 | $13.4 | $13.68 | $195.00 | $30.4K | 206 | 67 |
About D.R. Horton
D.R. Horton is a leading homebuilder in the United States with operations in 118 markets across 33 states. D.R. Horton mainly builds single-family detached homes (over 90% of home sales revenue) and offers products to entry-level, move-up, luxury buyers, and active adults. The company offers homebuyers mortgage financing and title agency services through its financial services segment. D.R. Horton’s headquarters are in Arlington, Texas, and it manages six regional segments across the United States.
Having examined the options trading patterns of D.R. Horton, our attention now turns directly to the company. This shift allows us to delve into its present market position and performance
Where Is D.R. Horton Standing Right Now?
- With a trading volume of 763,432, the price of DHI is up by 2.42%, reaching $191.63.
- Current RSI values indicate that the stock is is currently neutral between overbought and oversold.
- Next earnings report is scheduled for 14 days from now.
Expert Opinions on D.R. Horton
1 market experts have recently issued ratings for this stock, with a consensus target price of $215.0.
Unusual Options Activity Detected: Smart Money on the Move
Benzinga Edge’s Unusual Options board spots potential market movers before they happen. See what positions big money is taking on your favorite stocks. Click here for access.
* An analyst from B of A Securities has decided to maintain their Buy rating on D.R. Horton, which currently sits at a price target of $215.
Options are a riskier asset compared to just trading the stock, but they have higher profit potential. Serious options traders manage this risk by educating themselves daily, scaling in and out of trades, following more than one indicator, and following the markets closely.
If you want to stay updated on the latest options trades for D.R. Horton, Benzinga Pro gives you real-time options trades alerts.
Market News and Data brought to you by Benzinga APIs
© 2024 Benzinga.com. Benzinga does not provide investment advice. All rights reserved.
United Airlines Earnings Are Imminent; These Most Accurate Analysts Revise Forecasts Ahead Of Earnings Call
United Airlines Holdings, Inc. UAL will release earnings results for its third quarter before the opening bell on Tuesday, Oct. 15.
Analysts expect the Chicago, Illinois-based bank to report quarterly earnings at $3.17 per share, down from $3.65 per share in the year-ago period. United Airlines projects to report revenue of $14.78 billion for the recent quarter, compared to $14.44 billion a year earlier, according to data from Benzinga Pro.
The company, last week, unveiled its largest international expansion, adding service to eight new cities. Beginning in May 2025, the airline plans to launch five new nonstop flights from its Newark/New York hub to destinations not served by other U.S. airlines.
United Airlines shares gained 2.8% to close at $63.53 on Monday.
Benzinga readers can access the latest analyst ratings on the Analyst Stock Ratings page. Readers can sort by stock ticker, company name, analyst firm, rating change or other variables.
Let’s have a look at how Benzinga’s most-accurate analysts have rated the company in the recent period.
- Susquehanna analyst Christopher Stathoulopoulos maintained a Positive rating and raised the price target from $60 to $70 on Oct. 9. This analyst has an accuracy rate of 75%.
- Jefferies analyst Sheila Kahyaoglu maintained a Buy rating and raised the price target from $69 to $75 on Oct. 2. This analyst has an accuracy rate of 68%.
- Citigroup analyst Stephen Trent maintained a Buy rating and raised the price target from $80 to $96 on May 29. This analyst has an accuracy rate of 70%.
- Raymond James analyst Savanthi Syth maintained an Outperform rating and raised the price target from $66 to $70 on April 18. This analyst has an accuracy rate of 65%.
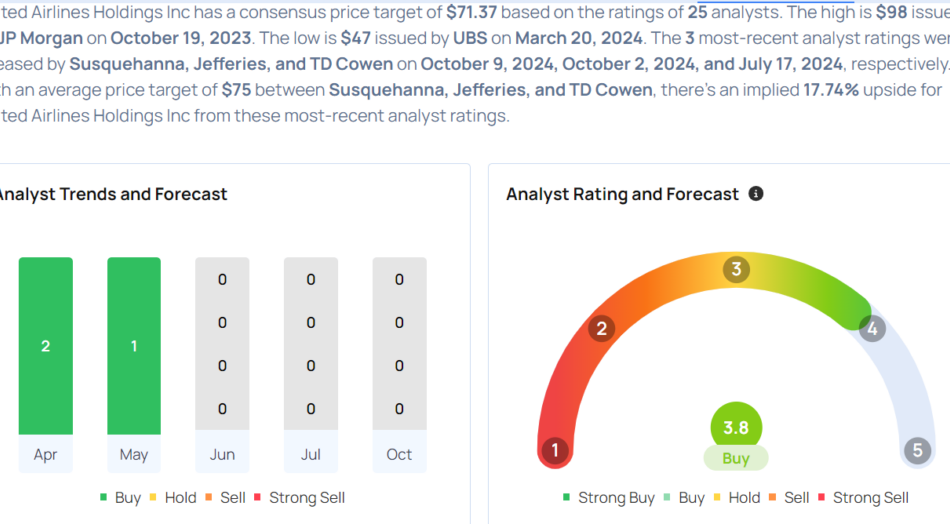
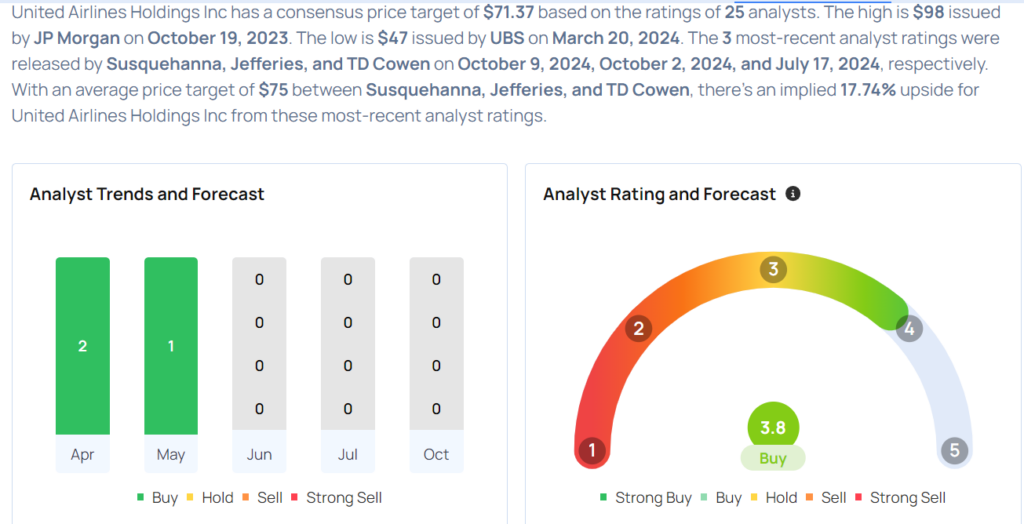
Considering buying UAL stock? Here’s what analysts think:
Read This Next:
Market News and Data brought to you by Benzinga APIs
© 2024 Benzinga.com. Benzinga does not provide investment advice. All rights reserved.

