A Closer Look at Dell Technologies's Options Market Dynamics
Whales with a lot of money to spend have taken a noticeably bearish stance on Dell Technologies.
Looking at options history for Dell Technologies DELL we detected 21 trades.
If we consider the specifics of each trade, it is accurate to state that 47% of the investors opened trades with bullish expectations and 52% with bearish.
From the overall spotted trades, 7 are puts, for a total amount of $522,999 and 14, calls, for a total amount of $1,086,671.
Predicted Price Range
Analyzing the Volume and Open Interest in these contracts, it seems that the big players have been eyeing a price window from $85.0 to $190.0 for Dell Technologies during the past quarter.
Volume & Open Interest Trends
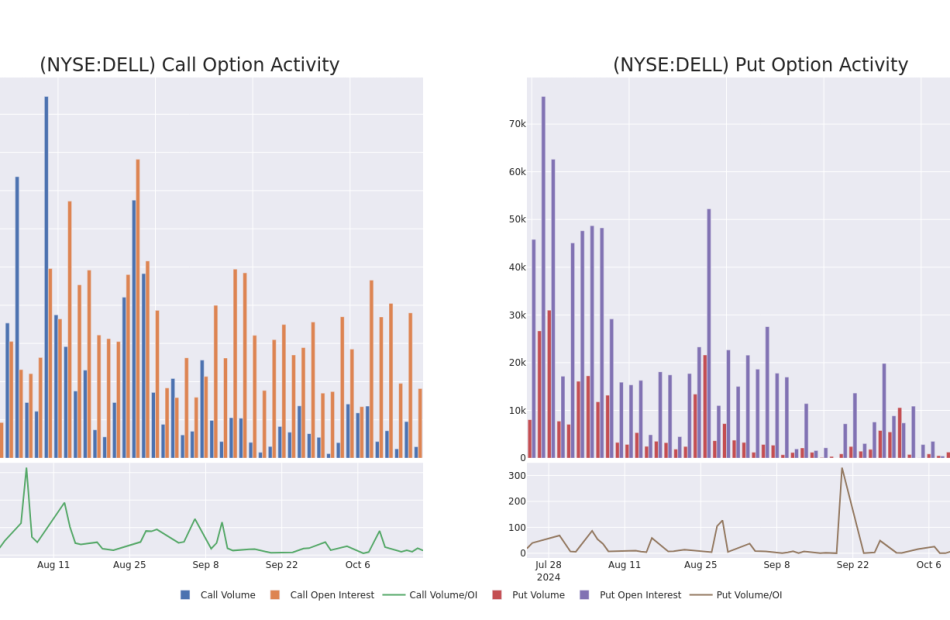
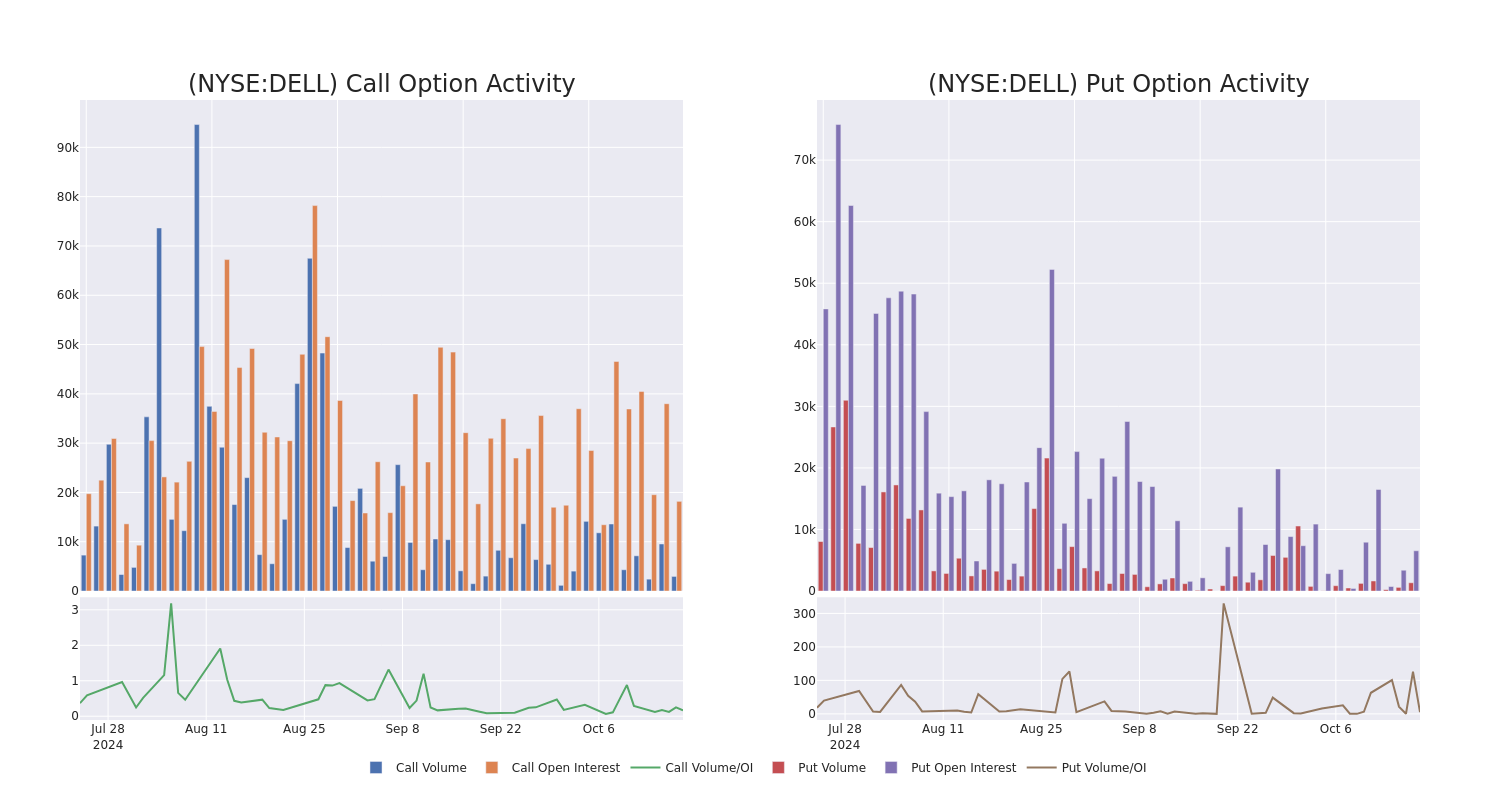
In today’s trading context, the average open interest for options of Dell Technologies stands at 1832.57, with a total volume reaching 2,199.00. The accompanying chart delineates the progression of both call and put option volume and open interest for high-value trades in Dell Technologies, situated within the strike price corridor from $85.0 to $190.0, throughout the last 30 days.
Dell Technologies Call and Put Volume: 30-Day Overview
Significant Options Trades Detected:
| Symbol | PUT/CALL | Trade Type | Sentiment | Exp. Date | Ask | Bid | Price | Strike Price | Total Trade Price | Open Interest | Volume |
|---|---|---|---|---|---|---|---|---|---|---|---|
| DELL | CALL | SWEEP | BULLISH | 06/20/25 | $46.15 | $45.95 | $46.0 | $85.00 | $317.4K | 406 | 180 |
| DELL | PUT | TRADE | BEARISH | 01/17/25 | $5.9 | $5.75 | $5.9 | $115.00 | $224.2K | 3.3K | 384 |
| DELL | CALL | SWEEP | BULLISH | 06/20/25 | $46.75 | $45.5 | $45.7 | $85.00 | $114.2K | 406 | 50 |
| DELL | CALL | TRADE | BULLISH | 06/20/25 | $45.7 | $45.5 | $45.7 | $85.00 | $114.2K | 406 | 0 |
| DELL | PUT | TRADE | BEARISH | 11/15/24 | $5.65 | $5.5 | $5.6 | $126.00 | $112.0K | 0 | 226 |
About Dell Technologies
Dell Technologies is a broad information technology vendor, primarily supplying hardware to enterprises. It is focused on premium and commercial personal computers and enterprise on-premises data center hardware. It holds top-three market shares in its core markets of personal computers, peripheral displays, mainstream servers, and external storage. Dell has a robust ecosystem of component and assembly partners, and also relies heavily on channel partners to fulfill its sales.
After a thorough review of the options trading surrounding Dell Technologies, we move to examine the company in more detail. This includes an assessment of its current market status and performance.
Dell Technologies’s Current Market Status
- With a trading volume of 1,692,355, the price of DELL is down by -0.23%, reaching $126.17.
- Current RSI values indicate that the stock is may be approaching overbought.
- Next earnings report is scheduled for 36 days from now.
Turn $1000 into $1270 in just 20 days?
20-year pro options trader reveals his one-line chart technique that shows when to buy and sell. Copy his trades, which have had averaged a 27% profit every 20 days. Click here for access.
Options are a riskier asset compared to just trading the stock, but they have higher profit potential. Serious options traders manage this risk by educating themselves daily, scaling in and out of trades, following more than one indicator, and following the markets closely.
If you want to stay updated on the latest options trades for Dell Technologies, Benzinga Pro gives you real-time options trades alerts.
Market News and Data brought to you by Benzinga APIs
© 2024 Benzinga.com. Benzinga does not provide investment advice. All rights reserved.
Gold extends record, silver jumps to 12-year high as precious metals outperform stock market
Gold and silver showed no sign of slowing their rise on Monday as investors continue to pour into precious metals.
Gold futures (GC=F) touched fresh records, rising as much as 0.8% to hover near highs of $2,750 per ounce. Silver futures (SI=F) gained more than 3% before paring gains, briefly topping $34 per ounce, the highest level in 12 years.
The two precious metals have outperformed the broader markets, with bullion rising 26% year to date and silver gaining 35% during the same period, compared to the S&P 500’s (^GSPC) gain of 19% since the start of 2024.
Gold purchases by central banks, which hit a record in the first quarter of 2024, have been one of the biggest drivers of the precious metal’s rise this year. BofA analysts estimate gold has surpassed the euro to become the world’s largest reserve asset, second only to the US dollar.
Investors have also flocked to physically backed gold exchange-traded funds, with inflow up three months in a row, according to the World Gold Council.
“I think it’s the declining inflation expectation and also the rotation of assets that tend to perform well with a more dovish Fed,” Phil Streible, Blue Line Futures chief market strategist, told Yahoo Finance on Monday morning.
The strategist sees gold reaching $2,850 by the end of the year.
Meanwhile, silver surged higher after gaining more than 6% on Friday. JPMorgan analysts cited sentiment at the recent London Bullion Market Association/London Platinum and Palladium Market conference, with attendees forecasting an average year-ahead price of $45 per ounce for the grey metal.
“This bullish view is driven by a sense that silver is undervalued vs gold, less crowded, and supported by multifaceted, versatile demand applications,” wrote JPMorgan analysts on Friday.
Silver is used across different industries, from electronics to fuel cells in automobile components and solar panels. The analysts see uncertainty ahead for the metal if former President Donald Trump were to win the presidential election.
“We are bullish silver ourselves, though for this strong silver outperformance to eventuate, we likely need to see industrial metals prices continue to rally in 2025, something that could get complicated under a Trump presidency and a hard line on tariffs early next year, despite Chinese stimulus,” said the note.
Ines Ferre is a senior business reporter for Yahoo Finance. Follow her on X at @ines_ferre.
Click here for in-depth analysis of the latest stock market news and events moving stock prices
Read the latest financial and business news from Yahoo Finance
Earnings Outlook For Trustmark
Trustmark TRMK will release its quarterly earnings report on Tuesday, 2024-10-22. Here’s a brief overview for investors ahead of the announcement.
Analysts anticipate Trustmark to report an earnings per share (EPS) of $0.82.
The announcement from Trustmark is eagerly anticipated, with investors seeking news of surpassing estimates and favorable guidance for the next quarter.
It’s worth noting for new investors that guidance can be a key determinant of stock price movements.
Overview of Past Earnings
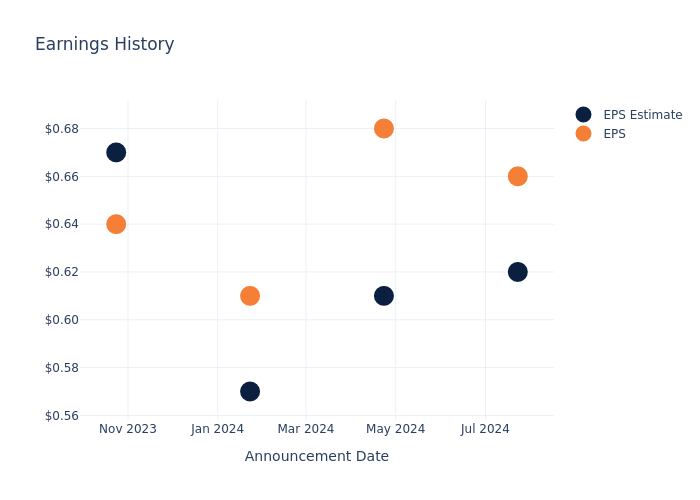
Last quarter the company beat EPS by $0.04, which was followed by a 2.44% drop in the share price the next day.
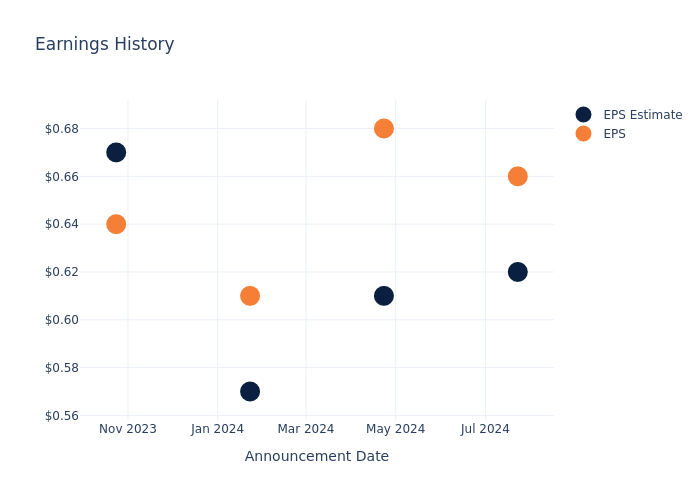
Here’s a look at Trustmark’s past performance and the resulting price change:
| Quarter | Q2 2024 | Q1 2024 | Q4 2023 | Q3 2023 |
|---|---|---|---|---|
| EPS Estimate | 0.62 | 0.61 | 0.57 | 0.67 |
| EPS Actual | 0.66 | 0.68 | 0.61 | 0.64 |
| Price Change % | -2.0% | 7.000000000000001% | -1.0% | -6.0% |
Market Performance of Trustmark’s Stock
Shares of Trustmark were trading at $34.68 as of October 18. Over the last 52-week period, shares are up 66.26%. Given that these returns are generally positive, long-term shareholders are likely bullish going into this earnings release.
To track all earnings releases for Trustmark visit their earnings calendar on our site.
This article was generated by Benzinga’s automated content engine and reviewed by an editor.
Market News and Data brought to you by Benzinga APIs
© 2024 Benzinga.com. Benzinga does not provide investment advice. All rights reserved.
BHP trying to avoid responsibility over Brazilian dam collapse, UK court told
By Sam Tobin
LONDON (Reuters) -BHP is cynically trying to avoid its responsibility for Brazil’s worst environmental disaster, lawyers representing thousands of victims told London’s High Court on Monday, as a lawsuit worth up to 36 billion pounds ($47 billion) began.
More than 600,000 Brazilians, 46 local governments and around 2,000 businesses are suing BHP over the 2015 collapse of the Mariana dam in southeastern Brazil, which was owned and operated by BHP and Vale’s Samarco joint venture.
The dam’s collapse unleashed a wave of toxic sludge that killed 19 people, left thousands homeless, flooded forests and polluted the length of the Doce River.
BHP, the world’s biggest miner by market value, is contesting liability and says the London lawsuit duplicates legal proceedings and reparation and repair programmes in Brazil and should be thrown out.
It also says nearly $8 billion has already been paid to those affected through the Renova Foundation, with around $1.7 billion going to claimants involved in the English case.
The lawsuit, one of the largest in English legal history, entered a decisive stage on Monday with the beginning of a 12-week trial to determine whether BHP is liable.
The claimants’ lawyer Alain Choo Choy said in court filings made public on Monday that “there is a chasm between what BHP regards as ‘acceptable’ and the compensation to which the claimants consider themselves legally and morally entitled”.
He argued that BHP’s actions in fighting the case and funding separate litigation in Brazil showed the miner was “cynically and doggedly trying to avoid” responsibility.
“Although that is BHP’s choice, it cannot properly now claim to be a company ‘doing the right thing’ by the victims of the disaster,” Choo Choy added.
‘EXAGGERATED’
BHP argues it did not own or operate the dam, which held minings waste known as tailings. It said a Brazilian subsidiary of its Australian holding company was a 50% shareholder in Samarco, which operated independently.
The miner also said it had no knowledge the dam’s stability was compromised before it collapsed.
Lawyers representing the miner said in court filings: “There is no law or contract which imposed any duty of safety on the ultimate parent company of a non-controlling shareholder and the other parent company in the same corporate group.
“Nor was there any breach of such duty of safety. And nor did BHP’s acts or omissions cause the collapse.”
BHP also said that parts of the lawsuit were “implausible or exaggerated”.
I’m 63, retired and getting $45,000 per year. But I only have about $200,000 in my IRA and still have a mortgage. What’s my move?
MarketWatch Picks highlights items we think you’ll find useful; we are independent of the MarketWatch newsroom. We might earn a commission from links in this content. Learn more
Question: “At 63 years old, I am concerned over my retirement income. I retired at 60, with a passive income of about $45,000 per year, and started receiving $1,500 per month in Social Security at 62. My income is from rental properties with long-term leases that should extend through my 70s. I managed to put about $200,000 into an IRA. My mortgage is about $450 a month, plus taxes and insurance, with 10 years remaining. What options do I have to increase my portfolio and ensure my financial security for the next 15 years?”
Answer: You have a lot to consider here — and you may want to have a financial adviser help you make a plan to help your money grow and last throughout retirement, pros say. But before we go into whether to get a financial planner or not, let’s look at your situation and see what risks you might be facing that you should think about.
Some of your biggest risks are general inflation, renter risk — the potential for a tenant to have a negative impact — and long-term care costs, says Mark Struthers, a certified financial planner and founder of Sona Wealth Advisors.
Inflation risk: To outpace inflation, you’ll want to be sure your money is hard at work. Look at how that IRA is invested and whether that aligns with your long-term goals, suggests Ryan Haiss, a certified financial planner and co-founder of Flynn Zito Capital Management. “I often see DIY investors overexposed to certain sectors, such as technology, or taking on more risk than they realize,” Haiss says. “While that may work well in strong markets, it can be detrimental during downturns. An adviser can help review your investment strategy to ensure it aligns with your long-term goals.”
A Look at Hanmi Financial's Upcoming Earnings Report
Hanmi Financial HAFC is preparing to release its quarterly earnings on Tuesday, 2024-10-22. Here’s a brief overview of what investors should keep in mind before the announcement.
Analysts expect Hanmi Financial to report an earnings per share (EPS) of $0.48.
Investors in Hanmi Financial are eagerly awaiting the company’s announcement, hoping for news of surpassing estimates and positive guidance for the next quarter.
It’s worth noting for new investors that stock prices can be heavily influenced by future projections rather than just past performance.
Earnings History Snapshot
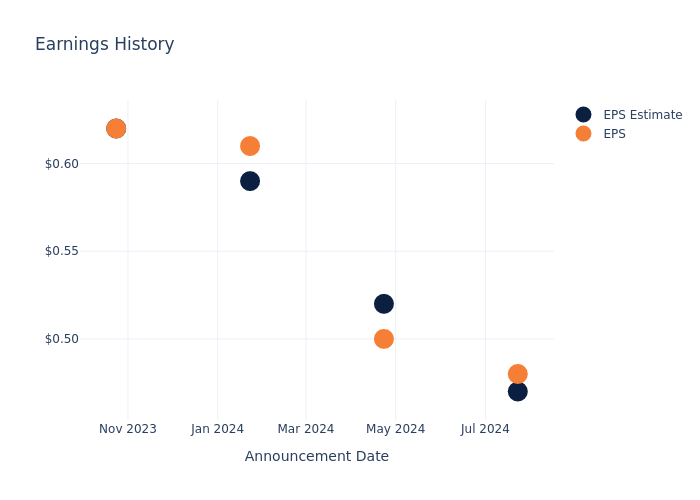
The company’s EPS beat by $0.01 in the last quarter, leading to a 6.23% drop in the share price on the following day.
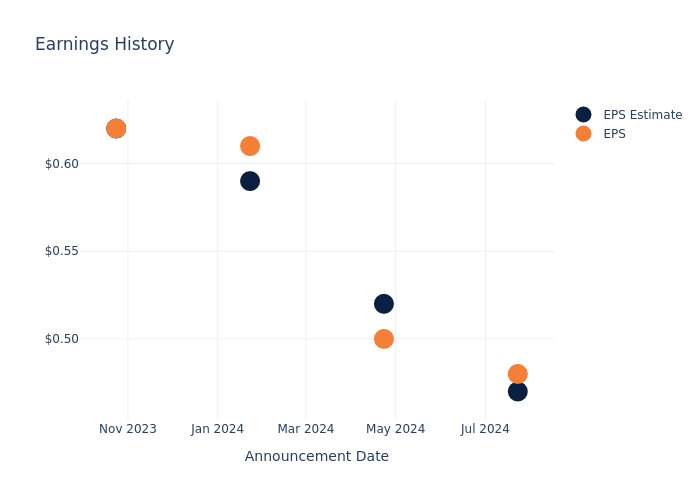
Here’s a look at Hanmi Financial’s past performance and the resulting price change:
| Quarter | Q2 2024 | Q1 2024 | Q4 2023 | Q3 2023 |
|---|---|---|---|---|
| EPS Estimate | 0.47 | 0.52 | 0.59 | 0.62 |
| EPS Actual | 0.48 | 0.50 | 0.61 | 0.62 |
| Price Change % | -6.0% | -3.0% | -9.0% | -4.0% |
Tracking Hanmi Financial’s Stock Performance
Shares of Hanmi Financial were trading at $20.65 as of October 18. Over the last 52-week period, shares are up 37.45%. Given that these returns are generally positive, long-term shareholders are likely bullish going into this earnings release.
To track all earnings releases for Hanmi Financial visit their earnings calendar on our site.
This article was generated by Benzinga’s automated content engine and reviewed by an editor.
Market News and Data brought to you by Benzinga APIs
© 2024 Benzinga.com. Benzinga does not provide investment advice. All rights reserved.
Truck Cranes Market is Projected to Reach US$ 14.9 Billion with a Steady 5% CAGR by 2033 | Fact.MR Report
Rockville, MD, Oct. 21, 2024 (GLOBE NEWSWIRE) — Climbing at a CAGR of 5%, the global truck cranes market is projected to reach a valuation of US$ 14.9 billion by the end of the study period (2023 to 2033). This study by Fact.MR, a market research and competitive intelligence provider, projects the construction sector to account for a majority of truck crane sales over the next ten years.
Demand for construction equipment that saves time and money is increasing rapidly around the world and in a bid to accommodate this demand, manufacturers are integrating multiple operations in equipment to deliver higher productivity. The development of a purpose-built chassis is another prominent trend wherein the feasible integration of standard components, ranging from tires to engines, reduces maintenance costs.
To deliver cost-efficient and easily maneuverable equipment, manufacturers of truck cranes are combining better-lifting capacities with easier transport. Integration of different equipment and technologies is a trend that many truck crane suppliers are opting for as they try to boost their sales potential.
In April 2020, W&W Energy Services (W&W), announced the launch of its Knuckle Boom Crane Truck, which was made by integrating the Palfinger 110002 high-performance hydraulic knuckle boom crane with a 2019 Kenworth K900 Tractor.
For More Insights into the Market, Request a Sample of this Report-https://www.factmr.com/connectus/sample?flag=S&rep_id=2169

Key Takeaways from Market Study
- The global truck cranes market stands at a valuation of US$ 9.1 billion in 2023.
- Demand for truck cranes is projected to expand at a healthy CAGR of 5% from 2023 to 2033.
- The market is forecasted to reach a size of US$ 14.9 billion by 2033.
- Rapid industrialization and urbanization, high spending on infrastructure development, upgradation of energy grids, and development of mobile cranes with high lifting capacities are key market drivers.
- High cost of truck cranes is estimated to be a key growth limiting factor for global market growth over the coming years.
- Developing economies in the Asia Pacific region are projected to emerge as highly remunerative markets for truck crane manufacturers in the future.
- Most truck crane sales are estimated to come from the construction sector.
“India, China, and Brazil are markets that truck crane companies should not miss out on if they want to make it into the big leagues of this business,” says a Fact.MR analyst
Leading Players Driving Innovation in the Truck Crane Market:
Liebherr Group, Kato Works Co. Ltd., Sany Heavy Industry Co. Ltd., Tadano Ltd., The Manitowoc Company Inc., XCMG Construction Machinery Co., Ltd., Elliott Equipment Company, Böcker Maschinenwerke GmbH, Terex Corporation, Manitex International Inc.
Winning Strategy:
Top truck crane brands are focusing on launching new products that are compliant with modern emission mandates without compromising productivity. Companies are also experimenting with electric power to create 100% electric mobile cranes as the focus on sustainability around the world increases.
Truck Crane Industry News:
In March 2023, Manitex International Inc., a renowned name in the truck cranes industry, announced the launch of its new truck crane. The new TC850 Series truck-mounted crane features an 85-tonne capacity high-reach truck crane that eliminates the need for a front jack.
Get Customization on this Report for Specific Research Solutions-https://www.factmr.com/connectus/sample?flag=S&rep_id=2169
More Valuable Insights on Offer
Fact.MR, in its new offering, presents an unbiased analysis of the global truck cranes market, presenting historical demand data (2018 to 2022) and forecast statistics for the period (2023 to 2033).
The study divulges essential insights on the market based on lifting capacity (tonnes) (<150, 150 to 300, >300), end use (commercial, construction sites, industrial, forestry, shipyards, others), and type (mounted cranes, sidelift cranes, boom truck cranes, others), across five major regions of the world (North America, Europe, Asia Pacific, Latin America, and MEA).
Checkout More Related Studies Published by Fact.MR Research:
The global motorized quadricycle market is set to reach US$ 1.21 billion in 2024 and expand at a CAGR of 14.7% to end up at US$ 4.76 billion by the end of 2034.
Expanding at a CAGR of 4.4%, the global logging trailer market is projected to increase from US$ 535.6 million in 2024 to US$ 823.8 million by the end of 2034.
The global compact wheel loader market is set to reach a value of US$ 40.64 billion in 2024. Projections are that the market will expand at a CAGR of 5.1% to end up at US$ 66.83 billion by the year 2034.
Worldwide revenue from the automotive automatic transmission market is estimated at US$ 76.11 billion in 2024 and has been forecasted to increase at 3.6% CAGR to climb to US$ 122.81 billion by the end of 2034.
Worldwide revenue from the electric vehicle market is estimated at US$ 442.34 billion in 2024 and has been projected to increase at a CAGR of 14% to reach US$ 1,639.84 billion by the end of 2034.
About Us:
Fact.MR is a distinguished market research company renowned for its comprehensive market reports and invaluable business insights. As a prominent player in business intelligence, we deliver deep analysis, uncovering market trends, growth paths, and competitive landscapes. Renowned for its commitment to accuracy and reliability, we empower businesses with crucial data and strategic recommendations, facilitating informed decision-making and enhancing market positioning. With its unwavering dedication to providing reliable market intelligence, FACT.MR continues to assist companies in navigating dynamic market challenges with confidence and achieving long-term success. With a global presence and a team of experienced analysts, FACT.MR ensures its clients receive actionable insights to capitalize on emerging opportunities and stay ahead in the competitive landscape.
Contact:
US Sales Office:
11140 Rockville Pike
Suite 400
Rockville, MD 20852
United States
Tel: +1 (628) 251-1583
Sales Team: sales@factmr.com
Follow Us: LinkedIn | Twitter | Blog

© 2024 Benzinga.com. Benzinga does not provide investment advice. All rights reserved.
Investors Lost Over 95% Of Their Wealth In This Nvidia-Linked ETF While Jensen Huang-Led Chip Giant Gained 220% In The Past Year: Here's More
Benzinga and Yahoo Finance LLC may earn commission or revenue on some items through the links below.
Investors in the T-Rex 2X Inverse Nvidia Daily Target ETF (BATS:NVDQ) are grappling with significant losses as shares of Jensen Huang-led Nvidia Corp. (NASDAQ:NVDA) experience a remarkable stock surge.
As per Benzinga Pro, the T-Rex ETF has seen a dramatic 96% decline in investor wealth over the past year. This stark contrast comes as Nvidia’s stock has soared by 221.08% during the same timeframe.
Don’t Miss:
-
This billion-dollar fund has invested in the next big real estate boom, here’s how you can join for $10.
This is a paid advertisement. Carefully consider the investment objectives, risks, charges and expenses of the Fundrise Flagship Fund before investing. This and other information can be found in the Fund’s prospectus. Read them carefully before investing.
However, it is noteworthy that the T-Rex ETF is designed to achieve daily inverse investment results, meaning its long-term performance may not mirror Nvidia’s stock trends. It aims for a daily return of 200% of the inverse of Nvidia’s daily performance, setting it apart from conventional ETFs.
Simply put, this ETF is designed to gain value when Nvidia’s stock price decreases and lose value when Nvidia’s stock price increases. It achieves this by using derivatives, such as options or futures, to bet against Nvidia’s stock performance.
Meanwhile, Nvidia remains a leader in the chip industry, with its shares closing up 0.8% at $138 on Friday, boosting its market capitalization to over $3 trillion. Experts like Ram Ahluwalia from Lumida Wealth Management are optimistic about Nvidia’s potential to reach a $4 trillion valuation, citing strong demand for GPU chips.
Additionally, Dan Niles of Niles Investment Management forecasts that Nvidia’s revenues and stock could double in the coming years, driven by AI investments. Goldman Sachs and Bofa Securities have also increased their price targets for Nvidia, reflecting confidence in its growth prospects.
The changing interest rate environment has created an incredible opportunity for income-seeking investors to earn massive yields, but not through dividend stocks… Certain private market real estate investments are giving retail investors the opportunity to capitalize on these high-yield opportunities and Benzinga has identified some of the most attractive options for you to consider.
For instance, the Ascent Income Fund from EquityMultiple targets stable income from senior commercial real estate debt positions and has a historical distribution yield of 12.1% backed by real assets. With payment priority and flexible liquidity options, the Ascent Income Fund is a cornerstone investment vehicle for income-focused investors. First-time investors with EquityMultiple can now invest in the Ascent Income Fund with a reduced minimum of just $5,000. Benzinga Readers: Earn a 1% return boost on your first EquityMultiple investment when you sign up here (accredited investors only).
Ontario Energy Association (OEA) Supports Government of Ontario's Connecting Housing Plan
TORONTO, Oct. 21, 2024 /CNW/ – The Ontario Energy Association (OEA) supports the Government of Ontario’s direction to connect housing more quickly. “The government’s plan to reduce barriers to connecting new housing to the electricity grid will help reduce costs for new homeowners, renters and businesses” said Vince Brescia, President and CEO of the Ontario Energy Association. “The government’s proposals will help make new housing more affordable and ensure businesses can get quick and affordable access to electricity”.
In a statement released on Monday morning, Minister of Energy and Electrification Stephen Lecce said the government intends to introduce changes to the Ontario Energy Board Act. 1998 for enhanced to regulation making authority. In addition, Minister Lecce has instructed the Ontario Energy Board (OEB) to implement all the recommendations in its Housing Connection Report.
The recommendations include:
- Amending the Distribution System Code (DSC) to extend the revenue horizon for connecting residential developments from 25 years up to 40 years, allowing the costs of new infrastructure that will serve this province for generations to be spread over a longer period.
- Amending the DSC to provide clarity regarding the conditions under which a local distribution company should extend the connection horizon for new developments.
- Establishing a new capacity allocation model that considers multi customer, multi-year projects.
The government of Ontario has established a goal of building 1.5 million additional homes in Ontario by 2031. “The OEA and its members look forward to working collaboratively with both Minister Lecce and the OEB in ensuring that these new measures are implemented efficiently,” said Mr. Brescia.
About the OEA
The OEA is the credible and trusted voice of the energy sector. We earn our reputation by being an integral and influential part of energy policy development and decision making in Ontario. We represent Ontario’s energy leaders that span the full diversity of the energy industry. Learn more at www.energyontario.ca.
SOURCE Ontario Energy Association (OEA)

![]() View original content to download multimedia: http://www.newswire.ca/en/releases/archive/October2024/21/c0238.html
View original content to download multimedia: http://www.newswire.ca/en/releases/archive/October2024/21/c0238.html
Market News and Data brought to you by Benzinga APIs
© 2024 Benzinga.com. Benzinga does not provide investment advice. All rights reserved.
A Closer Look at DoorDash's Options Market Dynamics
Investors with a lot of money to spend have taken a bullish stance on DoorDash DASH.
And retail traders should know.
We noticed this today when the trades showed up on publicly available options history that we track here at Benzinga.
Whether these are institutions or just wealthy individuals, we don’t know. But when something this big happens with DASH, it often means somebody knows something is about to happen.
So how do we know what these investors just did?
Today, Benzinga‘s options scanner spotted 27 uncommon options trades for DoorDash.
This isn’t normal.
The overall sentiment of these big-money traders is split between 62% bullish and 22%, bearish.
Out of all of the special options we uncovered, 2 are puts, for a total amount of $69,725, and 25 are calls, for a total amount of $1,832,170.
What’s The Price Target?
Taking into account the Volume and Open Interest on these contracts, it appears that whales have been targeting a price range from $125.0 to $210.0 for DoorDash over the last 3 months.
Analyzing Volume & Open Interest
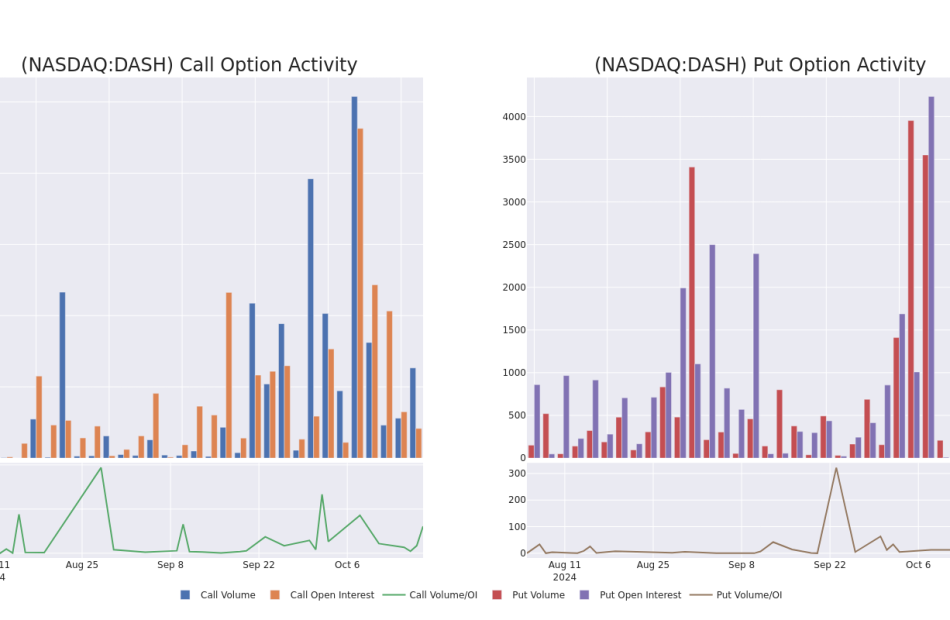
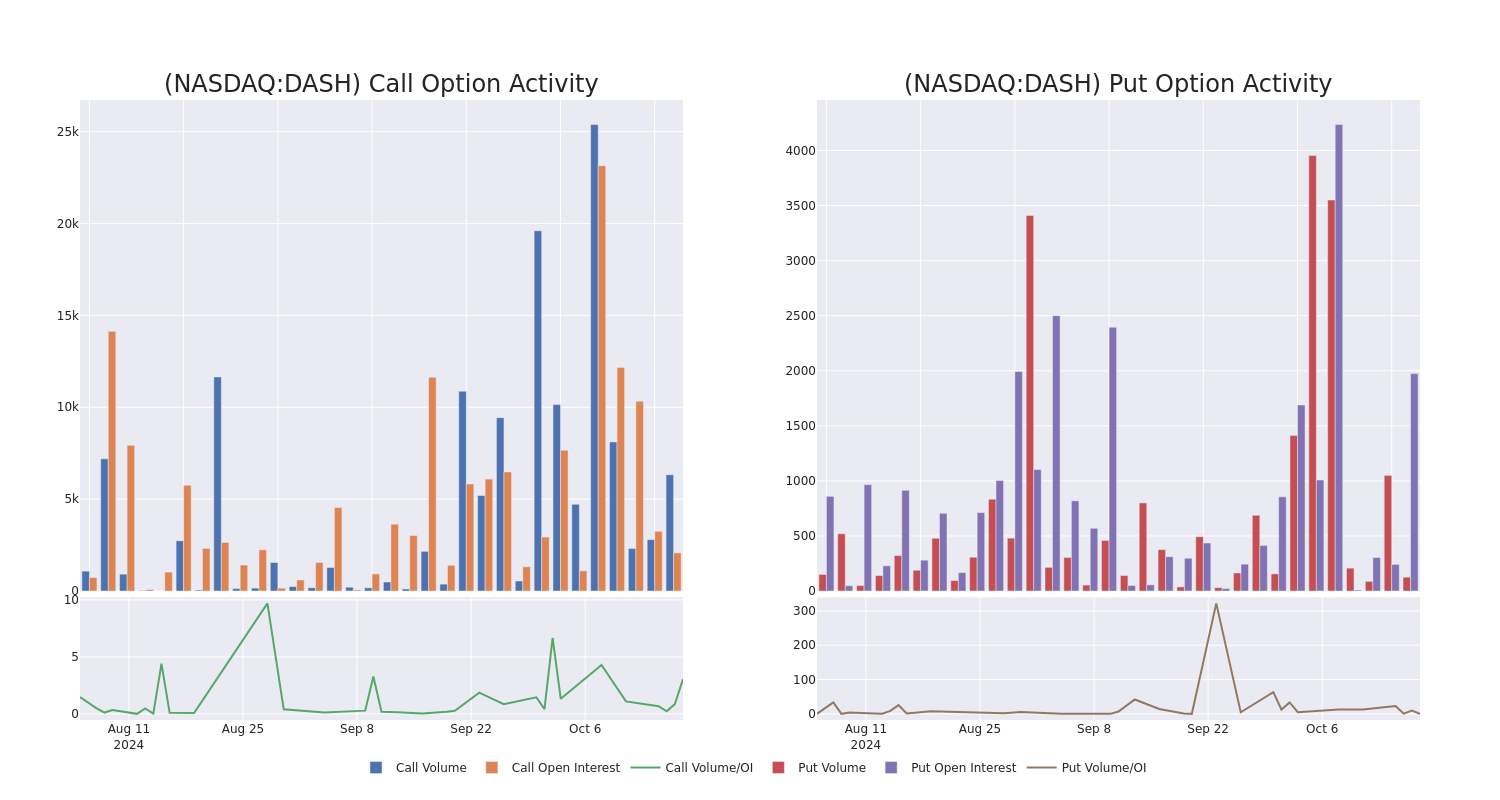
Looking at the volume and open interest is a powerful move while trading options. This data can help you track the liquidity and interest for DoorDash’s options for a given strike price. Below, we can observe the evolution of the volume and open interest of calls and puts, respectively, for all of DoorDash’s whale trades within a strike price range from $125.0 to $210.0 in the last 30 days.
DoorDash Call and Put Volume: 30-Day Overview
Largest Options Trades Observed:
| Symbol | PUT/CALL | Trade Type | Sentiment | Exp. Date | Ask | Bid | Price | Strike Price | Total Trade Price | Open Interest | Volume |
|---|---|---|---|---|---|---|---|---|---|---|---|
| DASH | CALL | SWEEP | BULLISH | 11/15/24 | $23.9 | $23.9 | $23.9 | $130.00 | $423.0K | 1.6K | 177 |
| DASH | CALL | SWEEP | BULLISH | 11/15/24 | $23.5 | $23.5 | $23.5 | $130.00 | $279.6K | 1.6K | 470 |
| DASH | CALL | SWEEP | BULLISH | 11/15/24 | $23.8 | $23.8 | $23.8 | $130.00 | $211.8K | 1.6K | 224 |
| DASH | CALL | SWEEP | BULLISH | 11/15/24 | $23.9 | $23.4 | $23.4 | $130.00 | $65.5K | 1.6K | 500 |
| DASH | CALL | TRADE | BULLISH | 01/17/25 | $30.25 | $30.15 | $30.25 | $125.00 | $60.5K | 1.3K | 182 |
About DoorDash
Founded in 2013 and headquartered in San Francisco, DoorDash is an online food order demand aggregator. Consumers can use its app to order food on-demand for pickup or delivery from merchants mainly in the US. Through the acquisition of Wolt in 2022, the firm also provides this service in Europe. DoorDash provides a marketplace for the merchants to create a presence online, market their offerings, and meet demand by making the offerings available for pickup or delivery. The firm provides similar service to businesses in addition to restaurants, such as grocery, retail, pet supplies, and flowers.
Following our analysis of the options activities associated with DoorDash, we pivot to a closer look at the company’s own performance.
Present Market Standing of DoorDash
- Trading volume stands at 991,640, with DASH’s price up by 0.25%, positioned at $152.36.
- RSI indicators show the stock to be is currently neutral between overbought and oversold.
- Earnings announcement expected in 9 days.
What Analysts Are Saying About DoorDash
5 market experts have recently issued ratings for this stock, with a consensus target price of $155.4.
Unusual Options Activity Detected: Smart Money on the Move
Benzinga Edge’s Unusual Options board spots potential market movers before they happen. See what positions big money is taking on your favorite stocks. Click here for access.
* An analyst from Cantor Fitzgerald downgraded its action to Overweight with a price target of $160.
* In a cautious move, an analyst from Raymond James downgraded its rating to Outperform, setting a price target of $155.
* Consistent in their evaluation, an analyst from Oppenheimer keeps a Outperform rating on DoorDash with a target price of $160.
* Reflecting concerns, an analyst from Cantor Fitzgerald lowers its rating to Overweight with a new price target of $160.
* Consistent in their evaluation, an analyst from Wells Fargo keeps a Equal-Weight rating on DoorDash with a target price of $142.
Options trading presents higher risks and potential rewards. Astute traders manage these risks by continually educating themselves, adapting their strategies, monitoring multiple indicators, and keeping a close eye on market movements. Stay informed about the latest DoorDash options trades with real-time alerts from Benzinga Pro.
Market News and Data brought to you by Benzinga APIs
© 2024 Benzinga.com. Benzinga does not provide investment advice. All rights reserved.

