Looking At Newmont's Recent Unusual Options Activity
Whales with a lot of money to spend have taken a noticeably bullish stance on Newmont.
Looking at options history for Newmont NEM we detected 27 trades.
If we consider the specifics of each trade, it is accurate to state that 55% of the investors opened trades with bullish expectations and 37% with bearish.
From the overall spotted trades, 4 are puts, for a total amount of $140,066 and 23, calls, for a total amount of $1,365,528.
Predicted Price Range
After evaluating the trading volumes and Open Interest, it’s evident that the major market movers are focusing on a price band between $25.0 and $75.0 for Newmont, spanning the last three months.
Insights into Volume & Open Interest
In terms of liquidity and interest, the mean open interest for Newmont options trades today is 6327.86 with a total volume of 6,563.00.
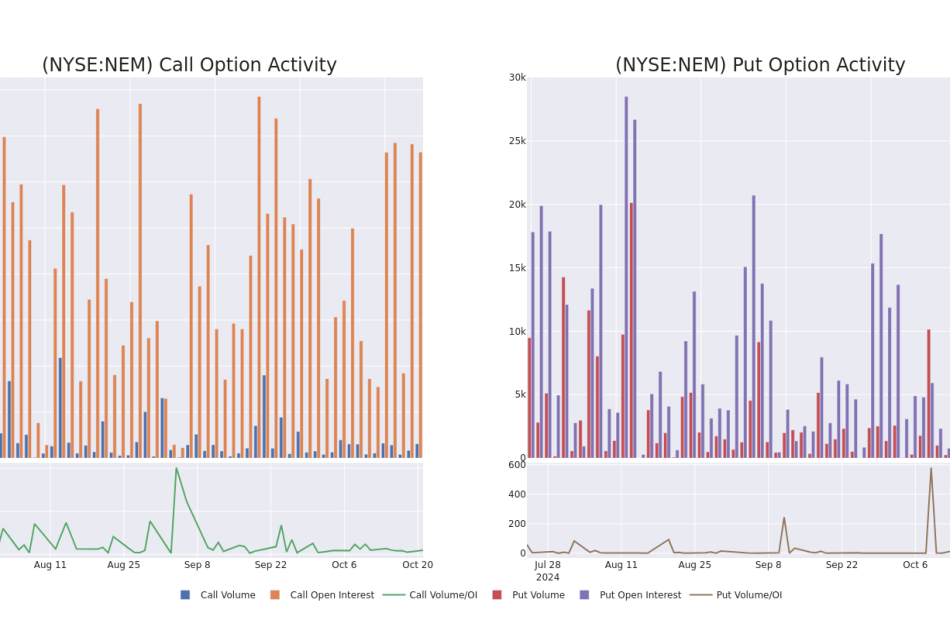
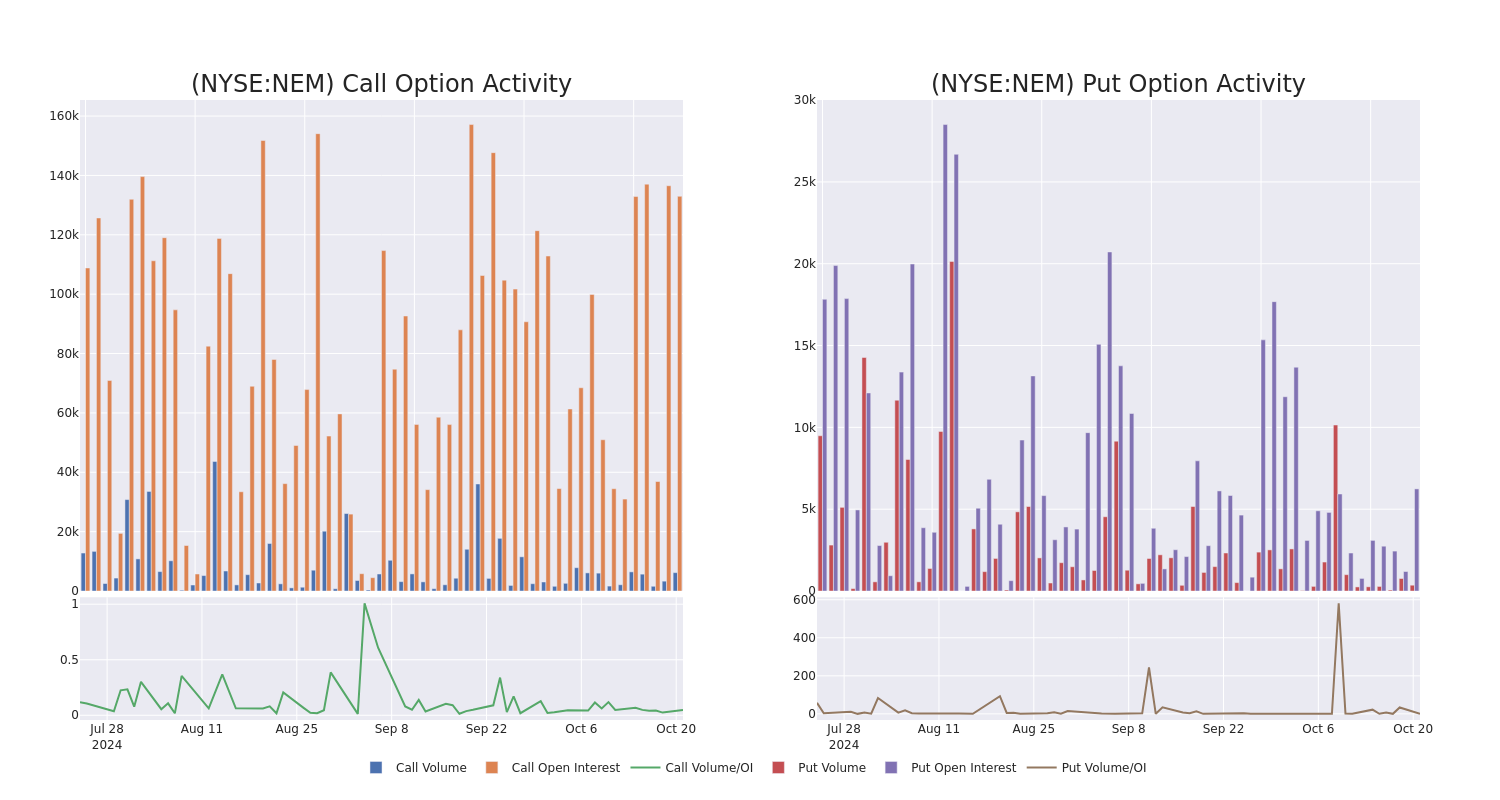
In the following chart, we are able to follow the development of volume and open interest of call and put options for Newmont’s big money trades within a strike price range of $25.0 to $75.0 over the last 30 days.
Newmont Call and Put Volume: 30-Day Overview
Largest Options Trades Observed:
| Symbol | PUT/CALL | Trade Type | Sentiment | Exp. Date | Ask | Bid | Price | Strike Price | Total Trade Price | Open Interest | Volume |
|---|---|---|---|---|---|---|---|---|---|---|---|
| NEM | CALL | TRADE | BULLISH | 01/16/26 | $18.45 | $18.15 | $18.37 | $42.50 | $183.7K | 1.6K | 118 |
| NEM | CALL | TRADE | BEARISH | 01/16/26 | $13.45 | $13.35 | $13.35 | $50.00 | $132.1K | 4.6K | 333 |
| NEM | CALL | TRADE | BEARISH | 01/16/26 | $13.4 | $13.35 | $13.35 | $50.00 | $132.1K | 4.6K | 134 |
| NEM | CALL | TRADE | NEUTRAL | 03/21/25 | $19.05 | $18.75 | $18.9 | $40.00 | $94.4K | 368 | 50 |
| NEM | CALL | TRADE | BULLISH | 03/21/25 | $4.2 | $4.15 | $4.2 | $60.00 | $84.0K | 2.2K | 433 |
About Newmont
Newmont is the world’s largest gold miner. It bought Goldcorp in 2019, combined its Nevada mines in a joint venture with competitor Barrick later that year, and also purchased competitor Newcrest in November 2023. Its portfolio includes 17 wholly or majority owned mines and interests in two joint ventures in the Americas, Africa, Australia and Papua New Guinea. The company is expected to produce roughly 6.9 million ounces of gold in 2024. However, after buying Newcrest, Newmont is likely to sell a number of its higher cost, smaller mines accounting for 20% of forecast sales in 2024. Newmont also produces material amounts of copper, silver, zinc, and lead as byproducts. It had about two decades of gold reserves along with significant byproduct reserves at the end of December 2023.
Having examined the options trading patterns of Newmont, our attention now turns directly to the company. This shift allows us to delve into its present market position and performance
Where Is Newmont Standing Right Now?
- With a volume of 4,291,434, the price of NEM is up 0.35% at $57.82.
- RSI indicators hint that the underlying stock may be approaching overbought.
- Next earnings are expected to be released in 2 days.
What Analysts Are Saying About Newmont
2 market experts have recently issued ratings for this stock, with a consensus target price of $65.0.
Unusual Options Activity Detected: Smart Money on the Move
Benzinga Edge’s Unusual Options board spots potential market movers before they happen. See what positions big money is taking on your favorite stocks. Click here for access.
* An analyst from Jefferies has decided to maintain their Buy rating on Newmont, which currently sits at a price target of $63.
* An analyst from UBS persists with their Buy rating on Newmont, maintaining a target price of $67.
Options trading presents higher risks and potential rewards. Astute traders manage these risks by continually educating themselves, adapting their strategies, monitoring multiple indicators, and keeping a close eye on market movements. Stay informed about the latest Newmont options trades with real-time alerts from Benzinga Pro.
Market News and Data brought to you by Benzinga APIs
© 2024 Benzinga.com. Benzinga does not provide investment advice. All rights reserved.
Bitcoin Flirts With $70,000 After $2.4 Billion Inflow Into ETFs
(Bloomberg) — Bitcoin came close to $70,000 on Monday as a spurt of inflows into exchange-traded funds for the largest digital asset as well as optimism about the outlook for US regulations supported sentiment.
Most Read from Bloomberg
The cryptocurrency rose 1% before paring some of the gains to trade at $68,252 as of 8:32 a.m. in New York. Smaller tokens such as second-ranked Ether and top-10 coin Solana oscillated in narrow ranges.
US spot-Bitcoin ETFs lured almost $2.4 billion of net inflows in the six days through Oct. 18, data compiled by Bloomberg show, partly on bets that US crypto rules will become friendlier after the Nov. 5 presidential election.
Republican candidate Donald Trump is avowedly pro-crypto, so much so that Bitcoin is viewed as a so-called Trump trade. Democratic rival Vice President Kamala Harris has vowed to support a regulatory framework for the industry. That contrasts with a crackdown on the sector under the Biden administration.
The two key market trends are the elections and the global macroeconomic environment, according to David Lawant, head of research at crypto prime broker FalconX. The Bitcoin options market indicates that “forward implied volatility is heavily clustered around the election day and somewhat subdued leading to it and some time after it,” he wrote in a note.
Bitcoin climbed nearly 10% in the seven days through Sunday, the original cryptocurrency’s best weekly performance in more than a month. ETF demand helped the token reach a record high of $73,798 in March. The rally cooled and Bitcoin last traded above $70,000 back in June.
Most Read from Bloomberg Businessweek
©2024 Bloomberg L.P.
BETTER HOMES AND GARDENS® REAL ESTATE ANNOUNCES BRAND REFRESH, EMPHASIZING ITS LIFESTYLE EXPERTISE AND REPUTABLE BRAND ROOTS
The real estate brand from the magazine you trust for all things home unveils “Nobody Knows Homes BetterSM” tagline
MADISON, N.J., Oct. 21, 2024 /PRNewswire/ — Better Homes and Gardens Real Estate LLC, a subsidiary of Anywhere Real Estate Inc. HOUS, has helped buyers find homes that uniquely fit their lifestyle with a curated approach that has led to a 99% client satisfaction rate. The real estate brand has earned a reputation of quality and trust, built on the rich legacy of the Better Homes & Gardens media brand, a century-long trusted source for all things home. The Better Homes and Gardens Real Estate (BHGRE) brand plans to further lean into that deep understanding of home with the launch of its latest positioning, “Nobody Knows Homes Better.”
The refreshed campaign embodies the brand’s commitment to providing exceptional boutique-level service and lifestyle expertise. As “personal property curators,” affiliated agents and brokers offer a personalized approach to help ensure buyers find not just a house but the perfect home for their lifestyle.
With the evolution of Better Homes and Gardens Real Estate comes even greater commitment to ensuring affiliated agents and brokers have the tools, training and resources to stay on top of home design and industry trends. Specifically, the BHGRE® brand is creating opportunities for agents to expand their lifestyle skillset, leaning into knowledge within the brand network to further learn from other top professionals.
“True icons are consistently evolving to stay fresh and align with changing consumer interests and demands and this brand is no different,” said Ginger Wilcox, President of Better Homes and Gardens Real Estate. “People want to work with an agent and brand that is reliable and trustworthy during one of the biggest decisions of their life – and we do just that.”
Along with the new tagline, the brand is releasing the “We Know” campaign ad, which showcases how BHGRE® affiliated agents are uniquely positioned to meet consumers where they are and pay special attention to their clients’ wants and needs. Whether it’s a fixer-upper with tons of charm and potential, or a fully remodeled estate, the BHGRE brand understands all the big and small details that make a future home a source of joy and pride and promises to deliver better living.
As the brand looks ahead to 2025, BHGRE has produced the Home Trends Report based on Better Homes & Gardens audience research. This highlights key trends in the lifestyle space to inform consumers’ everyday lives, but also how these insights can be examined from both a homebuying and selling lens.
The Better Homes and Gardens® Real Estate brand continues to cement itself as a lifestyle leader in the real estate industry. With the resource of brand trust for both homebuying and lifestyle knowledge, the brand continues to prove that “Nobody Knows Homes BetterSM.”
About Better Homes and Gardens Real Estate LLC
The Better Homes and Gardens® Real Estate network is a dynamic real estate brand that offers a full range of services to brokers, sales associates and home buyers and sellers. Using innovative technology, sophisticated business systems and the broad appeal of a lifestyle brand, the Better Homes and Gardens Real Estate network embodies the future of the real estate industry while remaining grounded in the tradition of home. Better Homes and Gardens Real Estate LLC is a subsidiary of Anywhere Real Estate Inc. HOUS, a global leader in real estate franchising and provider of real estate brokerage, relocation, and settlement services.
The growing Better Homes and Gardens® Real Estate network includes approximately 11,700 independent sales associates in approximately 400 offices serving homebuyers and sellers across the United States, Canada, Jamaica, The Bahamas, Australia and Türkiye.
Better Homes and Gardens®, BHGRE® and the Better Homes and Gardens Real Estate Logo are registered service marks owned by Meredith Operations Corporation and licensed to Better Homes and Gardens Real Estate LLC. Better Homes and Gardens Real Estate LLC fully supports the principles of the Fair Housing Act and the Equal Opportunity Act. Each office is independently owned and operated.
Media Contact
Misty.Beard@bhgre.com
Misty Beard
973-407-2331
![]() View original content to download multimedia:https://www.prnewswire.com/news-releases/better-homes-and-gardens-real-estate-announces-brand-refresh-emphasizing-its-lifestyle-expertise-and-reputable-brand-roots-302281886.html
View original content to download multimedia:https://www.prnewswire.com/news-releases/better-homes-and-gardens-real-estate-announces-brand-refresh-emphasizing-its-lifestyle-expertise-and-reputable-brand-roots-302281886.html
SOURCE Better Homes and Gardens Real Estate LLC
Market News and Data brought to you by Benzinga APIs
© 2024 Benzinga.com. Benzinga does not provide investment advice. All rights reserved.
Microwave Power Transmission Market Size & Share to Surpass USD 939.5 million by 2031 | Analysis by Transparency Market Research, Inc.
Wilmington, Delaware, United States, Transparency Market Research Inc. -, Oct. 21, 2024 (GLOBE NEWSWIRE) — The microwave power transmission industry (마이크로파 전력 전송 산업) was worth US$ 167.0 million in 2022. The market is projected to increase at a CAGR of 24.1% from 2023 to 2031, reaching US$ 939.5 million by 2031. The increasing interest in space-based solar power generation, which involves capturing solar energy in space and transmitting it to Earth via microwave beams, has driven the development of microwave power transmission systems that can effectively beam energy from space-based solar arrays to ground-based receivers.
Unlike traditional grid-based electricity supply, microwave transmission systems provide a reliable alternative that makes it possible to access power in remote areas. Remote, rural, military, and emergency response applications drive this demand for off-grid power solutions. The need for dependable and effective microwave power transmission solutions to power satellite ground stations and remote communication facilities is driven by the growth of the telecommunications infrastructure, including the rollout of 5G networks and the rising demand for satellite communication systems.
Technology in microwave power transmission continues to advance continuously, and cost-cutting initiatives continue to be taken in the field, such as developing lightweight, affordable rectenna arrays and solid-state microwave amplifiers. The market can expand by reducing installation and operating costs, enhancing system performance, and providing new applications and industry opportunities.
Download sample PDF copy of report: https://www.transparencymarketresearch.com/sample/sample.php?flag=S&rep_id=85410

Key Findings of the Market Report
- Based on technology, a near-field segment is likely to increase demand for microwave power transmission in the market.
- The space solar power station segment was the largest application segment in 2022.
- A signal generator is expected to drive market demand for microwave power transmission.
- From 2023 to 2031, Asia Pacific is expected to hold the largest share.
- North America held a share of 23.0% in 2022.
Global Microwave Power Transmission Market: Competitive Landscape
Researchers and developers in the industry are heavily investing in innovation and new technologies to boost efficiency, extend transmission distances, and enhance reliability. The company is also investing in marketing and brand-building activities to expand its microwave power transmission market share.
Key Players Profiled
- Infineon Technologies
- WiTricity
- Telefonaktiebolaget LM Ericsson
- Huawei Technologies Co. Ltd.
- ALE International
- NEC Corporation
- Aviat Networks, Inc.
- Intracom Telecom
- Ceragon
- DragonWave-X
- Anritsu
- Energous Corporation
- Powercast Corporation
- TDK Corporation
- Ossia Inc.
- Others
Key Developments
- In August 2023, Aviat Networks, Inc., an innovative wireless transport and access company, selected Aviat to upgrade and modernize Hoosier Energy’s existing microwave transmission network, an Indiana-based transmission and generation cooperative.
- In March 2024, Huawei’s SuperHub solution was awarded the GSMA GLOMO “Best Mobile Innovation for Emerging Markets” award in recognition of its ability to improve microwave spectrum efficiency. In SuperHub, microwave spectrum can be reused across several links and separated by as little as 15 degrees, resulting in better spectrum utilization and higher link speeds.
Global Microwave Power Transmission Market: Growth Drivers
- A number of technological developments have led to an increase in the efficiency, range, and reliability of microwave power transmission technology, which has led to the growth of this market. Long-distance power transmission can now be achieved using microwave-based systems thanks to these advances.
- Renewable energy sources, such as solar and wind power, are becoming increasingly popular to efficiently transport energy from remote or offshore regions to metropolitan centers. As a result, microwave power transmission has become a necessity.
- Microwave power transmission technologies have become a promising source of effective and high-power wireless charging solutions due to their widespread applications in consumer electronics, electric cars, and medical devices. This will boost market growth across several industries.
Unlock Growth Potential in Your Industry! Download PDF Brochure: https://www.transparencymarketresearch.com/sample/sample.php?flag=S&rep_id=85410
Global Microwave Power Transmission Market: Regional Landscape
- Asia Pacific is expected to drive demand for the microwave power transmission market. China and India are experiencing rapid industrialization and urbanization, making efficient energy transmission systems essential. As part of government initiatives in South Korea and Japan, renewable energy is being encouraged to increase market potential.
- As telecommunications infrastructure in Southeast Asian countries expands, microwave power transmission systems will become more prevalent. A rising level of funding for solar power projects in China is helping to expand the market.
- A growing demand for off-grid power options in rural and isolated areas has led to the development of microwave power transmission technology in the Asia Pacific region. Technological innovations and cost-reduction initiatives in countries such as South Korea and Japan are driving the growth and adoption of the market.
- The use of microwave power transmission for reliable energy distribution has become increasingly popular because of increased concerns about energy security and resilience in natural disaster-prone countries like Japan.
- The governments of countries such as India subsidize and encourage clean energy technology to create an adequate market environment for microwave power transmission solutions.
Global Microwave Power Transmission Market: Segmentation
By Technology
By Component
- Signal Generator
- Power Amplifier
- Transceiver Antenna
- Rectifier Circuit
- Others
By Application
- Space Solar Power Station
- Payload Spacecraft Module
- High Power Weapon
- EV Battery
- Medical Device
- Others
By End User
- Aerospace
- Automotive
- Defense
- Healthcare
- Consumer Electronics
- Others
By Region
- North America
- Latin America
- Europe
- Asia Pacific
- Middle East & Africa
Buy this Premium Research Report @ https://www.transparencymarketresearch.com/checkout.php?rep_id=85410<ype=S
More Trending Reports by Transparency Market Research –
Biomass Boiler Market (バイオマスボイラー市場) – The market was valued at US$ 4.7 Bn in 2021 and it is estimated to grow at a CAGR of 18.1 % from 2022 to 2031 and reach US$ 24.9 Bn by the end of 2031
Microturbines Market (سوق التوربينات الدقيقة) – The industry was valued at US$ 91.8 Mn in 2021 and it is estimated to advance at a CAGR of 8.6 % from 2022 to 2031 and reach US$ 209.6 Mn by the end of 2031
About Transparency Market Research
Transparency Market Research, a global market research company registered at Wilmington, Delaware, United States, provides custom research and consulting services. Our exclusive blend of quantitative forecasting and trends analysis provides forward-looking insights for thousands of decision makers. Our experienced team of Analysts, Researchers, and Consultants use proprietary data sources and various tools & techniques to gather and analyses information.
Our data repository is continuously updated and revised by a team of research experts, so that it always reflects the latest trends and information. With a broad research and analysis capability, Transparency Market Research employs rigorous primary and secondary research techniques in developing distinctive data sets and research material for business reports.
Contact:
Transparency Market Research Inc.
CORPORATE HEADQUARTER DOWNTOWN,
1000 N. West Street,
Suite 1200, Wilmington, Delaware 19801 USA
Tel: +1-518-618-1030
USA – Canada Toll Free: 866-552-3453
Website: https://www.transparencymarketresearch.com
Email: sales@transparencymarketresearch.com
Follow Us: LinkedIn| Twitter| Blog | YouTube

Market News and Data brought to you by Benzinga APIs
© 2024 Benzinga.com. Benzinga does not provide investment advice. All rights reserved.
Smart Money Is Betting Big In ISRG Options
Whales with a lot of money to spend have taken a noticeably bearish stance on Intuitive Surgical.
Looking at options history for Intuitive Surgical ISRG we detected 21 trades.
If we consider the specifics of each trade, it is accurate to state that 28% of the investors opened trades with bullish expectations and 66% with bearish.
From the overall spotted trades, 11 are puts, for a total amount of $884,979 and 10, calls, for a total amount of $2,075,713.
Projected Price Targets
Based on the trading activity, it appears that the significant investors are aiming for a price territory stretching from $250.0 to $620.0 for Intuitive Surgical over the recent three months.
Insights into Volume & Open Interest
Looking at the volume and open interest is an insightful way to conduct due diligence on a stock.
This data can help you track the liquidity and interest for Intuitive Surgical’s options for a given strike price.
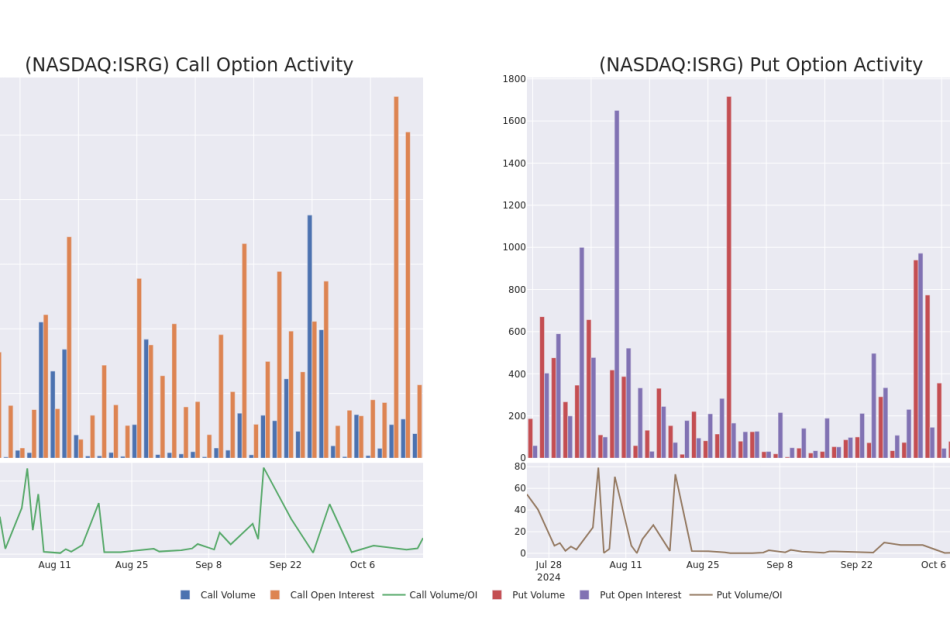
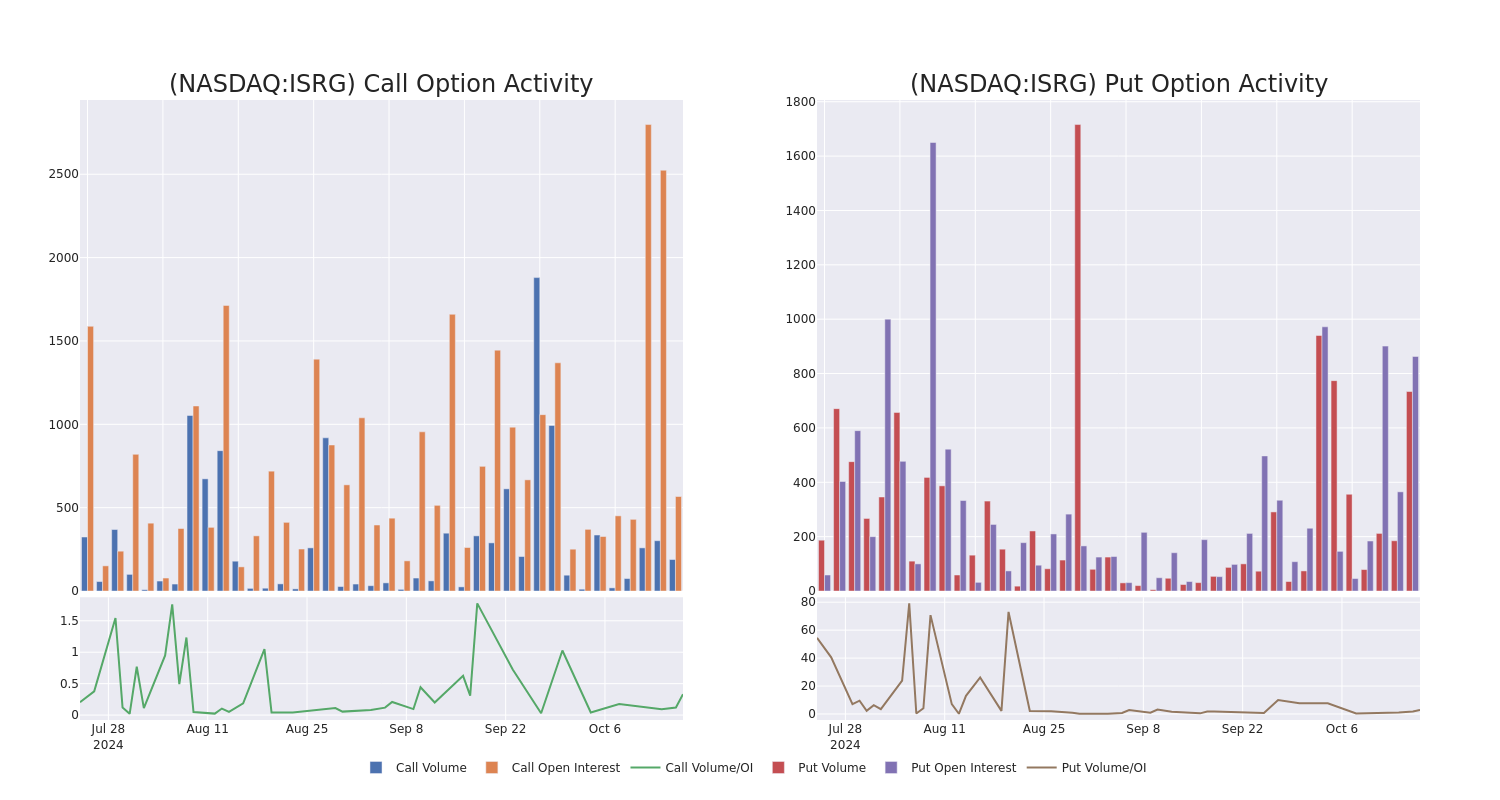
Below, we can observe the evolution of the volume and open interest of calls and puts, respectively, for all of Intuitive Surgical’s whale activity within a strike price range from $250.0 to $620.0 in the last 30 days.
Intuitive Surgical Option Volume And Open Interest Over Last 30 Days
Significant Options Trades Detected:
| Symbol | PUT/CALL | Trade Type | Sentiment | Exp. Date | Ask | Bid | Price | Strike Price | Total Trade Price | Open Interest | Volume |
|---|---|---|---|---|---|---|---|---|---|---|---|
| ISRG | CALL | TRADE | BEARISH | 01/17/25 | $63.9 | $63.2 | $63.2 | $470.00 | $1.2M | 313 | 270 |
| ISRG | CALL | TRADE | BEARISH | 01/17/25 | $64.0 | $63.2 | $63.2 | $470.00 | $316.0K | 313 | 70 |
| ISRG | PUT | SWEEP | BEARISH | 01/15/27 | $97.1 | $94.0 | $97.1 | $570.00 | $184.4K | 0 | 21 |
| ISRG | PUT | SWEEP | BEARISH | 01/15/27 | $101.9 | $97.4 | $101.9 | $580.00 | $142.6K | 0 | 21 |
| ISRG | PUT | SWEEP | BULLISH | 01/16/26 | $44.4 | $44.3 | $44.32 | $500.00 | $132.9K | 9 | 54 |
About Intuitive Surgical
Intuitive Surgical develops, produces, and markets a robotic system for assisting minimally invasive surgery. It also provides the instrumentation, disposable accessories, and warranty services for the system. The company has placed more than 8,600 da Vinci systems in hospitals worldwide, with more than 5,000 installations in the US and a growing number in emerging markets.
After a thorough review of the options trading surrounding Intuitive Surgical, we move to examine the company in more detail. This includes an assessment of its current market status and performance.
Current Position of Intuitive Surgical
- With a volume of 682,367, the price of ISRG is down -0.47% at $518.69.
- RSI indicators hint that the underlying stock may be approaching overbought.
- Next earnings are expected to be released in 92 days.
What Analysts Are Saying About Intuitive Surgical
Over the past month, 5 industry analysts have shared their insights on this stock, proposing an average target price of $540.4.
Unusual Options Activity Detected: Smart Money on the Move
Benzinga Edge’s Unusual Options board spots potential market movers before they happen. See what positions big money is taking on your favorite stocks. Click here for access.
* An analyst from Wells Fargo persists with their Overweight rating on Intuitive Surgical, maintaining a target price of $549.
* An analyst from BTIG has decided to maintain their Buy rating on Intuitive Surgical, which currently sits at a price target of $535.
* An analyst from Piper Sandler downgraded its action to Overweight with a price target of $538.
* An analyst from RBC Capital persists with their Outperform rating on Intuitive Surgical, maintaining a target price of $555.
* An analyst from Stifel has decided to maintain their Buy rating on Intuitive Surgical, which currently sits at a price target of $525.
Trading options involves greater risks but also offers the potential for higher profits. Savvy traders mitigate these risks through ongoing education, strategic trade adjustments, utilizing various indicators, and staying attuned to market dynamics. Keep up with the latest options trades for Intuitive Surgical with Benzinga Pro for real-time alerts.
Market News and Data brought to you by Benzinga APIs
© 2024 Benzinga.com. Benzinga does not provide investment advice. All rights reserved.
Decade of big S&P 500 gains is over, Goldman strategists say
(Bloomberg) — US stocks are unlikely to sustain their above-average performance of the past decade as investors turn to other assets including bonds for better returns, Goldman Sachs Group Inc. strategists said.
Most Read from Bloomberg
The S&P 500 Index is expected to post an annualized nominal total return of just 3% over the next 10 years, according to an analysis by strategists including David Kostin. That compares with 13% in the last decade, and a long-term average of 11%.
They also see a roughly 72% chance that the benchmark index will trail Treasury bonds, and a 33% likelihood they’ll lag inflation through 2034.
“Investors should be prepared for equity returns during the next decade that are toward the lower end of their typical performance distribution,” the team wrote in a note dated Oct. 18.
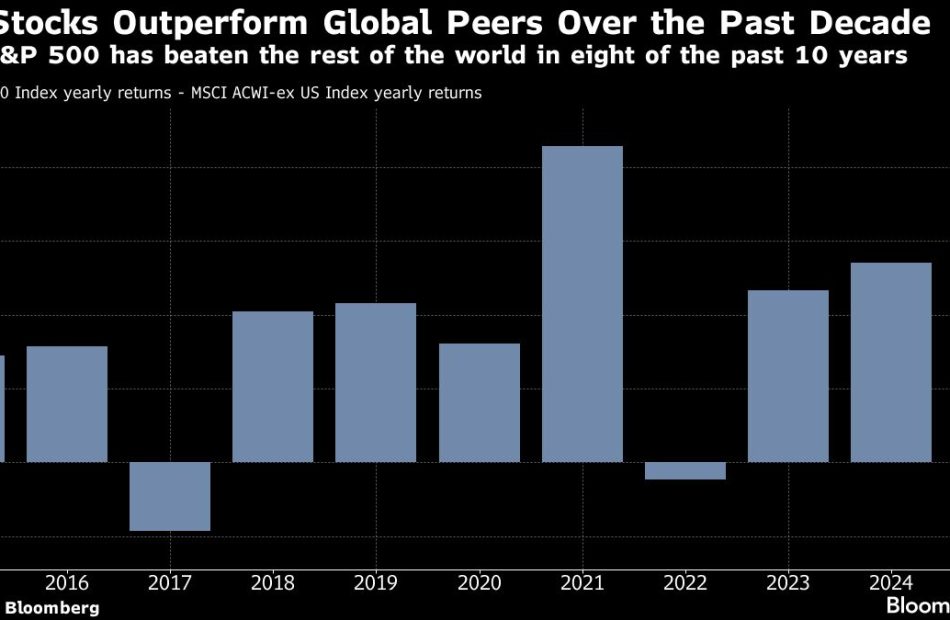
US equities have rallied following the global financial crisis, first driven by near-zero interest rates and later by bets on resilient economic growth. The S&P 500 is on track to outperform the rest of the world in eight of the last 10 years, according to data compiled by Bloomberg.
Still, this year’s 23% bounce has been concentrated in a handful of the biggest technology stocks. The Goldman strategists said they expect returns to broaden out and the equal-weighted S&P 500 to outperform the market cap-weighted benchmark in the next decade.
Even if the rally were to remain concentrated, the S&P 500 would post below-average returns of about 7%, they said.
The latest Bloomberg Markets Live Pulse survey showed investors expect the US equity rally to extend into the final stretch of 2024. The strength of Corporate America’s results are seen as more crucial for the stock market’s performance than who wins the US presidential election or even the Federal Reserve’s policy path.
(Updates with MLIV Pulse survey findings in the last paragraph of story.)
Most Read from Bloomberg Businessweek
©2024 Bloomberg L.P.
American Express Analysts Increase Their Forecasts After Q3 Earnings
American Express Co AXP company reported mixed results for the third quarter on Friday.
The company said quarterly revenue (net of interest expenses) grew 8% year-on-year to $16.64 billion, marginally missing the analyst consensus estimate of $16.67 billion. Adjusted EPS of $3.49 beat the analyst consensus estimate of $3.28.
Card Member spending or Billed Business grew 6% (or 6% forex adjusted) year-over-year to $387.3 billion.
U.S. Consumer Services revenue was $7.944 billion, up 10% year over year. Commercial Services revenue was $3.998 billion, up 7% year over year. International Card Services revenue was $2.936 billion, up 11% year over year, and Global Merchant and Network Services revenue was $1.847 billion, flat year over year.
American Express shares fell 2.2% to trade at $270.58 on Monday.
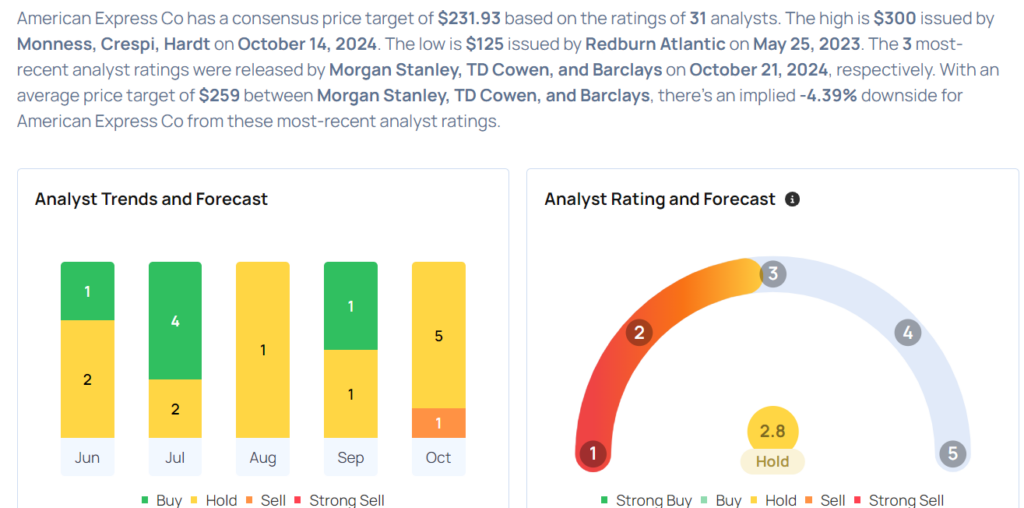
These analysts made changes to their price targets on American Express following earnings announcement.
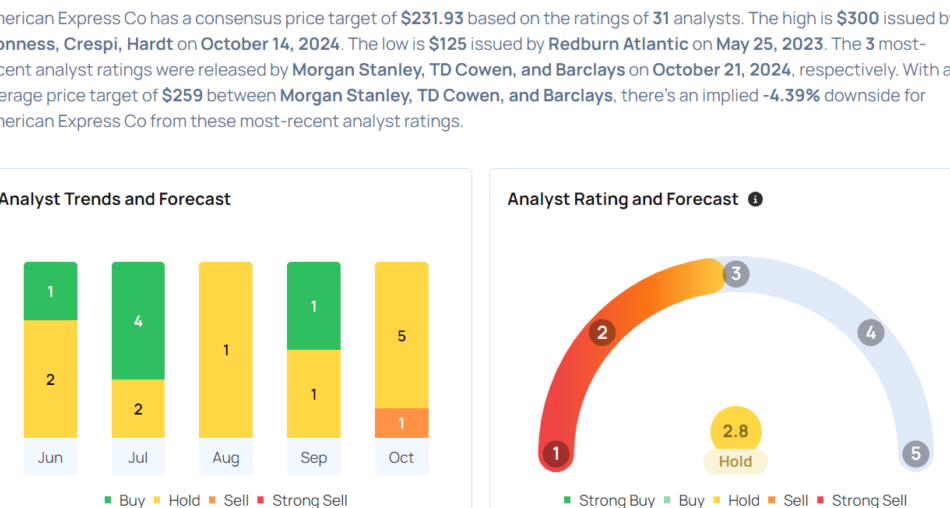
- Barclays analyst Terry Ma maintained American Express with an Equal-Weight and raised the price target from $250 to $257.
- TD Cowen analyst Moshe Orenbuch maintained the stock with a Hold and raised the price target from $260 to $268.
- Morgan Stanley analyst Betsy Graseck maintained the stock with an Equal-Weight rating and boosted the price target from $248 to $252.
Considering buying AXP stock? Here’s what analysts think:
Read Next:
Market News and Data brought to you by Benzinga APIs
© 2024 Benzinga.com. Benzinga does not provide investment advice. All rights reserved.
Can You Put Your RMDs Into a Roth IRA? Here's What to Know
If you’re taking a required minimum distribution from an IRA, 401(k) or other tax-deferred account and don’t need the money to cover living expenses, where should you stash that unneeded cash?
Investors now need to start taking RMDs at age 73 or, if they were born after 1960, at age 75. Depending on the balances of your accounts, that distribution can be a sizable amount of money, perhaps more than you need to live on. One option is to reinvest that money, and a Roth IRA would seem to be a perfect choice: withdrawals from Roth accounts are tax-free – including all gains on your investments – and you’ll never need to take any of those pesky RMDs during your lifetime.
There’s just one catch: You can’t directly convert your RMDs to a Roth. But for some people, there is a potential workaround. For 2024, you can contribute up to $7,000 plus another $1,000 if you’re at least 50 years old – if you have enough earned income.
Get matched with a financial advisor to discuss your own retirement strategy.
What is – and isn’t – ‘earned income’
The IRS defines earned income as money you get for working, such as wages, commissions, bonuses, tips and honorariums for speaking, writing or taking part in a conference or convention. Income generated by self-employment also counts. Income that doesn’t qualify includes taxable pension payments, interest income, dividends, rental income, alimony and withdrawals from Roth IRAs or other nontaxable retirement accounts, along with annuities, welfare benefits, unemployment compensation, worker’s compensation payments and your Social Security income.
Another restriction on Roth contributions is the income limit. Once your modified adjusted gross income (MAGI) hits $146,000 for a single filer or $230,000 for joint filers, your maximum Roth contribution starts phasing out up to $161,000 (single filers) or $240,000 (joint filers). After that, you’re no longer eligible to contribute.
You also need to remember that you need to wait five tax years after your first contribution to any Roth account before you can make withdrawals. Heirs who inherit your Roth will need to withdraw the entire balance within 10 years.
Consider speaking with a financial advisor to develop a tax-efficient retirement strategy.
Other options on RMDs
If you don’t qualify to make a Roth contribution, you still have options to eliminate, reduce or delay your RMDs.
Roth conversion: You can convert your IRA to a Roth account, once you’ve taken your RMD for the year. You’ll pay taxes on the amount you convert, so one tactic is to convert the maximum amount available without pushing yourself into a higher tax bracket. Each Roth conversion carries its own five-year rule.
Charitable contribution: You can use a Qualified Charitable Distribution to donate some or all of your RMD to a charity recognized by the IRS and you won’t be taxed on the donated amount. To qualify, the money must be transferred directly from your IRA to the charity.
Keep working: Your 401(k) account with your current employer isn’t subject to RMDs if you’re still on the payroll. One tactic is to roll 401(k)s from previous employers into your current plan so that they won’t be subject to RMDs. Once you stop working, however, RMDs are required.
Be careful: The punishment for failing to take an RMD during the required time period is a hefty one – up to 50% of the missed RMD amount.
A financial advisor can help you navigate the particular risks and tradeoffs in your situation.
Pay attention to all your taxes
Structuring your retirement withdrawals to reduce your tax bite means looking at all your sources of income, including retirement accounts, RMDs, Social Security benefits, pensions and taxable investment income. For some people, withdrawing money from an IRA early in retirement can reduce the size of their eventual RMDs. If they also delay collecting their Social Security benefits, their benefit amount to increase by 8% each year until they reach 70 years old. Also, be sure to coordinate taxes, withdrawals and RMDs between spouses, and remember that a younger spouse’s RMDs won’t need to be taken until they reach age 73 or 75.
Other common retirement tax moves include investing in tax-free bonds, moving to a state with no income tax or estate tax, harvesting tax losses in taxable investment accounts and holding any taxable assets long enough to qualify for lower long-term capital gains tax rates.
To learn more about retirement planning and how to work toward your goals, talk to a financial advisor for free.
Bottom line
How to manage your RMDs – and all the other many tax questions that can arise in retirement – can be complicated. Take the time to estimate your retirement taxes before you start collecting pensions, Social Security and taking withdrawals from retirement accounts.
Tips
-
Balancing taxes and retirement income – and figuring out how to minimize taxes in retirement – is a crucial issue. A knowledgeable financial advisor can help you decide how to structure and coordinate these payments over the span of your retirement.
-
Finding a financial advisor doesn’t have to be hard. SmartAsset’s free tool matches you with up to three vetted financial advisors who serve your area, and you can interview your advisor matches at no cost to decide which one is right for you.
-
Make sure you’re protecting your cash reserves from inflation by securing them in an account that generates a competitive interest rate. Leaving cash in a checking account or low-yield savings account can stifle your purchasing power over time.
-
Keep an emergency fund on hand in case you run into unexpected expenses. An emergency fund should be liquid — in an account that isn’t at risk of significant fluctuation like the stock market. The tradeoff is that the value of liquid cash can be eroded by inflation. But a high-interest account allows you to earn compound interest. Compare savings accounts from these banks.
-
Are you a financial advisor looking to grow your business? SmartAsset AMP helps advisors connect with leads and offers marketing automation solutions so you can spend more time making conversions. Learn more about SmartAsset AMP.
Photo credit: ©iStock.com/skynesher
The post Can I Use My RMDs to Transfer Money Into My Roth IRA? appeared first on SmartReads by SmartAsset.
An Overview of PennyMac Mortgage's Earnings
PennyMac Mortgage PMT is preparing to release its quarterly earnings on Tuesday, 2024-10-22. Here’s a brief overview of what investors should keep in mind before the announcement.
Analysts expect PennyMac Mortgage to report an earnings per share (EPS) of $0.34.
Anticipation surrounds PennyMac Mortgage’s announcement, with investors hoping to hear about both surpassing estimates and receiving positive guidance for the next quarter.
New investors should understand that while earnings performance is important, market reactions are often driven by guidance.
Historical Earnings Performance
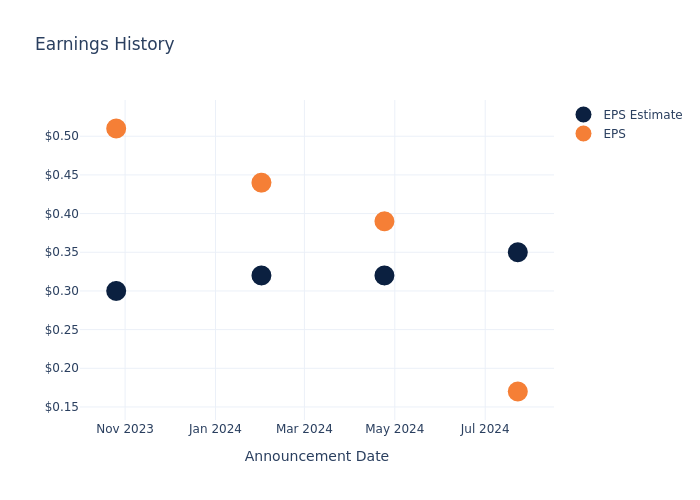
Last quarter the company missed EPS by $0.18, which was followed by a 7.95% drop in the share price the next day.
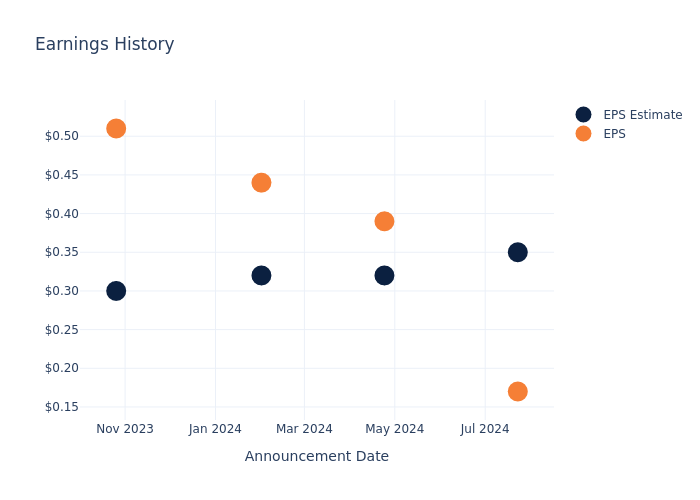
Here’s a look at PennyMac Mortgage’s past performance and the resulting price change:
| Quarter | Q2 2024 | Q1 2024 | Q4 2023 | Q3 2023 |
|---|---|---|---|---|
| EPS Estimate | 0.35 | 0.32 | 0.32 | 0.30 |
| EPS Actual | 0.17 | 0.39 | 0.44 | 0.51 |
| Price Change % | -8.0% | 3.0% | -3.0% | 15.0% |
Market Performance of PennyMac Mortgage’s Stock
Shares of PennyMac Mortgage were trading at $14.06 as of October 18. Over the last 52-week period, shares are up 29.15%. Given that these returns are generally positive, long-term shareholders are likely bullish going into this earnings release.
To track all earnings releases for PennyMac Mortgage visit their earnings calendar on our site.
This article was generated by Benzinga’s automated content engine and reviewed by an editor.
Market News and Data brought to you by Benzinga APIs
© 2024 Benzinga.com. Benzinga does not provide investment advice. All rights reserved.
Price Over Earnings Overview: Hershey
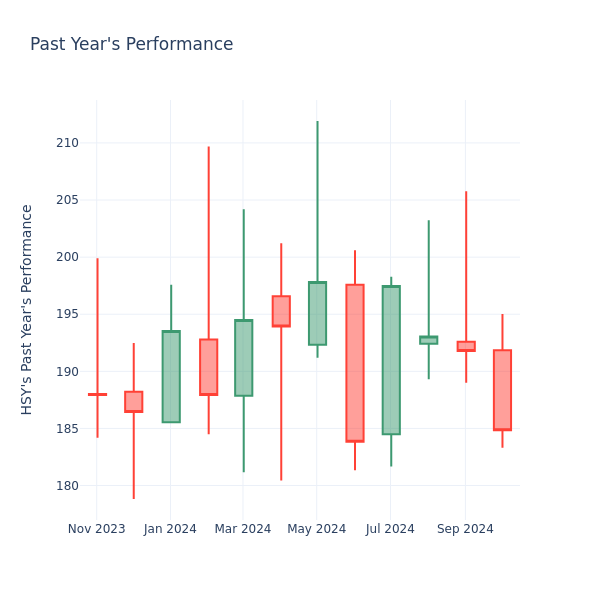
In the current session, Hershey Inc. HSY is trading at $184.85, after a 0.44% drop. Over the past month, the stock fell by 4.39%, and in the past year, by 2.86%. With performance like this, long-term shareholders are more likely to start looking into the company’s price-to-earnings ratio.
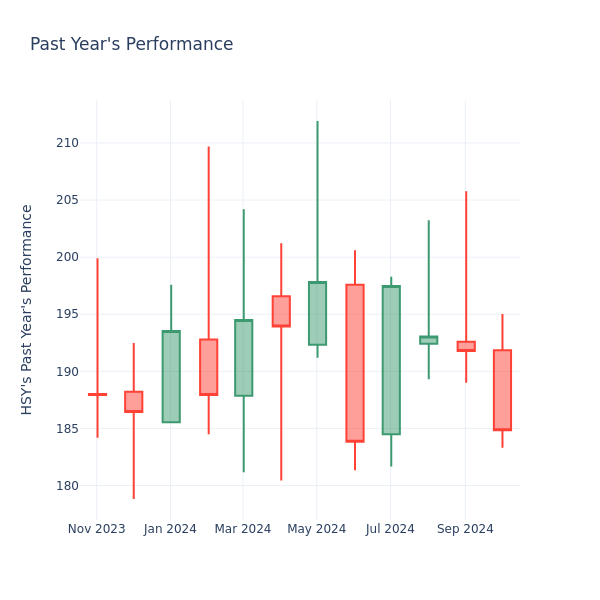
How Does Hershey P/E Compare to Other Companies?
The P/E ratio is used by long-term shareholders to assess the company’s market performance against aggregate market data, historical earnings, and the industry at large. A lower P/E could indicate that shareholders do not expect the stock to perform better in the future or it could mean that the company is undervalued.
Compared to the aggregate P/E ratio of the 34.02 in the Food Products industry, Hershey Inc. has a lower P/E ratio of 20.56. Shareholders might be inclined to think that the stock might perform worse than it’s industry peers. It’s also possible that the stock is undervalued.
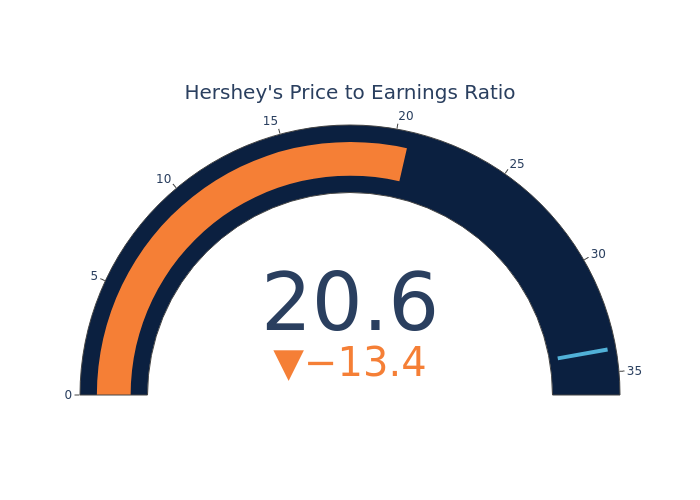
In summary, while the price-to-earnings ratio is a valuable tool for investors to evaluate a company’s market performance, it should be used with caution. A low P/E ratio can be an indication of undervaluation, but it can also suggest weak growth prospects or financial instability. Moreover, the P/E ratio is just one of many metrics that investors should consider when making investment decisions, and it should be evaluated alongside other financial ratios, industry trends, and qualitative factors. By taking a comprehensive approach to analyzing a company’s financial health, investors can make well-informed decisions that are more likely to lead to successful outcomes.
Market News and Data brought to you by Benzinga APIs
© 2024 Benzinga.com. Benzinga does not provide investment advice. All rights reserved.

