1 Stock to Buy, 1 Stock to Sell This Week: GE Aerospace, UPS
-
Jobless claims, Fed speakers, Q3 earnings will be in focus this week.
-
GE Aerospace is a buy with upbeat profit and sales growth expected.
-
UPS is a sell with weak earnings, soft guidance on deck.
-
Looking for more actionable trade ideas to navigate the current market volatility? Unlock access to InvestingPro for less than $8 a month!
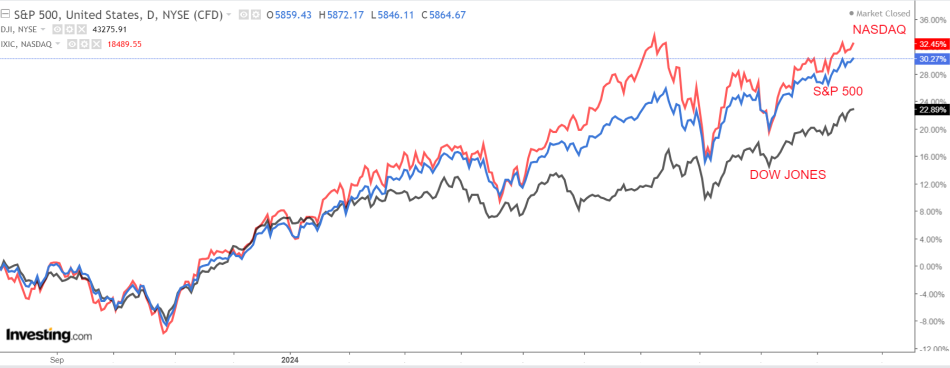
U.S. stocks closed higher on Friday to cap off their sixth winning week in a row, with the S&P 500 and Dow Jones Industrial Average rallying to new records.
For the week, the benchmark S&P 500 rose 0.9%, the blue-chip Dow climbed 1%, and the tech-heavy Nasdaq Composite gained 0.8%.
Source: Investing.com
The week ahead is expected to be an eventful one as investors assess the outlook for the economy, inflation, interest rates and corporate earnings.
Most important on the economic calendar will be Thursday morning’s release of initial jobless claims figures at 8:30AM ET, as well as a pair of flash PMI surveys.
That will be accompanied by a heavy slate of Fed speakers, with the likes of district governors Neel Kashkari, Lorie Logan, Mary Daly, and Patrick Harker all set to make public appearances during the week.
Source: Investing.com
Some 88% of market participants expect the Federal Open Market Committee to cut its benchmark interest rate by 25 basis points at its November 7 policy meeting, while nearly 12% expect no change, according to Investing.com’s Fed Monitor Tool.
Meanwhile, third-quarter earnings season shifts into high gear, with reports expected from several high-profile companies, including Tesla (NASDAQ:TSLA), IBM (NYSE:IBM), and Boeing (NYSE:BA).
Some of the other notable reporters include United Parcel Service (NYSE:UPS), Coca-Cola (NYSE:KO), General Motors (NYSE:GM), AT&T (NYSE:T), Verizon (NYSE:VZ), GE Aerospace (NYSE:GE), 3M (NYSE:MMM), Honeywell (NASDAQ:HON), Lockheed Martin (NYSE:LMT), American Airlines (NASDAQ:AAL), and Southwest Airlines (NYSE:LUV).
Regardless of which direction the market goes, below I highlight one stock likely to be in demand and another which could see fresh downside. Remember though, my timeframe is just for the week ahead, Monday, October 21 – Friday, October 25.
Stock To Buy: GE Aerospace
I foresee a strong performance for GE Aerospace stock this week, with a potential breakout to a fresh multi-year high on the horizon.
The primary catalyst for GE Aerospace is its third-quarter earnings report, set to be released before the market opens on Tuesday at 6:30AM ET.
Market participants expect a sizable swing in GE stock after the print drops, according to the options market, with a possible implied move of 5.3% in either direction.
Wall Street analysts are optimistic about the company’s performance, with consensus estimates predicting earnings of $1.14 per share on revenue of $9.05 billion.
Source: Investing.com
Several key factors are expected to drive GE Aerospace’s earnings and sales growth. First, the company is benefiting from a surge in demand for aftermarket services, which includes maintenance, repair, and spare parts. This is a high-margin business for the company and should provide a strong boost to its profitability.
Additionally, there is strong demand for new plane engines, particularly for narrow-body aircraft. GE Aerospace, which manufactures the LEAP engine used in many of these aircraft, stands to benefit as airlines continue to replace older fleets with more fuel-efficient models.
GE Aerospace stock ended at $192.61 on Friday, not far from a recent peak of $194.80, which was the highest level since May 2008. At current levels, the Evendale, Ohio-based company has a market cap of $210.7 billion.
Source: Investing.com
Since its spinoff in April, GE has been on a strong upward trajectory, with its stock up 40%. General Electric (NYSE:GE) split into three separate companies between November 2021 and April 2024, adopting the trade name GE Aerospace after divesting its healthcare and energy divisions.
InvestingPro highlights GE Aerospace’s promising outlook, emphasizing its favorable positioning in the Aerospace & Defense industry, which has allowed it to leverage a resilient business model and strong profit growth.
Be sure to check out InvestingPro to stay in sync with the market trend and what it means for your trading. Subscribe now with an exclusive 10% discount and position your portfolio one step ahead of everyone else!
Stock to Sell: UPS
On the flip side, United Parcel Service is facing a more challenging outlook, making it a strong sell this week due to a worrying combination of rising costs and weakening demand.
UPS is scheduled to release its third-quarter earnings report before the market opens at 6:00AM ET on Thursday, but the forecast is not promising.
Several headwinds are weighing on UPS’s performance. One of the most significant challenges is the slowing global economy. As inflation persists and interest rates remain elevated, consumer and business spending has slowed, leading to a drop in package volumes for UPS.
According to the options market, traders are pricing in a swing of 4.9% in either direction for UPS stock following the print.
Earnings have been catalysts for outsized swings in shares this year, as per data from InvestingPro, with UPS stock gapping down 11.5% when the company last reported quarterly numbers in July.
Analysts have been steadily revising their estimates downward in recent weeks, with all 21 analysts surveyed by InvestingPro cutting their profit forecasts by roughly 35% from initial expectations.
Source: InvestingPro
Wall Street sees UPS earning $1.63 per share, up 3.8% compared to EPS of $1.57 in the year-ago period. Meanwhile, revenue is forecast to tick up 5% year-over-year to $22.1 billion.
The company’s heavy reliance on global trade and shipping means it is particularly vulnerable to these macroeconomic pressures, which have been impacting revenue.
In addition to weaker demand, UPS is facing rising costs, particularly in fuel and labor. These rising expenses are squeezing margins and making it more difficult for UPS to maintain profitability.
Given these challenges, UPS is expected to issue weak guidance for the upcoming quarters, further dampening investor sentiment.
UPS stock closed Friday’s session at $135.93, not far from a recent low of $123.12, which was the weakest level since July 2020. At its current valuation, the Sandy Springs, Georgia-based shipping giant has a market cap of $116.4 billion.
Source: Investing.com
Shares are down 13.5% in the year to date.
Not surprisingly, UPS has a below-average InvestingPro ‘Financial Health’ score of 2.3 out of 5.0 due to mounting concerns over its near-term profit and sales growth outlook.
Whether you’re a novice investor or a seasoned trader, leveraging InvestingPro can unlock a world of investment opportunities while minimizing risks amid the challenging market backdrop.
Subscribe now to get an additional 10% off the final price and instantly unlock access to several market-beating features, including:
-
AI ProPicks: AI-selected stock winners with proven track record.
-
InvestingPro Fair Value: Instantly find out if a stock is underpriced or overvalued.
-
Advanced Stock Screener: Search for the best stocks based on hundreds of selected filters, and criteria.
-
Top Ideas: See what stocks billionaire investors such as Warren Buffett, Michael Burry, and George Soros are buying.
Disclosure: At the time of writing, I am long on the S&P 500, and the Nasdaq 100 via the SPDR® S&P 500 ETF, and the Invesco QQQ Trust ETF. I am also long on the Technology Select Sector SPDR ETF (NYSE:XLK).
I regularly rebalance my portfolio of individual stocks and ETFs based on ongoing risk assessment of both the macroeconomic environment and companies’ financials.
The views discussed in this article are solely the opinion of the author and should not be taken as investment advice.
Follow Jesse Cohen on X/Twitter @JesseCohenInv for more stock market analysis and insight.
Related Articles
1 Stock to Buy, 1 Stock to Sell This Week: GE Aerospace, UPS
Bank Stocks Enjoy a 7% Boost This Month, Surpassing Nasdaq and S&P 500
5 Oversold Stocks Primed for a Bullish Rebound as Promising Catalysts Emerge
These Analysts Slash Their Forecasts On Schlumberger Following Q3 Earnings
Schlumberger N.V. SLB reported mixed third-quarter results on Friday.
Revenue grew 10.2% year over year to $9.159 billion, missing the consensus of $9.25 billion. Adjusted EPS increased 14% to 89 cents, above the consensus of 88 cents.
“This performance was achieved despite an environment where short-cycle activity growth softened, and some international producers exercised cautious spending triggered by lower oil prices and ample global supply, while land activity in the U.S. remained subdued,” commented SLB CEO Olivier Le Peuch.
Adjusted EBITDA was $2.34 billion for the quarter, an increase of 12.6% Y/Y, and margin expanded 54 bps to 25.6%. The pretax segment operating margin expanded by 51 bps for the quarter to 20.8%.
Schlumberger shares gained 2.2% to trade at $42.83 on Monday.
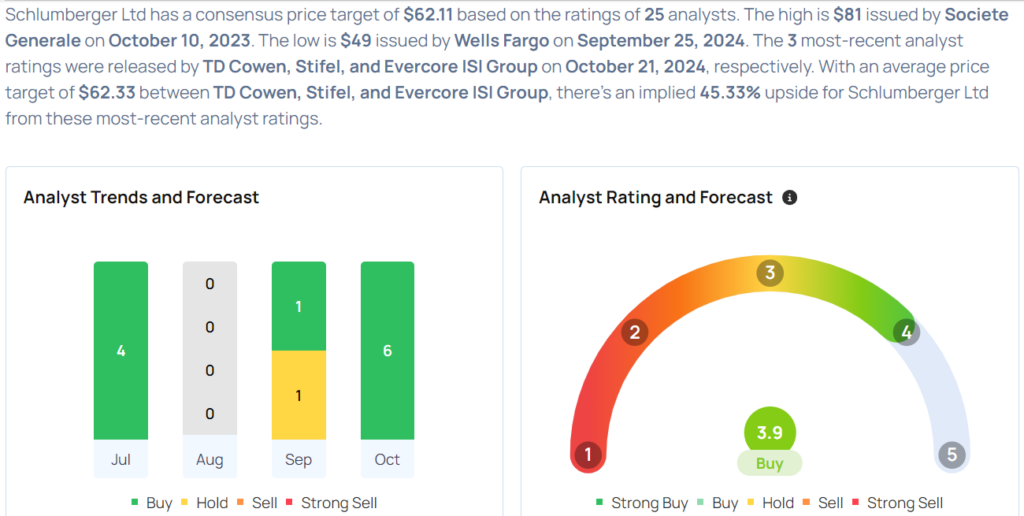
These analysts made changes to their price targets on Schlumberger following earnings announcement.
- Susquehanna analyst Charles Minervino maintained Schlumberger with a Positive and lowered the price target from $60 to $56.
- Barclays analyst David Anderson maintained Schlumberger with an Overweight and lowered the price target from $63 to $61.
- Evercore ISI Group analyst James West maintained SLB with an Outperform and lowered the price target from $74 to $62.
- Stifel analyst Stephen Gengaro reiterated Schlumberger with a Buy and lowered the price target from $62 to $60.
- TD Cowen analyst Marc Bianchi maintained the stock with a Buy rating and cut the price target from $68 to $65.
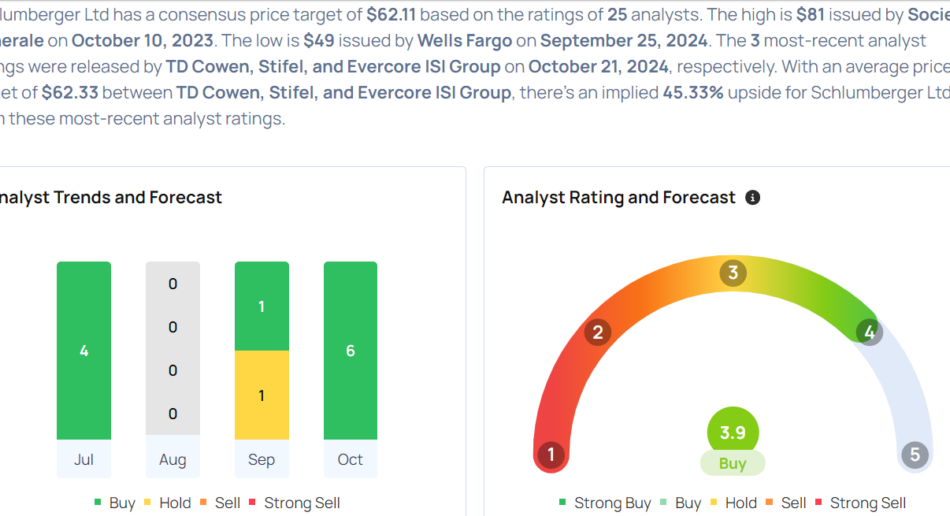
Considering buying SLB stock? Here’s what analysts think:
Read Next:
Market News and Data brought to you by Benzinga APIs
© 2024 Benzinga.com. Benzinga does not provide investment advice. All rights reserved.
$1000 Invested In This Stock 5 Years Ago Would Be Worth $2,000 Today
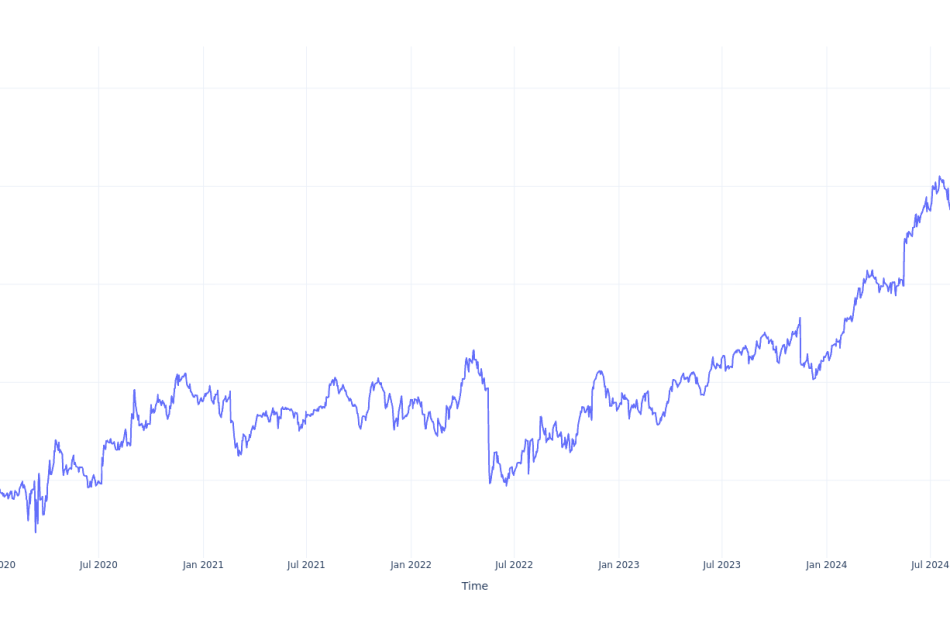
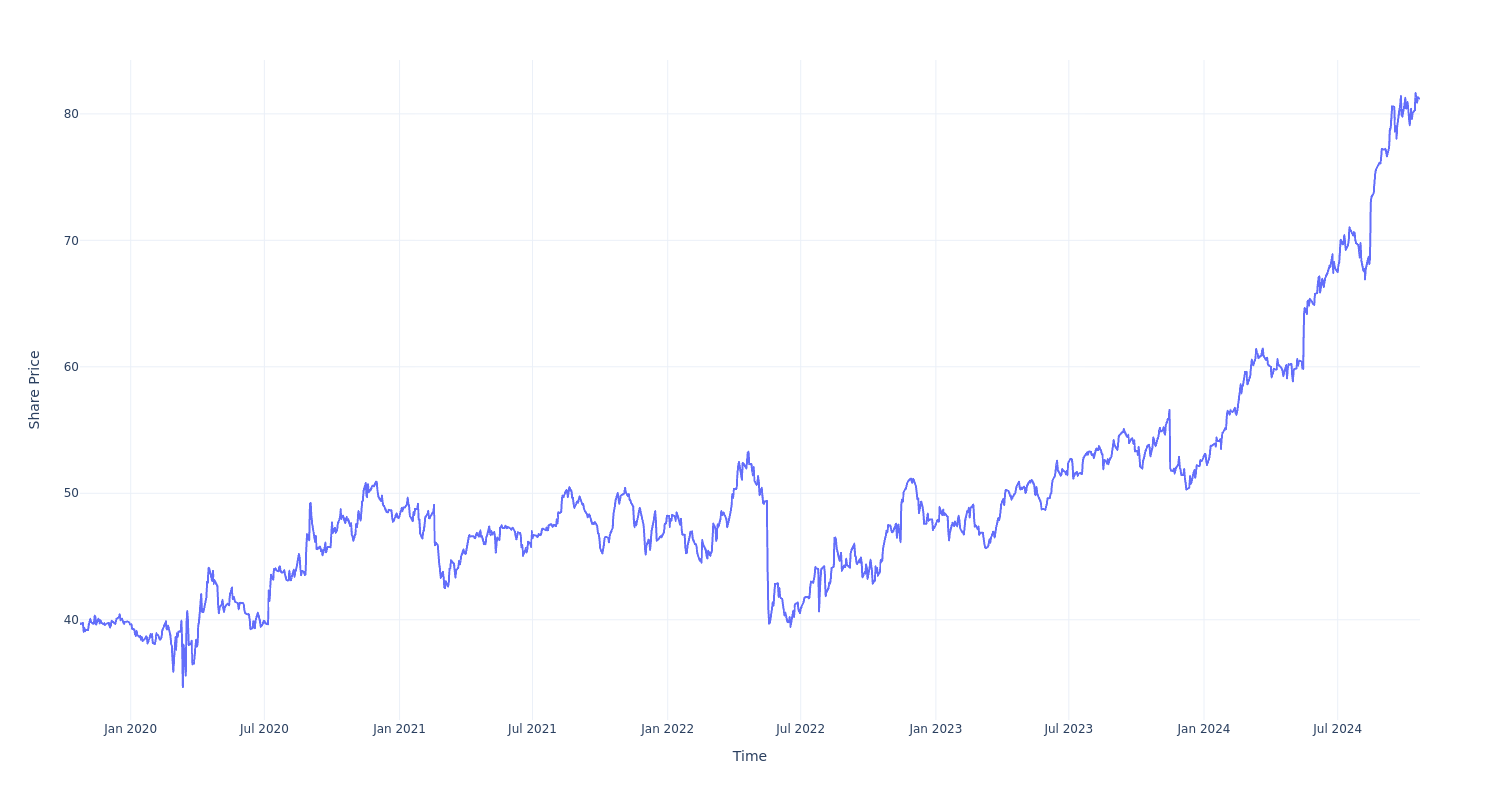
Walmart WMT has outperformed the market over the past 5 years by 1.26% on an annualized basis producing an average annual return of 15.39%. Currently, Walmart has a market capitalization of $652.63 billion.
Buying $1000 In WMT: If an investor had bought $1000 of WMT stock 5 years ago, it would be worth $2,045.09 today based on a price of $81.19 for WMT at the time of writing.
Walmart’s Performance Over Last 5 Years
Finally — what’s the point of all this? The key insight to take from this article is to note how much of a difference compounded returns can make in your cash growth over a period of time.
This article was generated by Benzinga’s automated content engine and reviewed by an editor.
Market News and Data brought to you by Benzinga APIs
© 2024 Benzinga.com. Benzinga does not provide investment advice. All rights reserved.
North America Food Testing Market Size & Share to Surpass USD 4.3 billion by 2031, as a CAGR 7.1%: Transparency Market Research, Inc.
Wilmington, Delaware, United States, Transparency Market Research Inc. -, Oct. 21, 2024 (GLOBE NEWSWIRE) — The North America food testing market (북미 식품 테스트 시장) is estimated to flourish at a CAGR of 7.1% from 2023 to 2031. Transparency Market Research projects that the overall sales revenue for North America food testing is estimated to reach US$ 4.3 billion by the end of 2031.
A prominent trend is the rise of personalized nutrition. As consumers become more health-conscious, demand is growing for food testing services that provide personalized dietary recommendations based on individual genetic profiles and health goals. This trend is driving the development of innovative testing methods that analyze nutrient levels, allergens, and other factors to tailor food choices to individual needs.
The emergence of blockchain technology is transforming food testing practices. Blockchain enables transparent and secure tracking of food products throughout the supply chain, ensuring traceability and authenticity. By verifying the origin and journey of food items, blockchain enhances food safety and facilitates faster identification of contaminants or quality issues.
Request a PDF Sample of this Report Now!
https://www.transparencymarketresearch.com/sample/sample.php?flag=S&rep_id=85479

The trend towards plant-based alternatives is impacting the food testing market. With the rising popularity of plant-based meat, dairy, and other alternatives, there is a growing need for testing services to ensure the safety, quality, and nutritional value of these products. This trend is driving innovation in testing methods tailored to plant-based ingredients and formulations.
Key Findings of the Market Report
- Microbiological Testing segment leads the North America food testing market due to its critical role in ensuring food safety and quality.
- PCR-based assays lead the North America food testing market, offering rapid and accurate detection of pathogens and contaminants in food samples.
- Meat, poultry, and seafood products application segment lead the North America food testing market due to the high risk of contamination.
North America Food Testing Market Growth Drivers & Trends
- Stringent food safety regulations in the United States and Canada drive demand for comprehensive testing services to ensure compliance and consumer protection.
- Growing concerns about foodborne illnesses and allergens fuel demand for advanced testing methods and transparency in food labeling.
- The expansion of international trade increases the need for testing services to verify the safety and quality of imported food products.
- Innovations in testing equipment and methodologies, such as rapid testing kits and molecular diagnostics, enhance efficiency and accuracy in food testing processes.
- Mergers and acquisitions among key players in the food testing sector streamline operations and expand service portfolios to meet evolving market demands.
North America Food Testing Market: Country Profile
- In the United States, stringent regulations imposed by the FDA (Food and Drug Administration) drive the demand for comprehensive food testing services. The country’s vast food industry, comprising agriculture, processing, and distribution sectors, necessitates robust testing protocols to ensure food safety and quality.
- Key players such as SGS SA and Eurofins Scientific dominate the market, offering a wide range of testing solutions tailored to meet regulatory requirements and consumer expectations.
- In Canada, the Canadian Food Inspection Agency (CFIA) oversees food safety regulations, focusing on preventive measures and risk-based approaches. The country’s diverse food landscape, encompassing agriculture, seafood, and processed foods, underscores the importance of rigorous testing to maintain consumer confidence.
- Leading companies like Bureau Veritas SA and Intertek Group plc provide comprehensive testing services, addressing various aspects such as microbiological contamination, chemical residues, and allergens.
Unlock Growth Potential in Your Industry! Download PDF Brochure: https://www.transparencymarketresearch.com/sample/sample.php?flag=S&rep_id=85479
North America Food Testing Market: Competitive Landscape
The North America food testing market presents a competitive landscape dominated by key players such as SGS SA, Bureau Veritas SA, and Intertek Group plc. These companies offer a wide range of testing services, including microbiological, chemical, and allergen testing, ensuring food safety and compliance with regulatory standards.
Regional players like Eurofins Scientific and ALS Limited expand their market presence through strategic acquisitions and partnerships. Market competition intensifies with the rising demand for food safety and quality assurance, driving companies to invest in advanced technologies and expand their service portfolios to meet evolving industry needs. Some prominent players are as follows:
- ALS Limited
- AsureQuality
- Bio-Rad Laboratories, Inc.
- Bureau Veritas SA
- DNV GL
- Eurofins Scientific
- Intertek Group plc
- Laboratory Corporation of America Holdings
- SGS Société Générale de Surveillance SA
- TÜV SÜD
Product Portfolio
- ALS Limited offers a comprehensive portfolio of testing, inspection, and certification services for various industries worldwide, ensuring compliance with regulatory standards and delivering accurate and reliable results.
- AsureQuality specializes in food safety and biosecurity services, providing assurance and certification solutions to safeguard food quality and integrity throughout the supply chain.
- Bio-Rad Laboratories Inc. delivers a diverse range of life science and clinical diagnostics products, including instruments, reagents, and software solutions, empowering researchers and healthcare professionals worldwide to advance scientific discovery and improve patient outcomes.
North America Food Testing Market: Key Segments
By Service Type
- Microbiological Testing
- GMO Testing
- Chemical & Nutritional Testing
- Residues & Contamination Testing
- Allergen Testing
- Others
By Technology
- Culture-based Tests
- PCR-based Assays
- Immunoassay-based Assays
- Others
By Application
- Meat, Poultry, and Seafood Products
- Processed Food
- Cereals & Grains
- Milk & Dairy Products
- Beverages
By Country
Buy this Premium Research Report: https://www.transparencymarketresearch.com/checkout.php?rep_id=85479<ype=S
More Trending Reports by Transparency Market Research –
Diagnostic Specialty Enzymes Market (診断用特殊酵素市場) – The global diagnostic specialty enzymes market is projected to flourish at a CAGR of 6.9% from 2023 to 2031. As per the report published by TMR, a valuation of US$ 1.8 Bn is anticipated for the market in 2031.
Amniotic Membrane Market (سوق الغشاء الأمنيوسي) – The global amniotic membrane market is projected to grow at a CAGR of 9.9% from 2023 to 2031.
About Transparency Market Research
Transparency Market Research, a global market research company registered at Wilmington, Delaware, United States, provides custom research and consulting services. Our exclusive blend of quantitative forecasting and trends analysis provides forward-looking insights for thousands of decision makers. Our experienced team of Analysts, Researchers, and Consultants use proprietary data sources and various tools & techniques to gather and analyses information.
Our data repository is continuously updated and revised by a team of research experts, so that it always reflects the latest trends and information. With a broad research and analysis capability, Transparency Market Research employs rigorous primary and secondary research techniques in developing distinctive data sets and research material for business reports.
Contact:
Transparency Market Research Inc.
CORPORATE HEADQUARTER DOWNTOWN,
1000 N. West Street,
Suite 1200, Wilmington, Delaware 19801 USA
Tel: +1-518-618-1030
USA – Canada Toll Free: 866-552-3453
Website: https://www.transparencymarketresearch.com
Email: sales@transparencymarketresearch.com
Follow Us: LinkedIn| Twitter| Blog | YouTube

© 2024 Benzinga.com. Benzinga does not provide investment advice. All rights reserved.
2 ETFs That Billionaire Ken Griffin Is Buying Hand Over Fist
Ken Griffin has made big bucks primarily from picking stocks for his Citadel Advisors hedge fund. His net worth stands at roughly $43 billion. Big bucks indeed.
However, Griffin’s fortune doesn’t stem exclusively from investing in individual stocks. The billionaire has also poured money into exchange-traded funds (ETFs). Here are two ETFs that Griffin is buying hand over fist.
1. SPDR S&P 500 ETF Trust
Citadel’s largest holding isn’t a stock; it’s an ETF. Griffin’s hedge fund owned 5.6 million shares of the SPDR S&P 500 ETF Trust (NYSEMKT: SPY) valued at $3.05 billion as of June 30, 2024. This total was much lower three months earlier. Griffin bought around 2.03 million additional shares of the ETF in the second quarter of 2024, increasing Citadel’s stake by 56.7%.
The SPDR S&P 500 ETF Trust became the first ETF listed in the U.S. in January 1993. Today, it’s the largest ETF based on assets under management (AUM) with assets of $603.7 billion. The SPDR ETF also ranks as one of the most actively traded ETF.
This ETF attempts to track the performance of the S&P 500 Index. Its top holdings include several of the largest companies around: Apple, Nvidia, Microsoft, Amazon, Facebook parent Meta Platforms, and Google parent Alphabet.
Why does Griffin like this ETF so much? There are several likely reasons.
The billionaire is a fan of diversified portfolios, as evidenced by the 5,800+ holdings in Citadel’s portfolio. The SPDR S&P 500 ETF Trust provides an easy way to invest in the 500 biggest U.S. companies in one fell swoop.
This ETF has also been a big winner. Since its inception in 1993, the fund has delivered an average annual return of nearly 10.5%. In 2024 alone, it’s up close to 23%.
2. Invesco QQQ Trust
Citadel’s second-largest holding is also an ETF, the Invesco QQQ Trust (NASDAQ: QQQ). As of June 30, 2024, the hedge fund owned 3.3 million shares of the fund valued at $1.58 billion. And Griffin aggressively added to Citadel’s position in the Invesco QQQ Trust in Q2, buying roughly 2.82 million shares that boosted his hedge fund’s stake in the ETF by nearly 585%.
The Invest QQQ Trust ranks as the fifth-largest ETF based on AUM. Over the last three months, its average daily share volume trailed only the SPDR S&P 500 ETF Trust.
This ETF attempts to track the performance of the Nasdaq-100 Index. It owns shares of the 100 largest stocks traded on the Nasdaq Stock Market. The fund’s top holdings include Apple, Microsoft, Nvidia, Broadcom), Meta Platforms, and Amazon.
Griffin probably likes the Invesco QQQ Trust for the same reasons he likes the SPDR S&P 500 ETF Trust. The ETF provides a simple way to invest in a large basket of stocks. It has been an even bigger winner than the SPDR ETF, with Lipper ranking it as the best-performing large-cap growth fund based on total return over the past 15 years.
Are these ETFs good picks now?
The main knock against both the SPDR S&P 500 ETF Trust and Invesco QQQ Trust is valuation. The stocks owned by the SPDR ETF trade at an average price-to-earnings ratio of 28.1. The average earnings multiple for stocks owned by the Invesco ETF is even higher at 37.7.
However, I think both of Griffin’s favorite ETFs remain good picks for long-term investors. These funds own the biggest and arguably best stocks on the market. They regularly rebalance to replace laggards with other stocks that are on the rise. I expect both the SPDR S&P 500 ETF Trust and the Invesco QQQ Trust will continue to be big winners over the next decade and beyond.
Should you invest $1,000 in Invesco QQQ Trust right now?
Before you buy stock in Invesco QQQ Trust, consider this:
The Motley Fool Stock Advisor analyst team just identified what they believe are the 10 best stocks for investors to buy now… and Invesco QQQ Trust wasn’t one of them. The 10 stocks that made the cut could produce monster returns in the coming years.
Consider when Nvidia made this list on April 15, 2005… if you invested $1,000 at the time of our recommendation, you’d have $845,679!*
Stock Advisor provides investors with an easy-to-follow blueprint for success, including guidance on building a portfolio, regular updates from analysts, and two new stock picks each month. The Stock Advisor service has more than quadrupled the return of S&P 500 since 2002*.
*Stock Advisor returns as of October 14, 2024
John Mackey, former CEO of Whole Foods Market, an Amazon subsidiary, is a member of The Motley Fool’s board of directors. Suzanne Frey, an executive at Alphabet, is a member of The Motley Fool’s board of directors. Randi Zuckerberg, a former director of market development and spokeswoman for Facebook and sister to Meta Platforms CEO Mark Zuckerberg, is a member of The Motley Fool’s board of directors. Keith Speights has positions in Alphabet, Amazon, Apple, Meta Platforms, and Microsoft. The Motley Fool has positions in and recommends Alphabet, Amazon, Apple, Meta Platforms, Microsoft, and Nvidia. The Motley Fool recommends Nasdaq and recommends the following options: long January 2026 $395 calls on Microsoft and short January 2026 $405 calls on Microsoft. The Motley Fool has a disclosure policy.
2 ETFs That Billionaire Ken Griffin Is Buying Hand Over Fist was originally published by The Motley Fool
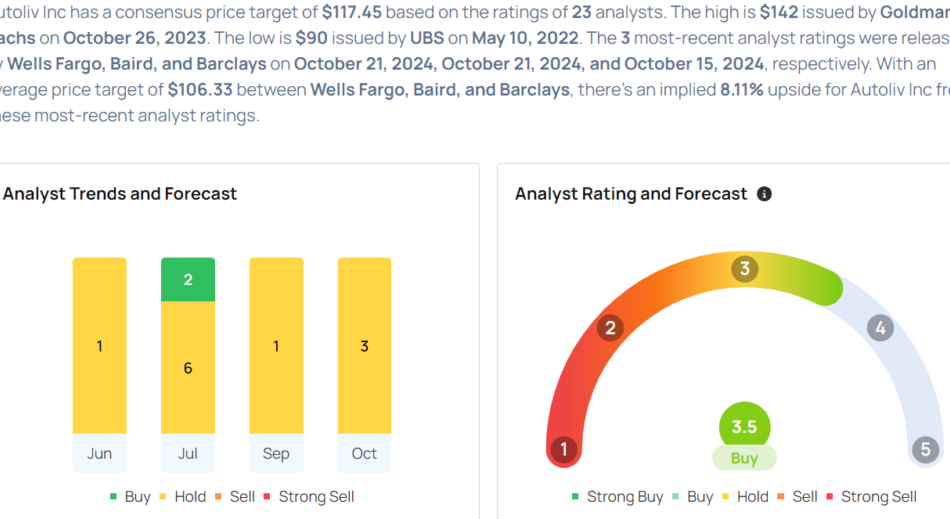
These Analysts Revise Their Forecasts On Autoliv After Q3 Results
Autoliv, Inc. ALV reported better-than-expected third-quarter sales results on Friday.
The company reported third-quarter adjusted earnings per share of $1.84, missing the analyst consensus of $1.95. Quarterly revenues of $2.56 billion topped the street view of $2.53 billion.
“Light vehicle production was weak in the third quarter, declining by close to 5% globally. This was driven by a combination of inventory reductions, especially in the Americas and a high comparison base, especially in China,” said Mikael Bratt, President & CEO.
Autoliv now expects full-year 2024 organic sales growth to be 1%, down from the previously anticipated 2%, due to unfavorable market mix developments.
Autoliv shares fell 1.2% to trade at $98.36 on Monday.
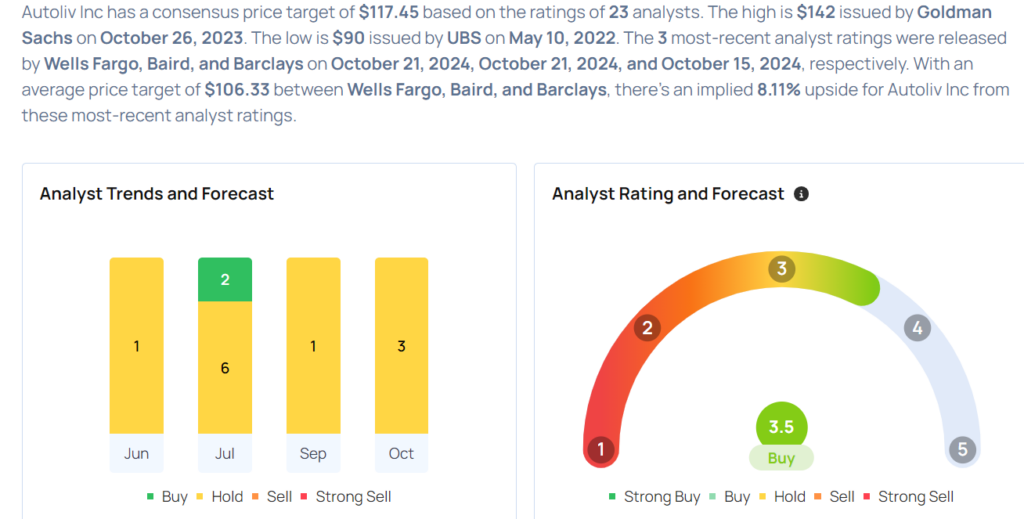
These analysts made changes to their price targets on Autoliv following earnings announcement.
- Baird analyst Luke Junk maintained Autoliv with a Neutral and raised the price target from $103 to $108.
- Wells Fargo analyst Colin Langan maintained Autoliv with an Equal-Weight and cut the price target from $102 to $101.
Considering buying ALV stock? Here’s what analysts think:
Read More:
Market News and Data brought to you by Benzinga APIs
© 2024 Benzinga.com. Benzinga does not provide investment advice. All rights reserved.
Packaging Corp of America's Earnings: A Preview
Packaging Corp of America PKG is preparing to release its quarterly earnings on Tuesday, 2024-10-22. Here’s a brief overview of what investors should keep in mind before the announcement.
Analysts expect Packaging Corp of America to report an earnings per share (EPS) of $2.49.
Anticipation surrounds Packaging Corp of America’s announcement, with investors hoping to hear about both surpassing estimates and receiving positive guidance for the next quarter.
New investors should understand that while earnings performance is important, market reactions are often driven by guidance.
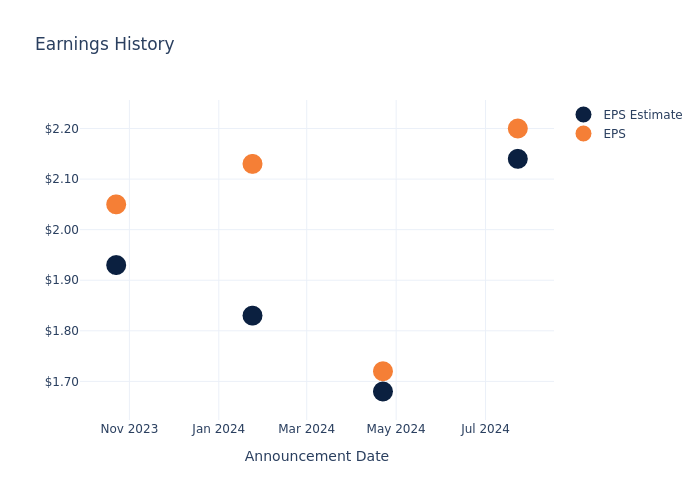
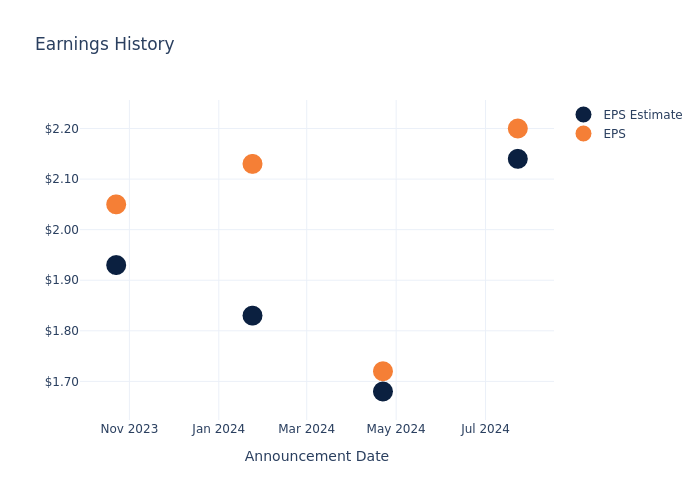
Past Earnings Performance
Last quarter the company beat EPS by $0.06, which was followed by a 0.24% increase in the share price the next day.
Here’s a look at Packaging Corp of America’s past performance and the resulting price change:
| Quarter | Q2 2024 | Q1 2024 | Q4 2023 | Q3 2023 |
|---|---|---|---|---|
| EPS Estimate | 2.14 | 1.68 | 1.83 | 1.93 |
| EPS Actual | 2.20 | 1.72 | 2.13 | 2.05 |
| Price Change % | 0.0% | -5.0% | 4.0% | 3.0% |
Market Performance of Packaging Corp of America’s Stock
Shares of Packaging Corp of America were trading at $220.12 as of October 18. Over the last 52-week period, shares are up 47.24%. Given that these returns are generally positive, long-term shareholders are likely bullish going into this earnings release.
Analyst Observations about Packaging Corp of America
For investors, grasping market sentiments and expectations in the industry is vital. This analysis explores the latest insights regarding Packaging Corp of America.
The consensus rating for Packaging Corp of America is Buy, based on 5 analyst ratings. With an average one-year price target of $226.4, there’s a potential 2.85% upside.
Peer Ratings Overview
This comparison focuses on the analyst ratings and average 1-year price targets of Avery Dennison, International Paper and Graphic Packaging Holding, three major players in the industry, shedding light on their relative performance expectations and market positioning.
- As per analysts’ assessments, Avery Dennison is favoring an Outperform trajectory, with an average 1-year price target of $248.43, suggesting a potential 12.86% upside.
- As per analysts’ assessments, International Paper is favoring an Buy trajectory, with an average 1-year price target of $52.5, suggesting a potential 76.15% downside.
- The consensus outlook from analysts is an Outperform trajectory for Graphic Packaging Holding, with an average 1-year price target of $33.0, indicating a potential 85.01% downside.
Analysis Summary for Peers
The peer analysis summary provides a snapshot of key metrics for Avery Dennison, International Paper and Graphic Packaging Holding, illuminating their respective standings within the industry. These metrics offer valuable insights into their market positions and comparative performance.
| Company | Consensus | Revenue Growth | Gross Profit | Return on Equity |
|---|---|---|---|---|
| Packaging Corp of America | Buy | 6.31% | $437.70M | 4.84% |
| Avery Dennison | Outperform | 6.93% | $662.70M | 7.87% |
| International Paper | Buy | 1.11% | $1.37B | 5.91% |
| Graphic Packaging Holding | Outperform | -6.48% | $481M | 6.70% |
Key Takeaway:
Packaging Corp of America ranks at the top for Gross Profit and Return on Equity among its peers. It is in the middle for Revenue Growth.
Unveiling the Story Behind Packaging Corp of America
Packaging Corp of America is the third-largest containerboard and corrugated packaging manufacturer in the United States. It produces over 4.5 million tons of containerboard annually. The company’s share of the domestic containerboard market is roughly 10%. The firm differentiates itself from larger competitors by focusing on smaller customers and operating with a high degree of flexibility.
Packaging Corp of America’s Economic Impact: An Analysis
Market Capitalization Highlights: Above the industry average, the company’s market capitalization signifies a significant scale, indicating strong confidence and market prominence.
Revenue Growth: Packaging Corp of America’s revenue growth over a period of 3 months has been noteworthy. As of 30 June, 2024, the company achieved a revenue growth rate of approximately 6.31%. This indicates a substantial increase in the company’s top-line earnings. When compared to others in the Materials sector, the company excelled with a growth rate higher than the average among peers.
Net Margin: The company’s net margin is below industry benchmarks, signaling potential difficulties in achieving strong profitability. With a net margin of 9.52%, the company may need to address challenges in effective cost control.
Return on Equity (ROE): The company’s ROE is below industry benchmarks, signaling potential difficulties in efficiently using equity capital. With an ROE of 4.84%, the company may need to address challenges in generating satisfactory returns for shareholders.
Return on Assets (ROA): The company’s ROA is below industry benchmarks, signaling potential difficulties in efficiently utilizing assets. With an ROA of 2.21%, the company may need to address challenges in generating satisfactory returns from its assets.
Debt Management: With a below-average debt-to-equity ratio of 0.77, Packaging Corp of America adopts a prudent financial strategy, indicating a balanced approach to debt management.
This article was generated by Benzinga’s automated content engine and reviewed by an editor.
Market News and Data brought to you by Benzinga APIs
© 2024 Benzinga.com. Benzinga does not provide investment advice. All rights reserved.
What the Options Market Tells Us About Chevron
Financial giants have made a conspicuous bullish move on Chevron. Our analysis of options history for Chevron CVX revealed 12 unusual trades.
Delving into the details, we found 50% of traders were bullish, while 50% showed bearish tendencies. Out of all the trades we spotted, 4 were puts, with a value of $171,580, and 8 were calls, valued at $403,665.
What’s The Price Target?
Analyzing the Volume and Open Interest in these contracts, it seems that the big players have been eyeing a price window from $135.0 to $165.0 for Chevron during the past quarter.
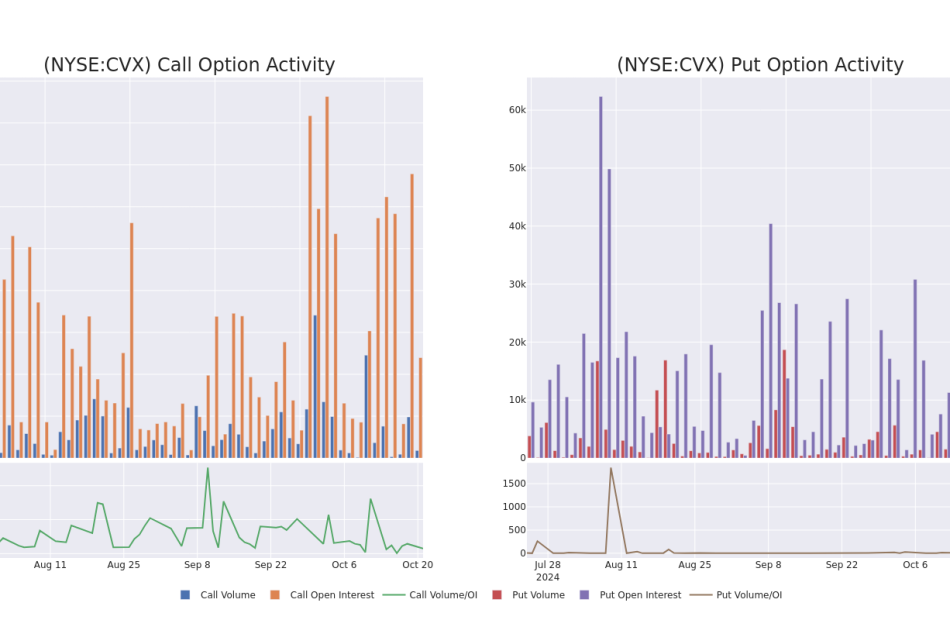
Volume & Open Interest Development
Examining the volume and open interest provides crucial insights into stock research. This information is key in gauging liquidity and interest levels for Chevron’s options at certain strike prices. Below, we present a snapshot of the trends in volume and open interest for calls and puts across Chevron’s significant trades, within a strike price range of $135.0 to $165.0, over the past month.
Chevron Option Activity Analysis: Last 30 Days
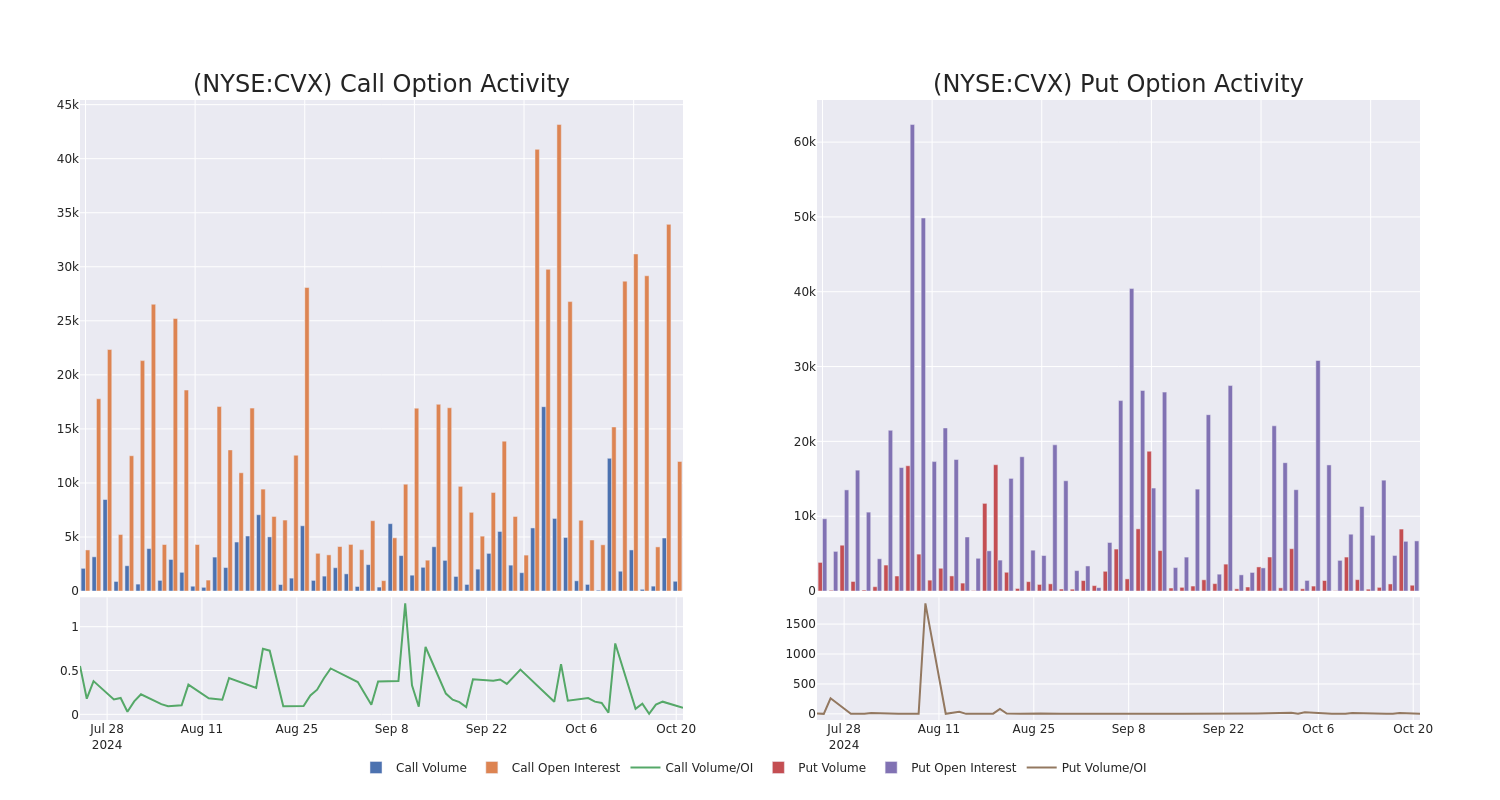
Noteworthy Options Activity:
| Symbol | PUT/CALL | Trade Type | Sentiment | Exp. Date | Ask | Bid | Price | Strike Price | Total Trade Price | Open Interest | Volume |
|---|---|---|---|---|---|---|---|---|---|---|---|
| CVX | CALL | TRADE | BULLISH | 10/25/24 | $14.55 | $14.1 | $14.54 | $137.00 | $100.3K | 0 | 69 |
| CVX | PUT | TRADE | BULLISH | 11/15/24 | $1.66 | $1.59 | $1.59 | $145.00 | $79.5K | 3.9K | 547 |
| CVX | CALL | TRADE | BULLISH | 10/25/24 | $11.9 | $11.55 | $11.89 | $139.00 | $66.5K | 0 | 56 |
| CVX | CALL | TRADE | BULLISH | 10/25/24 | $11.95 | $11.65 | $11.94 | $139.00 | $63.2K | 0 | 109 |
| CVX | CALL | TRADE | BEARISH | 03/21/25 | $9.05 | $9.0 | $9.0 | $150.00 | $44.1K | 681 | 50 |
About Chevron
Chevron is an integrated energy company with exploration, production, and refining operations worldwide. It is the second-largest oil company in the United States with production of 3.1 million of barrels of oil equivalent a day, including 7.7 million cubic feet a day of natural gas and 1.8 million of barrels of liquids a day. Production activities take place in North America, South America, Europe, Africa, Asia, and Australia. Its refineries are in the US and Asia for total refining capacity of 1.8 million barrels of oil a day. Proven reserves at year-end 2023 stood at 11.1 billion barrels of oil equivalent, including 6.0 billion barrels of liquids and 30.4 trillion cubic feet of natural gas.
Following our analysis of the options activities associated with Chevron, we pivot to a closer look at the company’s own performance.
Current Position of Chevron
- With a volume of 2,114,310, the price of CVX is up 0.66% at $151.74.
- RSI indicators hint that the underlying stock may be approaching overbought.
- Next earnings are expected to be released in 11 days.
Expert Opinions on Chevron
In the last month, 5 experts released ratings on this stock with an average target price of $172.2.
Unusual Options Activity Detected: Smart Money on the Move
Benzinga Edge’s Unusual Options board spots potential market movers before they happen. See what positions big money is taking on your favorite stocks. Click here for access.
* Reflecting concerns, an analyst from RBC Capital lowers its rating to Outperform with a new price target of $170.
* Consistent in their evaluation, an analyst from Scotiabank keeps a Sector Outperform rating on Chevron with a target price of $163.
* Maintaining their stance, an analyst from Barclays continues to hold a Overweight rating for Chevron, targeting a price of $168.
* An analyst from UBS persists with their Buy rating on Chevron, maintaining a target price of $192.
* An analyst from B of A Securities has revised its rating downward to Buy, adjusting the price target to $168.
Options are a riskier asset compared to just trading the stock, but they have higher profit potential. Serious options traders manage this risk by educating themselves daily, scaling in and out of trades, following more than one indicator, and following the markets closely.
If you want to stay updated on the latest options trades for Chevron, Benzinga Pro gives you real-time options trades alerts.
Market News and Data brought to you by Benzinga APIs
© 2024 Benzinga.com. Benzinga does not provide investment advice. All rights reserved.
Alibaba, Nio, Baidu Stocks Decline Amid China's Rate Cuts: What's Going On?
Chinese stocks listed in the U.S. are experiencing a downturn as Beijing implements a reduction in its primary lending rates.
What Happened: On Monday’s pre-market, the shares of Chinese companies listed in the U.S. saw a decline during Monday’s pre-market session, according to Benzinga Pro. This follows Beijing’s decision to reduce its primary benchmark lending rates by 25 basis points.
At the time of reporting, Alibaba Group Holding Ltd – ADR BABA experienced a 1.99% drop, while rival PDD Holdings Inc. PDD, parent company of Temu, fell by 1.96%. Electric vehicle manufacturers Li Auto Inc. NASDAQ: LI) and NIO Inc. NIO saw declines of 1.98% and 2.30%, respectively. Additionally, Baidu, Inc. BIDU decreased by 1.28%, and JD.com, Inc. JD was down by 0.78%.
Bloomberg reported that investors are assessing the impact of commercial bank rate cuts amid discussions that only government spending might revive the economy. The People’s Bank of China (PBOC) announced the one-year loan prime rate (LPR) is now 3.1%, and the five-year LPR is 3.6%.
See Also: Why Are Alibaba, Nio, JD.Com And Other US-Listed Chinese Stocks Surging Today?
CNBC reported that despite these monetary measures, experts have emphasized the necessity for fiscal stimulus, noting that the real challenge is the lack of demand in China.
Why It Matters: The reduction in China’s lending rates is part of a broader strategy to stimulate economic growth amid ongoing challenges. The economic recovery in China has been sluggish, with a noticeable decline in consumer demand and industrial output. In recent months, the Chinese government has been under pressure to implement measures that could boost economic activity. However, the effectiveness of monetary policy alone has been questioned, with experts like Shane Oliver advocating for increased fiscal measures to address the demand shortfall.
Read Next:
Disclaimer: This content was partially produced with the help of Benzinga Neuro and was reviewed and published by Benzinga editors.
Image via Shutterstock
Market News and Data brought to you by Benzinga APIs
© 2024 Benzinga.com. Benzinga does not provide investment advice. All rights reserved.
Earnings Outlook For Vicor
Vicor VICR is preparing to release its quarterly earnings on Tuesday, 2024-10-22. Here’s a brief overview of what investors should keep in mind before the announcement.
Analysts expect Vicor to report an earnings per share (EPS) of $0.14.
Anticipation surrounds Vicor’s announcement, with investors hoping to hear about both surpassing estimates and receiving positive guidance for the next quarter.
New investors should understand that while earnings performance is important, market reactions are often driven by guidance.
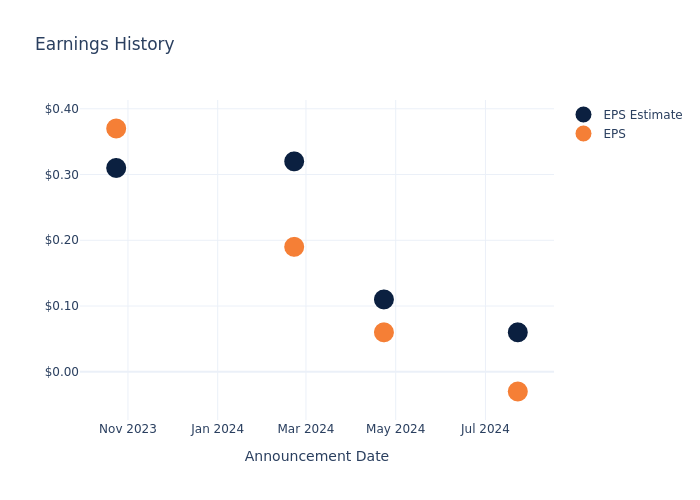
Earnings Track Record
During the last quarter, the company reported an EPS missed by $0.09, leading to a 0.05% increase in the share price on the subsequent day.
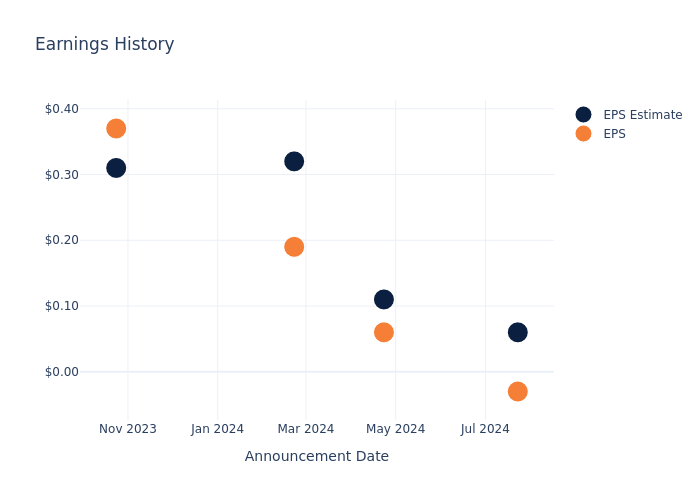
Here’s a look at Vicor’s past performance and the resulting price change:
| Quarter | Q2 2024 | Q1 2024 | Q4 2023 | Q3 2023 |
|---|---|---|---|---|
| EPS Estimate | 0.06 | 0.11 | 0.32 | 0.31 |
| EPS Actual | -0.03 | 0.06 | 0.19 | 0.37 |
| Price Change % | 0.0% | -9.0% | -24.0% | -27.0% |
Market Performance of Vicor’s Stock
Shares of Vicor were trading at $41.04 as of October 18. Over the last 52-week period, shares are down 22.6%. Given that these returns are generally negative, long-term shareholders are likely bearish going into this earnings release.
To track all earnings releases for Vicor visit their earnings calendar on our site.
This article was generated by Benzinga’s automated content engine and reviewed by an editor.
Market News and Data brought to you by Benzinga APIs
© 2024 Benzinga.com. Benzinga does not provide investment advice. All rights reserved.

