US Stock Futures Slide With Rate-Cut Path at Risk: Markets Wrap
(Bloomberg) — Stocks wavered as traders mulled prospects for a slower pace of Federal Reserve rate cuts. Treasury 10-year yields hovered near 4.2%.
Most Read from Bloomberg
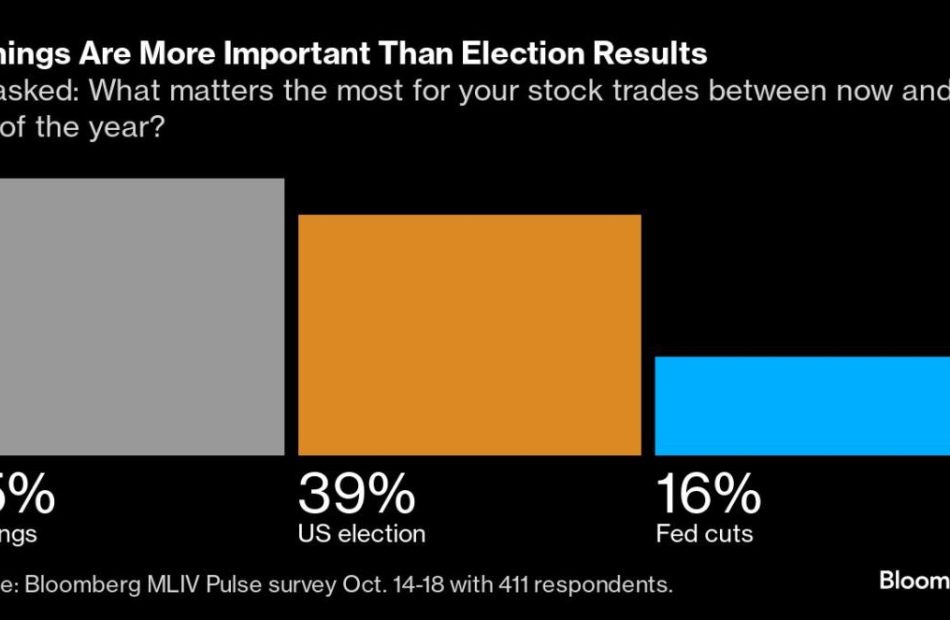
Wall Street is paring back bets on aggressive policy easing as the US economy remains robust while Fed officials sound a cautious tone over the pace of future rate decreases. Rising oil prices and the prospect of bigger fiscal deficits after the upcoming presidential election are only compounding the market’s concerns. Since the end of last week, traders have trimmed the extent of expected Fed cuts through September 2025 by more than 10 basis points.
“Of course, higher yields do not have to be negative for stocks. Let’s face it, the stock market has been advancing as these bond yields have been rising for a full month now,” said Matt Maley at Miller Tabak + Co. “However, given how expensive the market is today, these higher yields could cause some problems for the equity market before too long.”
Exposure to the S&P 500 has reached levels that were followed by a 10% slump in the past, according to Citigroup Inc. strategists. Long positions on futures linked to the benchmark index are at the highest since mid-2023 and are looking “particularly extended,” the team led by Chris Montagu wrote.
The S&P 500 was little changed. The Nasdaq 100 rose 0.1%. The Dow Jones Industrial Average was little changed. In late hours, Texas Instruments Inc. gave a lackluster revenue forecast for the fourth quarter. Starbucks Corp.’s guidance will be suspended for 2025.
Treasury 10-year yields were little changed at 4.20%. The euro hit the lowest since early August amid bets the European Central Bank will keep lowering rates. Options traders are increasing bets that Bitcoin will reach $80,000 by the end of November no matter who wins the US election.
Oil advanced as traders tracked tensions between Israel and Iran. Gold climbed to a fresh record.
The stock market has rallied this year thanks to a resilient economy, strong corporate profits and speculation about artificial-intelligence breakthroughs — sending the S&P 500 up over 20%. Yet risks keep surfacing: from a tight US election to war in the Middle East and uncertainty around the trajectory of Fed easing.
P/E Ratio Insights for Shift4 Payments
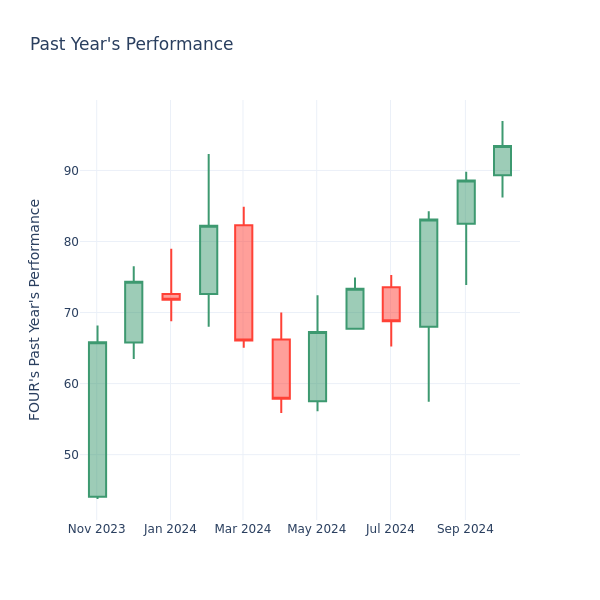
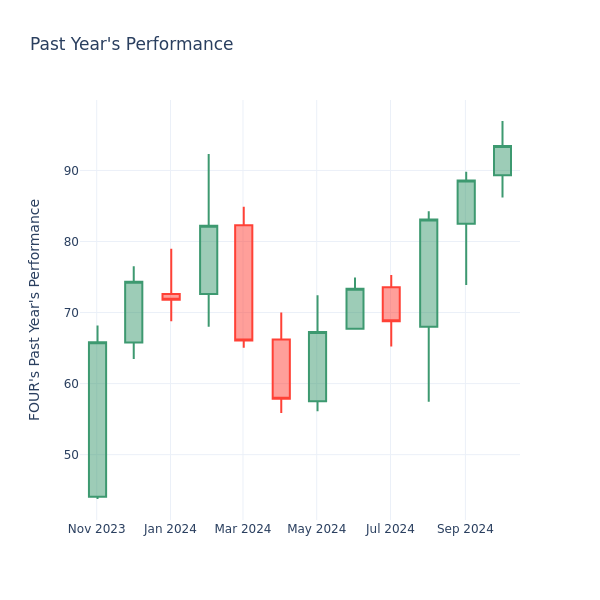
In the current market session, Shift4 Payments Inc. FOUR stock price is at $93.44, after a 1.22% decrease. However, over the past month, the company’s stock increased by 7.41%, and in the past year, by 102.95%. Shareholders might be interested in knowing whether the stock is overvalued, even if the company is not performing up to par in the current session.
Comparing Shift4 Payments P/E Against Its Peers
The P/E ratio is used by long-term shareholders to assess the company’s market performance against aggregate market data, historical earnings, and the industry at large. A lower P/E could indicate that shareholders do not expect the stock to perform better in the future or it could mean that the company is undervalued.
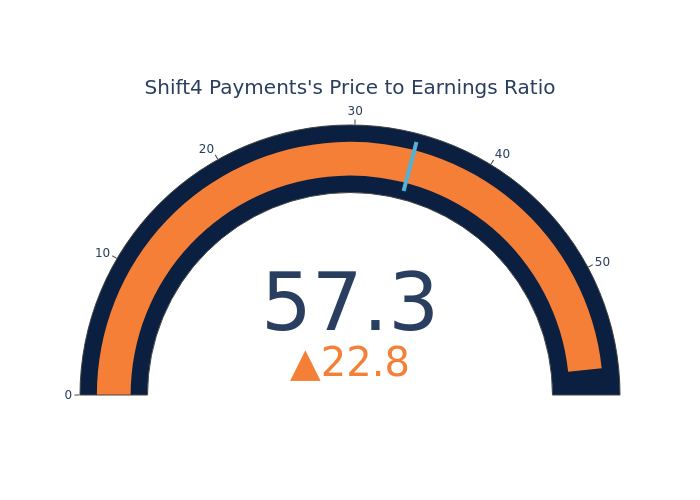
Shift4 Payments has a better P/E ratio of 57.33 than the aggregate P/E ratio of 34.45 of the Financial Services industry. Ideally, one might believe that Shift4 Payments Inc. might perform better in the future than it’s industry group, but it’s probable that the stock is overvalued.
In conclusion, the price-to-earnings ratio is a useful metric for analyzing a company’s market performance, but it has its limitations. While a lower P/E can indicate that a company is undervalued, it can also suggest that shareholders do not expect future growth. Additionally, the P/E ratio should not be used in isolation, as other factors such as industry trends and business cycles can also impact a company’s stock price. Therefore, investors should use the P/E ratio in conjunction with other financial metrics and qualitative analysis to make informed investment decisions.
Market News and Data brought to you by Benzinga APIs
© 2024 Benzinga.com. Benzinga does not provide investment advice. All rights reserved.
Motion Control Market Size is Expected to Reach US$ 35.52 Billion by 2033 | Fact.MR Report
Rockville, MD, Oct. 22, 2024 (GLOBE NEWSWIRE) — The global motion control market is predicted to touch US$ 35.52 billion by 2033, advancing at 5.1% CAGR from 2023 to 2033, as per the latest industry analysis by Fact.MR, a market research and competitive intelligence provider.
The market is expanding steadily as a result of numerous major factors. Automation and industrialization are in high demand across many industries. Companies are looking for ways to increase their manufacturing operations’ productivity, efficiency, and quality. Motion control systems provide precise positioning, speed control, and machinery synchronization, allowing industries to automate activities and optimize production lines.
Developments in motion control technologies, such as motor design, sensor technology, and control algorithms, have broadened the application possibilities and enhanced the appeal of motion control systems. These technical improvements have increased the performance, dependability, and integration capabilities of motion control systems, resulting in their widespread acceptance in industries around the world.
Integration of motion control systems with emerging technologies like the Industrial Internet of Things (IIoT) and Industry 4.0 is contributing to market expansion. Industries can acquire and analyze data, enable predictive maintenance, and accomplish real-time monitoring and control by linking motion control systems to networks. This integration enables streamlined operations, increased efficiency, and less downtime.
For More Insights into the Market, Request a Sample of this Report:
https://www.factmr.com/connectus/sample?flag=S&rep_id=335

Key Takeaways from Market Study:
- The global motion control market amounted to US$ 21.60 billion in 2023.
- Worldwide demand for motion control systems is anticipated to rise at a CAGR of 5.1% over the next ten years.
- The global market is set to garner US$ 35.52 billion by 2033.
- The Chinese market is expected to reach US$ 7.74 billion by 2033.
- Demand for AC servo motors is estimated to expand at a CAGR of 5.8% during the study period.
“Motion control systems are becoming more popular as the demand for automation and industrialization grows across industries. Companies are seeking ways to increase efficiency, productivity, and quality in their production processes, which has led to a growth in the use of motion control systems. Furthermore, expanding industries in emerging economies and favourable government measures to boost automation are driving market expansion,” says a Fact.MR analyst.
Leading Players Driving Innovation in the Motion Control Market:
The global motion control market players are Siemens AG, ABB Group, Schneider Electric, Rockwell Automation Inc, STM Microelectronics, Eaton Corp. Plc, Galil Motion Control, Kollmorgen Corp., Mitsubishi Electric Corp., Moog Inc.
Regional Analysis:
Asia Pacific, particularly China, India, and South Korea, is witnessing significant growth in the global motion control market. In China, rapid industrialization, government support for automation, and a thriving manufacturing sector are driving the demand for motion control systems.
Renowned for its technological prowess, Japan is a major market in the region. The country’s advanced manufacturing capabilities, particularly in the automotive and electronics sectors, necessitate precise motion control, leading to increased adoption of motion control systems. Moreover, South Korea, with its strong presence in the electronics and robotics industries, also contributing to market growth.
Overall, the Asia Pacific region, including China, Japan, and South Korea, is a key driver of the global motion control market, fueled by industrial growth, technological advancements, and the increasing adoption of automation in various sectors.
Get Customization on this Report for Specific Research Solutions:
https://www.factmr.com/connectus/sample?flag=S&rep_id=335
Motion Control Industry News:
- In January 2022, Moen introduced the Smart Faucet, which features cutting-edge motion control technology for completely touchless operation. With the innovative touchless technology in the next-generation Smart Faucet with motion control, users may regulate the water flow and temperature with only a few hand gestures.
More Valuable Insights on Offer:
Fact.MR, in its new offering, presents an unbiased analysis of the global motion control market, presenting historical demand data (2018 to 2022) and forecast statistics for the period of 2023 to 2033.
The study divulges essential insights on the market based on component type (motion controllers, AC drives, AC servo motors, sensors & feedback services, actuators & mechanical systems), end use (food & beverages, aerospace & defense, automotive, semiconductor & electronics, metals & machinery manufacturing, medical, printing & paper), and application (metal cutting, metal forming, material handling equipment, semiconductor machinery, packaging & labelling, robotics), across five major regions (North America, Europe, Asia Pacific, Latin America, and Middle East & Africa).
Check out More Related Studies Published by Fact.MR:
Drone Market: Sales are evaluated to climb to US$ 223.66 billion by the end of 2034, up from US$ 29.96 billion in 2024. The global drone market size is projected to expand at a remarkable CAGR of 22.3% from 2024 to 2034.
Automotive Headliner Market: Size is approximated at US$ 9.9 billion in 2024 and is forecasted to increase at a CAGR of 4% to reach US$ 14.6 billion by 2034-end.
Motorcycle Accessory Market: Size is poised to reach US$ 8.81 billion in 2024. The market has been projected to expand at a CAGR of 3.6% and reach a valuation of US$ 21.05 billion by the end of 2034.
Heavy Duty Truck Market: Sales are forecasted to increase at a CAGR of 4.6% and reach US$ 305.46 billion by 2034-end.
Third-Party Logistics Market: Demand for 3PL logistics solutions is projected to reach a market value of US$ 2.5 billion by 2034, registering a CAGR of 7.6% from 2024 to 2034.
Autonomous Farm Equipment Market: Size is anticipated to increase from a value of US$ 1.1 billion in 2024 to US$ 4.59 billion by 2034, as revealed in the recently updated industry report by Fact.MR.
About Us:
Fact.MR is a distinguished market research company renowned for its comprehensive market reports and invaluable business insights. As a prominent player in business intelligence, we deliver deep analysis, uncovering market trends, growth paths, and competitive landscapes. Renowned for its commitment to accuracy and reliability, we empower businesses with crucial data and strategic recommendations, facilitating informed decision-making and enhancing market positioning.
With its unwavering dedication to providing reliable market intelligence, FACT.MR continues to assist companies in navigating dynamic market challenges with confidence and achieving long-term success. With a global presence and a team of experienced analysts, FACT.MR ensures its clients receive actionable insights to capitalize on emerging opportunities and stay competitive.
Contact:
11140 Rockville Pike
Suite 400
Rockville, MD 20852
United States
Tel: +1 (628) 251-1583
Sales Team: sales@factmr.com
Follow Us: LinkedIn | Twitter | Blog

© 2024 Benzinga.com. Benzinga does not provide investment advice. All rights reserved.
Susan Kreh's Recent Buy: Acquires $239K In Oil-Dri Corp of America Stock
Susan Kreh, Chief Financial Officer at Oil-Dri Corp of America ODC, reported an insider buy on October 21, according to a new SEC filing.
What Happened: Kreh’s recent purchase of 3,500 shares of Oil-Dri Corp of America, disclosed in a Form 4 filing with the U.S. Securities and Exchange Commission on Monday, reflects confidence in the company’s potential. The total transaction value is $239,505.
As of Tuesday morning, Oil-Dri Corp of America shares are down by 1.27%, currently priced at $67.56.
Unveiling the Story Behind Oil-Dri Corp of America
Oil-Dri Corp of America develops, manufactures, and markets sorbent products made predominantly from clay. Its absorbent offerings, which draw liquid up, include cat litter, floor products, toxin control substances for livestock, and agricultural chemical carriers. The company has two segments based on the different characteristics of two primary customer groups namely Retail and Wholesale Products Group and Business to Business Products Group. The company’s products are sold under various brands such as Cat’s Pride, Jonny Cat, Amlan, Agsorb, Verge, Pure-Flo, and Ultra-Clear.
Oil-Dri Corp of America’s Financial Performance
Revenue Growth: Oil-Dri Corp of America’s revenue growth over a period of 3 months has been noteworthy. As of 31 July, 2024, the company achieved a revenue growth rate of approximately 5.88%. This indicates a substantial increase in the company’s top-line earnings. As compared to competitors, the company surpassed expectations with a growth rate higher than the average among peers in the Consumer Staples sector.
Insights into Profitability:
-
Gross Margin: The company shows a low gross margin of 29.04%, indicating concerns regarding cost management and overall profitability relative to its industry counterparts.
-
Earnings per Share (EPS): The company excels with an EPS that surpasses the industry average. With a current EPS of 1.26, Oil-Dri Corp of America showcases strong earnings per share.
Debt Management: The company maintains a balanced debt approach with a debt-to-equity ratio below industry norms, standing at 0.34.
Market Valuation:
-
Price to Earnings (P/E) Ratio: Oil-Dri Corp of America’s P/E ratio of 12.6 is below the industry average, suggesting the stock may be undervalued.
-
Price to Sales (P/S) Ratio: The Price to Sales ratio is 1.38, which is lower than the industry average. This suggests a possible undervaluation based on sales performance.
-
EV/EBITDA Analysis (Enterprise Value to its Earnings Before Interest, Taxes, Depreciation & Amortization): With an EV/EBITDA ratio lower than industry averages at 7.72, Oil-Dri Corp of America could be considered undervalued.
Market Capitalization: Indicating a reduced size compared to industry averages, the company’s market capitalization poses unique challenges.
Now trade stocks online commission free with Charles Schwab, a trusted and complete investment firm.
Exploring the Significance of Insider Trading
Insider transactions, although significant, should be considered within the larger context of market analysis and trends.
From a legal standpoint, the term “insider” pertains to any officer, director, or beneficial owner holding more than ten percent of a company’s equity securities as outlined in Section 12 of the Securities Exchange Act of 1934. This encompasses executives in the c-suite and significant hedge funds. These insiders are mandated to inform the public of their transactions through a Form 4 filing, to be submitted within two business days of the transaction.
A company insider’s new purchase is a indicator of their positive anticipation for a rise in the stock.
While insider sells may not necessarily reflect a bearish view and can be motivated by various factors.
Cracking Transaction Codes
Taking a closer look at transactions, investors often prioritize those unfolding in the open market, meticulously cataloged in Table I of the Form 4 filing. A P in Box 3 denotes a purchase, while S signifies a sale. Transaction code C denotes the conversion of an option, and transaction code A signifies a grant, award, or other acquisition of securities from the company.
Check Out The Full List Of Oil-Dri Corp of America’s Insider Trades.
Insider Buying Alert: Profit from C-Suite Moves
Benzinga Edge reveals every insider trade in real-time. Don’t miss the next big stock move driven by insider confidence. Unlock this ultimate sentiment indicator now. Click here for access.
This article was generated by Benzinga’s automated content engine and reviewed by an editor.
Market News and Data brought to you by Benzinga APIs
© 2024 Benzinga.com. Benzinga does not provide investment advice. All rights reserved.
Alexander & Baldwin Extends Its Revolving Credit Facility
HONOLULU, Oct. 21, 2024 /PRNewswire/ — Alexander & Baldwin, Inc. ALEX, a Hawai’i-based owner, operator, and developer of high-quality commercial real estate in Hawai’i, announced today that it has amended its revolving credit facility, which extends the term of the facility to October 2028, with two six-month extension options and provides for $450 million of borrowing capacity.
The interest rate under the amended revolving credit facility remains unchanged from the prior facility, bearing interest at a rate of SOFR plus 1.05% based on a leverage-based pricing grid, plus a SOFR adjustment of 0.10%. The facility fee also remains unchanged at 0.15% based on a leverage-based pricing grid.
BofA Securities, Inc., First Hawaiian Bank, KeyBanc Capital Markets Inc., and Wells Fargo Securities, LLC served as Joint Lead Arrangers and Joint Bookrunners for the revolving credit facility. Bank of America N.A. is the administrative agent. First Hawaiian Bank, KeyBank National Association and Wells Fargo Bank, National Association are Syndication Agents. Bank of Hawaii, American Savings Bank, F.S.B., U.S. Bank National Association and Central Pacific Bank also participate in the revolving credit facility.
About Alexander & Baldwin, Inc.
Alexander & Baldwin, Inc. ALEX (“A&B”) is the only publicly-traded real estate investment trust to focus exclusively on Hawai’i commercial real estate and is the state’s largest owner of grocery-anchored, neighborhood shopping centers. A&B owns, operates and manages approximately 4.0 million square feet of commercial space in Hawai’i, including 22 retail centers, 14 industrial assets and four office properties, as well as 142 acres of ground lease assets. Over its 154-year history, A&B has evolved with the state’s economy and played a leadership role in the development of the agricultural, transportation, tourism, construction, residential and commercial real estate industries. Learn more about A&B at www.alexanderbaldwin.com.
Contact:
Jordan Hino
(808) 525-8475
investorrelations@abhi.com
![]() View original content to download multimedia:https://www.prnewswire.com/news-releases/alexander–baldwin-extends-its-revolving-credit-facility-302282224.html
View original content to download multimedia:https://www.prnewswire.com/news-releases/alexander–baldwin-extends-its-revolving-credit-facility-302282224.html
SOURCE Alexander & Baldwin
Market News and Data brought to you by Benzinga APIs
© 2024 Benzinga.com. Benzinga does not provide investment advice. All rights reserved.
Insights into Oceaneering International's Upcoming Earnings
Oceaneering International OII is gearing up to announce its quarterly earnings on Wednesday, 2024-10-23. Here’s a quick overview of what investors should know before the release.
Analysts are estimating that Oceaneering International will report an earnings per share (EPS) of $0.44.
Anticipation surrounds Oceaneering International’s announcement, with investors hoping to hear about both surpassing estimates and receiving positive guidance for the next quarter.
New investors should understand that while earnings performance is important, market reactions are often driven by guidance.
Overview of Past Earnings
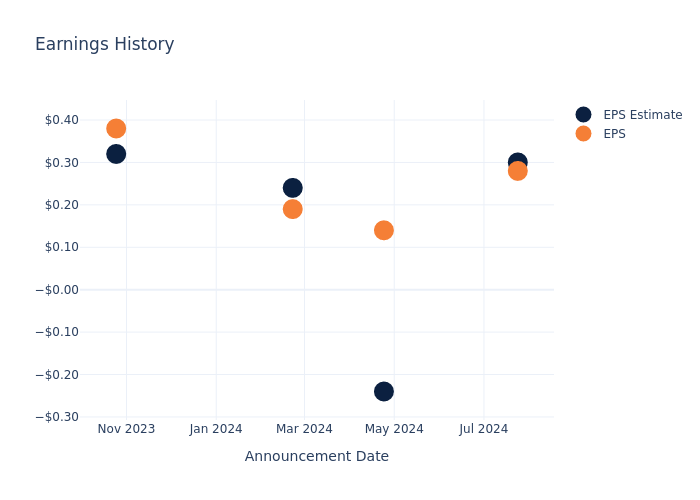
The company’s EPS missed by $0.02 in the last quarter, leading to a 13.75% increase in the share price on the following day.
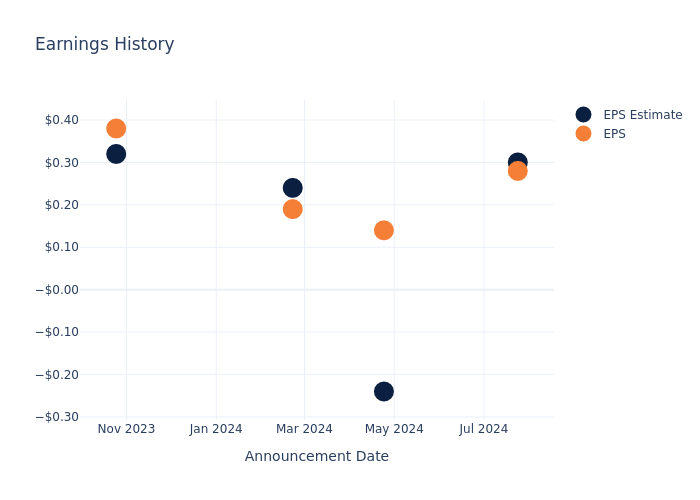
Here’s a look at Oceaneering International’s past performance and the resulting price change:
| Quarter | Q2 2024 | Q1 2024 | Q4 2023 | Q3 2023 |
|---|---|---|---|---|
| EPS Estimate | 0.30 | -0.24 | 0.24 | 0.32 |
| EPS Actual | 0.28 | 0.14 | 0.19 | 0.38 |
| Price Change % | 14.000000000000002% | 7.000000000000001% | -2.0% | -8.0% |
Performance of Oceaneering International Shares
Shares of Oceaneering International were trading at $24.18 as of October 21. Over the last 52-week period, shares are down 0.75%. Given that these returns are generally negative, long-term shareholders are likely bearish going into this earnings release.
Analyst Insights on Oceaneering International
Understanding market sentiments and expectations within the industry is crucial for investors. This analysis delves into the latest insights on Oceaneering International.
With 2 analyst ratings, Oceaneering International has a consensus rating of Buy. The average one-year price target is $29.0, indicating a potential 19.93% upside.
Peer Ratings Comparison
In this comparison, we explore the analyst ratings and average 1-year price targets of USA Compression Partners, Kodiak Gas Services and Atlas Energy Solutions, three prominent industry players, offering insights into their relative performance expectations and market positioning.
- USA Compression Partners is maintaining an Neutral status according to analysts, with an average 1-year price target of $25.0, indicating a potential 3.39% upside.
- Analysts currently favor an Buy trajectory for Kodiak Gas Services, with an average 1-year price target of $34.25, suggesting a potential 41.65% upside.
- Analysts currently favor an Outperform trajectory for Atlas Energy Solutions, with an average 1-year price target of $25.67, suggesting a potential 6.16% upside.
Comprehensive Peer Analysis Summary
Within the peer analysis summary, vital metrics for USA Compression Partners, Kodiak Gas Services and Atlas Energy Solutions are presented, shedding light on their respective standings within the industry and offering valuable insights into their market positions and comparative performance.
| Company | Consensus | Revenue Growth | Gross Profit | Return on Equity |
|---|---|---|---|---|
| Oceaneering International | Buy | 11.86% | $120.21M | 5.49% |
| USA Compression Partners | Neutral | 13.72% | $91.84M | 21.53% |
| Kodiak Gas Services | Buy | 52.31% | $112.92M | 0.55% |
| Atlas Energy Solutions | Outperform | 77.71% | $60.35M | 1.39% |
Key Takeaway:
Oceaneering International ranks at the bottom for Revenue Growth among its peers. It is in the middle for Gross Profit. For Return on Equity, Oceaneering International is at the bottom.
Delving into Oceaneering International’s Background
Oceaneering International Inc is a global provider of engineered services and products robotic solutions to the offshore energy, defense, aerospace, manufacturing and entertainment industries. Most of Oceaneering’s products are produced for the offshore oil and gas market. It had a 2020 segment realignment to promote synergies and cost efficiency. The five segments are subsea robotics; manufactured products; offshore projects group; integrity management and digital solutions; and aerospace and defense technologies. Within the segments are two businesses – services and products provided primarily to the oil and gas industry. The firm is also involved in the offshore renewables and mobility solutions industries.
Oceaneering International’s Financial Performance
Market Capitalization Analysis: Below industry benchmarks, the company’s market capitalization reflects a smaller scale relative to peers. This could be attributed to factors such as growth expectations or operational capacity.
Positive Revenue Trend: Examining Oceaneering International’s financials over 3 months reveals a positive narrative. The company achieved a noteworthy revenue growth rate of 11.86% as of 30 June, 2024, showcasing a substantial increase in top-line earnings. As compared to competitors, the company surpassed expectations with a growth rate higher than the average among peers in the Energy sector.
Net Margin: Oceaneering International’s net margin falls below industry averages, indicating challenges in achieving strong profitability. With a net margin of 5.23%, the company may face hurdles in effective cost management.
Return on Equity (ROE): The company’s ROE is a standout performer, exceeding industry averages. With an impressive ROE of 5.49%, the company showcases effective utilization of equity capital.
Return on Assets (ROA): Oceaneering International’s financial strength is reflected in its exceptional ROA, which exceeds industry averages. With a remarkable ROA of 1.54%, the company showcases efficient use of assets and strong financial health.
Debt Management: Oceaneering International’s debt-to-equity ratio is below the industry average. With a ratio of 1.37, the company relies less on debt financing, maintaining a healthier balance between debt and equity, which can be viewed positively by investors.
This article was generated by Benzinga’s automated content engine and reviewed by an editor.
© 2024 Benzinga.com. Benzinga does not provide investment advice. All rights reserved.
General Motors Continues To Defy Expectations Thanks To Pickups And U.S. Demand
On Tuesday, General Motors GM easily surpassed Wall Street’s third-quarter expectations, raising its key guidance target for the full year fueled by the strength of its North America operations.
Third Quarter Highlights
For the quarter ended on September 30th, General Motors reported revenue went up about 10.5% YoY to $48.76 billion, smashing LSEG’s consensus estimate of $44.59 billion. During the third quarter, GM reported 1.5 million total global sales thanks to strong pickup demand in the U.S. Net income also rose, although sluightly, to $3 billion.
Adjusted earnings per share jumped 30% YoY as they amounted to $2.96, topping LSEG’s consensus estimate of $2.43 per share as strong pricing managed to offsetting offset in China, along with YoY cost increases of $200 million in labor and $700 million in warranty costs.
For the third time this year, GM lifted its 2024 guidance.
GM guided for full-year adjusted EBIT between $14 billion and $15 billion, or $10 and $10.50 a share, lifting its prior outlook that ranged from $13 billion and $15 billion, or $9.50 and $10.50. GM also lifted its adjusted automotive free cash flow whose outlook range was previously before $9.5 billion and $11.5 billion, as it now guided for a range between $12.5 billion and $13.5 billion.
GM also narrowed the net income attributable to common stockholders to a range between $10.4 billion and $11.1 billion, or $9.14 and $9.63 per share.
Due to the timing of truck production, seasonality, lower wholesale volumes and vehicle mix, CFO Paul Jacobson warned fourth quarter earnings will be lower.
The third quarter report comes after GM’s recent investor day when the automaker stated its expectation of earnings strength continuing into next year. But, GM still needs to turnaround its losses in China and find its way in the EV world.
EV News
GM delivered 32,195 EVs during the reported quarter, its new quarterly record as deliveries surged 60% YoY and 46% from the previous, third, quarter. Its Detroit peer, Ford Motor F reported its EV sales jumped 12.2% YoY to 23,509 vehicles, with sales growth slowing down significantly. With its EV pace, GM managed to take a lead over Ford on the EV front, while both still trail the EV king, Tesla Inc TSLA. While Ford turned to hybrids, GM focused on expanding its EV lineup. Tesla will be revealing its quarterly results on Wednesday. However, Tesla already revealed its global Q3 deliveries increased 6% YoY. Besides hitting its third best quarterly deliveries figure, Tesla also restored its EV sales growth for the first time this year. Tesla kicked off October with quite a bang including its robotaxi reveal so its third quarter results are highly anticipated.
DISCLAIMER: This content is for informational purposes only. It is not intended as investing advice.
This article is from an unpaid external contributor. It does not represent Benzinga’s reporting and has not been edited for content or accuracy.
Market News and Data brought to you by Benzinga APIs
© 2024 Benzinga.com. Benzinga does not provide investment advice. All rights reserved.
US Stocks Remains On Edge Ahead Of Flurry Of Earnings From Lockheed Martin, GM And Others: This Is Still A 'Buy The Dip' Market, Says Expert
Wall Street maintained a cautious stance amid a flurry of earnings reports this week, while markets posted gains for the sixth consecutive week.
With some important tech companies scheduled to announce their earnings this week, the Nasdaq Composite kicked off the week on a positive note even as the Dow Jones and S&P 500 opened in the red.
Nearly a fifth of S&P 500 companies are set to report their earnings this week. Cumulative earnings of S&P 500 companies are set to rise for a fifth straight quarter, FactSet said.
On Tuesday, earnings from companies like GE Aerospace GE, Lockheed Martin Corp. LMT, 3M Company MMM, Verizon Communications Inc. VZ, and General Motors GM will be on investors’ radar.
| Futures | Performance (+/-) |
| Nasdaq 100 | -0.65% |
| S&P 500 | 0.00% |
| Dow Jones | -0.48% |
| R2K | -0.90% |
In premarket trading on Monday, the SPDR S&P 500 ETF Trust SPY fell 0.50% to $580.71 and the Invesco QQQ ETF QQQ declined 0.65% to $492.19, according to Benzinga Pro data.
Cues From Last Session:
Caution reigned the markets on the first day of the week, with the S&P 500 and Dow Jones both ending the day in the negative, while the Nasdaq Composite registered gains.
AI stocks led the surge, with Nvidia Corp. NVDA closing at a new all-time high. The positive sentiment rubbed off on rivals, too, with Marvell Technology Inc. MRVL, Advanced Micro Devices Inc. AMD, and Super Micro Computer Inc. SMCI emerging as some of the top gainers.
The Dow Jones Industrial Average and the S&P 500 Index jumped to fresh highs in intraday trading on Friday.
| Index | Performance (+/-) | Value |
| Nasdaq Composite | 0.27% | 18,540.01 |
| S&P 500 | -0.18% | 5,853.98 |
| Dow Jones | -0.80% | 42,931.60 |
| Russell 2000 | -1.60% | 2,239.71 |
Insights From Analysts:
Investors remained anxious about the prospect of future rate cuts amid comments from Federal Reserve officials urging for a cautious approach. Kansas City Fed President Jeff Schmid spoke in favor of moderation, saying “A cautious and deliberate course of action seems appropriate.”
On the other hand, San Francisco Federal Reserve President Mary Daly said there is no reason for the Fed to hold rates steady. “I haven’t seen any information that would suggest we wouldn’t continue to reduce the interest rate,” Daly told the Wall Street Journal.
Fundstrat Head of Research Tom Lee told CNBC in an interview that he expects companies in the S&P 500 index to post a revenue growth of 5% this quarter.
“It is a really high-quality earnings season so far. It’s a good beat season, but it’s early,” he said.
“Stocks which have been strong are really still a ‘buy the dip’ market.”
Going ahead, Lee says to watch out for industrial stocks, after a week of financial stocks having posted better-than-expected earnings.
See Also: Best Futures Trading Software
Upcoming Economic Data
The economic calendar for Tuesday is light, with only one major speech scheduled so far.
- Philadelphia Fed President Patrick Harker is scheduled to speak at 10 a.m. ET.
Stocks In Focus:
- General Motors GM shares surged nearly 3% in premarket trading on Tuesday after the company reported better-than-expected earnings and raised its profit forecast for the third time this year.
- Lockheed Martin LMT shares rose over 1% in premarket trading ahead of the company’s third-quarter earnings.
- Apple Inc.’s AAPL iPhone 16 witnessed price cuts in China on online platforms as part of Singles’ Day promotions.
- Nvidia Corp. NVDA stock has seen an increase in price targets due to bullish demand for artificial intelligence. Bank of America raised its price target for Nvidia from $165 to $190, while investment research firm CFRA raised its target to $160.
Commodities, Bonds And Global Equity Markets:
Crude oil futures edged up in the early New York session, rising nearly 1.10% as China cut key lending rates to boost its economy.
The 10-year Treasury note yield rose marginally to 4.208%.
Asian markets were mixed on Tuesday, with Chinese markets edging lower amid economic growth concerns.
European stocks showed tentativeness and were mostly lower in early trading.
Read Next:
Photo courtesy: Shutterstock
Market News and Data brought to you by Benzinga APIs
© 2024 Benzinga.com. Benzinga does not provide investment advice. All rights reserved.
An Overview of Stifel Financial's Earnings
Stifel Financial SF is gearing up to announce its quarterly earnings on Wednesday, 2024-10-23. Here’s a quick overview of what investors should know before the release.
Analysts are estimating that Stifel Financial will report an earnings per share (EPS) of $1.60.
Anticipation surrounds Stifel Financial’s announcement, with investors hoping to hear about both surpassing estimates and receiving positive guidance for the next quarter.
New investors should understand that while earnings performance is important, market reactions are often driven by guidance.
Past Earnings Performance
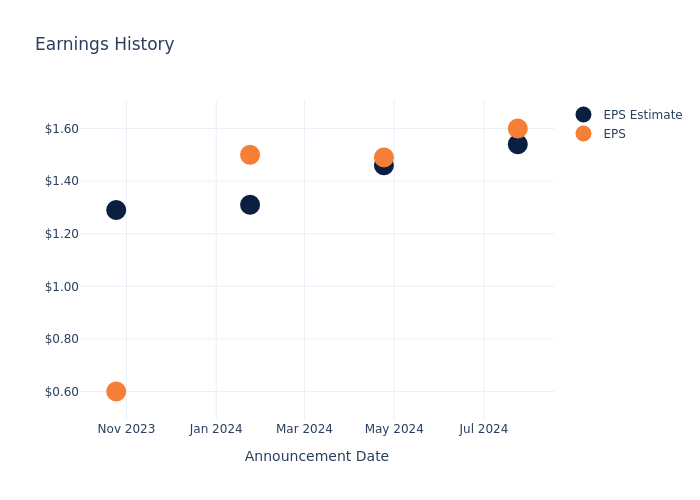
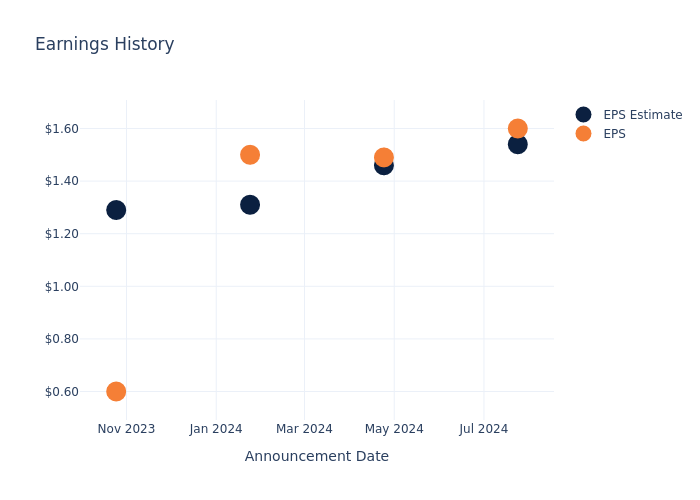
Last quarter the company beat EPS by $0.06, which was followed by a 2.48% increase in the share price the next day.
Here’s a look at Stifel Financial’s past performance and the resulting price change:
| Quarter | Q2 2024 | Q1 2024 | Q4 2023 | Q3 2023 |
|---|---|---|---|---|
| EPS Estimate | 1.54 | 1.46 | 1.31 | 1.29 |
| EPS Actual | 1.60 | 1.49 | 1.50 | 0.60 |
| Price Change % | 2.0% | 0.0% | 1.0% | 1.0% |
Performance of Stifel Financial Shares
Shares of Stifel Financial were trading at $101.48 as of October 21. Over the last 52-week period, shares are up 81.58%. Given that these returns are generally positive, long-term shareholders are likely bullish going into this earnings release.
To track all earnings releases for Stifel Financial visit their earnings calendar on our site.
This article was generated by Benzinga’s automated content engine and reviewed by an editor.
Market News and Data brought to you by Benzinga APIs
© 2024 Benzinga.com. Benzinga does not provide investment advice. All rights reserved.
An Overview of Moelis's Earnings
Moelis MC is set to give its latest quarterly earnings report on Wednesday, 2024-10-23. Here’s what investors need to know before the announcement.
Analysts estimate that Moelis will report an earnings per share (EPS) of $0.24.
Moelis bulls will hope to hear the company announce they’ve not only beaten that estimate, but also to provide positive guidance, or forecasted growth, for the next quarter.
New investors should note that it is sometimes not an earnings beat or miss that most affects the price of a stock, but the guidance (or forecast).
Overview of Past Earnings
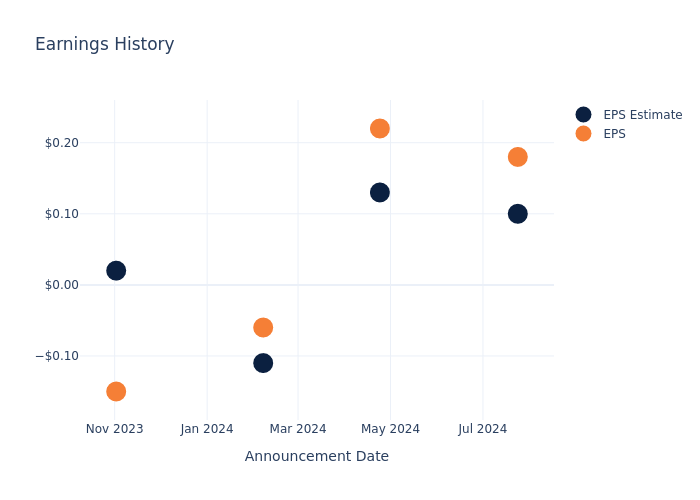
The company’s EPS beat by $0.08 in the last quarter, leading to a 6.42% increase in the share price on the following day.
Here’s a look at Moelis’s past performance and the resulting price change:
| Quarter | Q2 2024 | Q1 2024 | Q4 2023 | Q3 2023 |
|---|---|---|---|---|
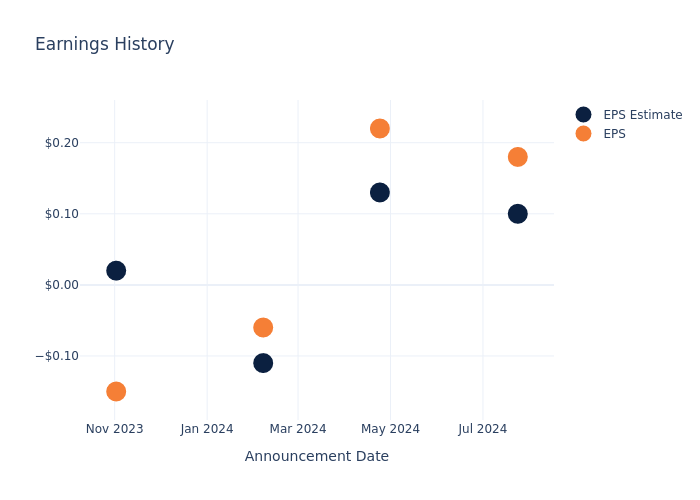
| EPS Estimate | 0.10 | 0.13 | -0.11 | 0.02 |
| EPS Actual | 0.18 | 0.22 | -0.06 | -0.15 |
| Price Change % | 6.0% | -7.000000000000001% | 1.0% | -1.0% |
Stock Performance
Shares of Moelis were trading at $70.64 as of October 21. Over the last 52-week period, shares are up 78.93%. Given that these returns are generally positive, long-term shareholders are likely bullish going into this earnings release.
To track all earnings releases for Moelis visit their earnings calendar on our site.
This article was generated by Benzinga’s automated content engine and reviewed by an editor.
Market News and Data brought to you by Benzinga APIs
© 2024 Benzinga.com. Benzinga does not provide investment advice. All rights reserved.

