ADT's Earnings: A Preview
ADT ADT is preparing to release its quarterly earnings on Thursday, 2024-10-24. Here’s a brief overview of what investors should keep in mind before the announcement.
Analysts expect ADT to report an earnings per share (EPS) of $0.14.
Investors in ADT are eagerly awaiting the company’s announcement, hoping for news of surpassing estimates and positive guidance for the next quarter.
It’s worth noting for new investors that stock prices can be heavily influenced by future projections rather than just past performance.
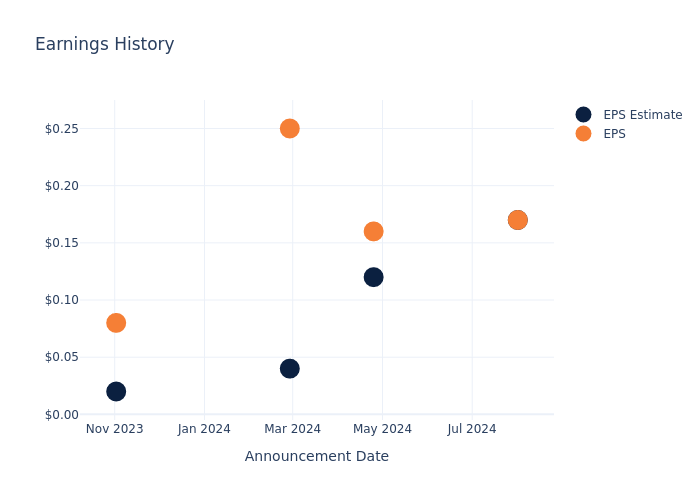
Earnings Track Record
During the last quarter, the company reported an EPS missed by $0.00, leading to a 2.26% drop in the share price on the subsequent day.
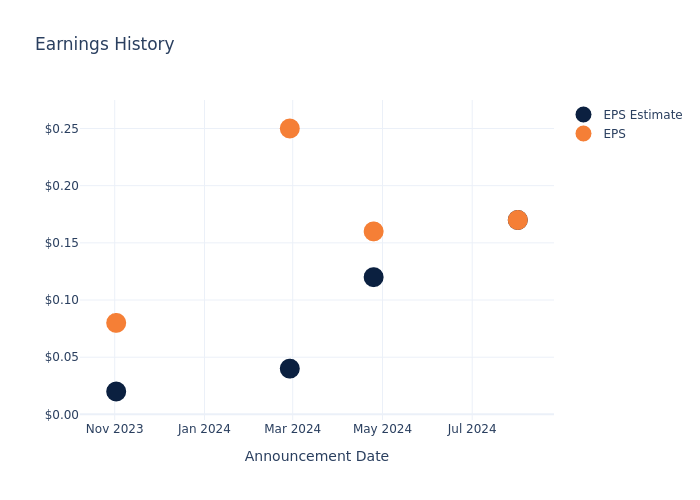
Here’s a look at ADT’s past performance and the resulting price change:
| Quarter | Q2 2024 | Q1 2024 | Q4 2023 | Q3 2023 |
|---|---|---|---|---|
| EPS Estimate | 0.17 | 0.12 | 0.04 | 0.02 |
| EPS Actual | 0.17 | 0.16 | 0.25 | 0.08 |
| Price Change % | -2.0% | 2.0% | 1.0% | -6.0% |
Tracking ADT’s Stock Performance
Shares of ADT were trading at $6.96 as of October 22. Over the last 52-week period, shares are up 17.81%. Given that these returns are generally positive, long-term shareholders are likely bullish going into this earnings release.
To track all earnings releases for ADT visit their earnings calendar on our site.
This article was generated by Benzinga’s automated content engine and reviewed by an editor.
Market News and Data brought to you by Benzinga APIs
© 2024 Benzinga.com. Benzinga does not provide investment advice. All rights reserved.
Cardano Falls More Than 4% In 24 hours
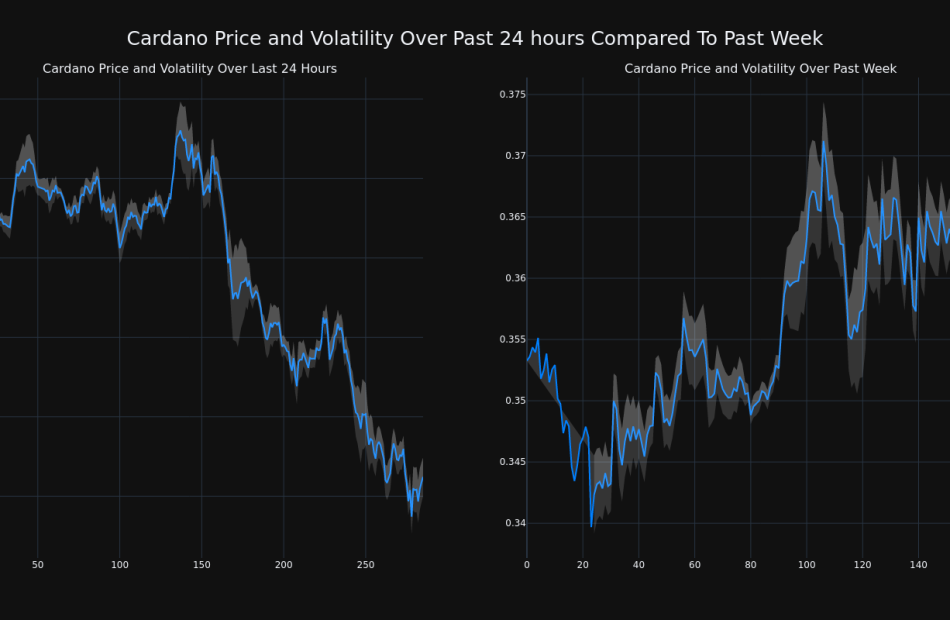
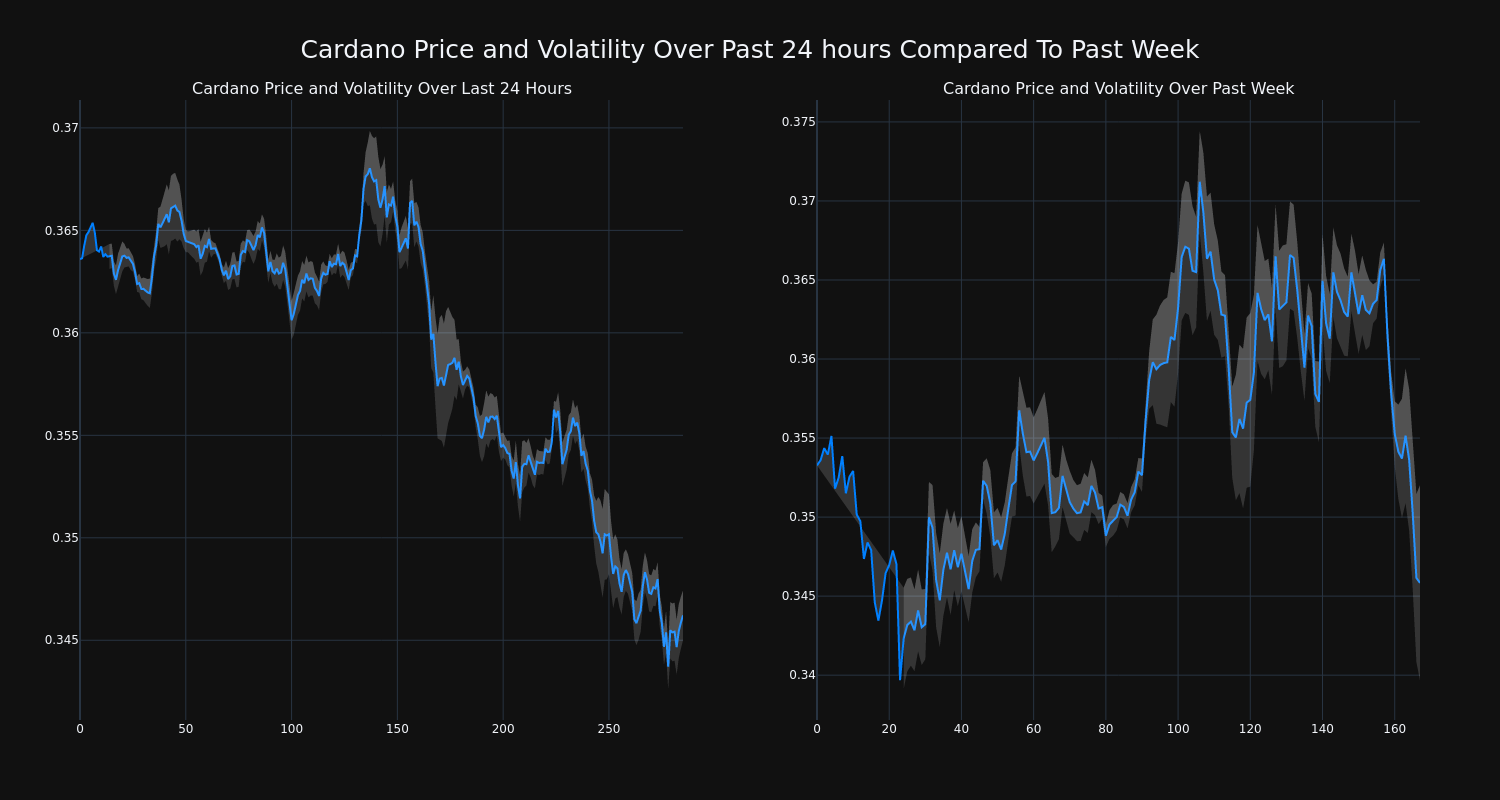
Over the past 24 hours, Cardano’s ADA/USD price has fallen 4.59% to $0.35. This continues its negative trend over the past week where it has experienced a 2.0% loss, moving from $0.35 to its current price.
The chart below compares the price movement and volatility for Cardano over the past 24 hours (left) to its price movement over the past week (right). The gray bands are Bollinger Bands, measuring the volatility for both the daily and weekly price movements. The wider the bands are, or the larger the gray area is at any given moment, the larger the volatility.
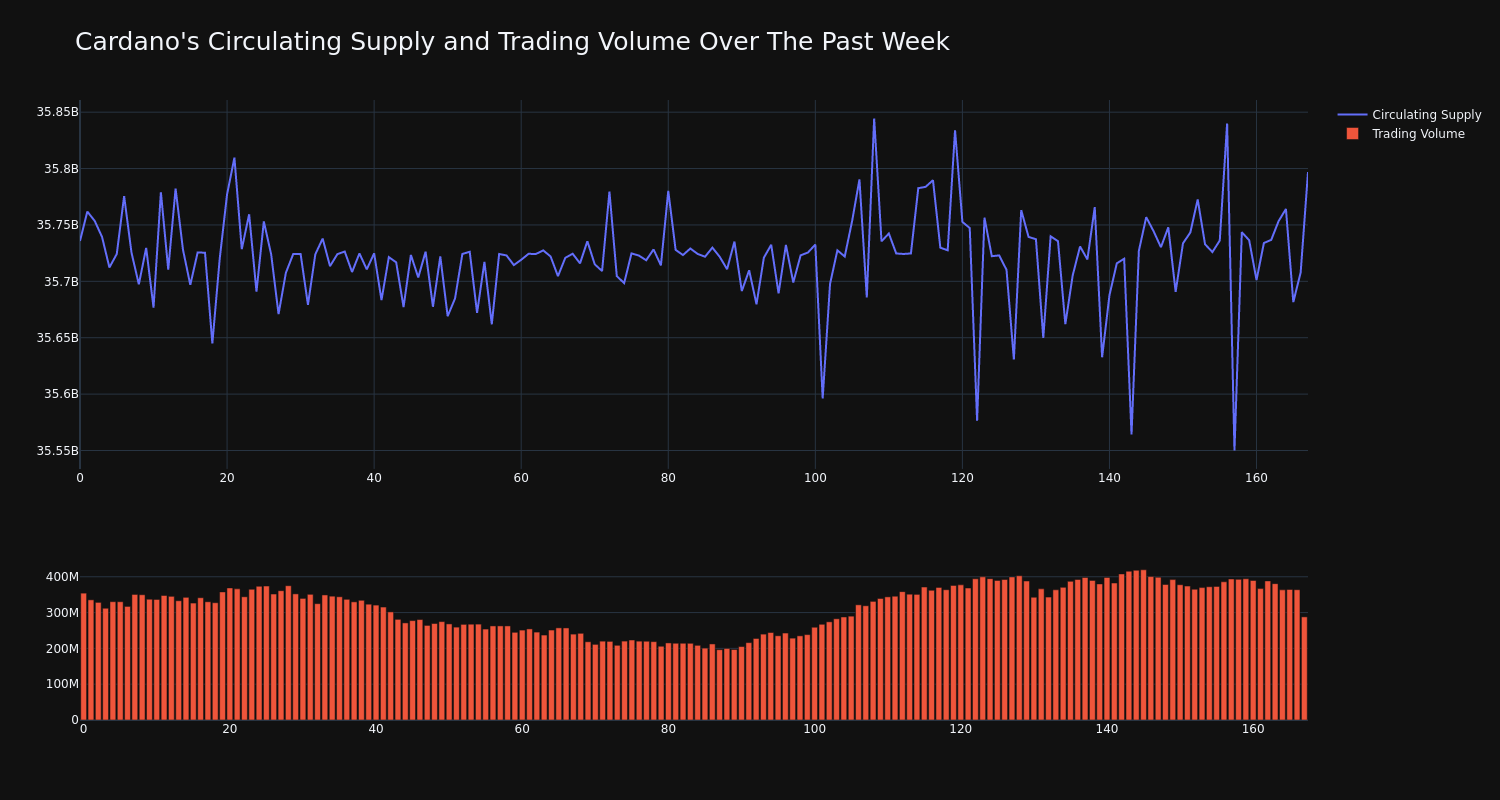
The trading volume for the coin has decreased 19.0% over the past week, while the overall circulating supply of the coin has increased 0.17% to over 35.73 billion. This puts its current circulating supply at an estimated 79.41% of its max supply, which is 45.00 billion. The current market cap ranking for ADA is #12 at $12.39 billion.
This article was generated by Benzinga’s automated content engine and reviewed by an editor.
Market News and Data brought to you by Benzinga APIs
© 2024 Benzinga.com. Benzinga does not provide investment advice. All rights reserved.
Check Out What Whales Are Doing With OXY
Deep-pocketed investors have adopted a bearish approach towards Occidental Petroleum OXY, and it’s something market players shouldn’t ignore. Our tracking of public options records at Benzinga unveiled this significant move today. The identity of these investors remains unknown, but such a substantial move in OXY usually suggests something big is about to happen.
We gleaned this information from our observations today when Benzinga’s options scanner highlighted 27 extraordinary options activities for Occidental Petroleum. This level of activity is out of the ordinary.
The general mood among these heavyweight investors is divided, with 25% leaning bullish and 66% bearish. Among these notable options, 12 are puts, totaling $1,654,155, and 15 are calls, amounting to $911,281.
Projected Price Targets
Taking into account the Volume and Open Interest on these contracts, it appears that whales have been targeting a price range from $45.0 to $67.5 for Occidental Petroleum over the last 3 months.
Analyzing Volume & Open Interest
In terms of liquidity and interest, the mean open interest for Occidental Petroleum options trades today is 4460.96 with a total volume of 13,002.00.
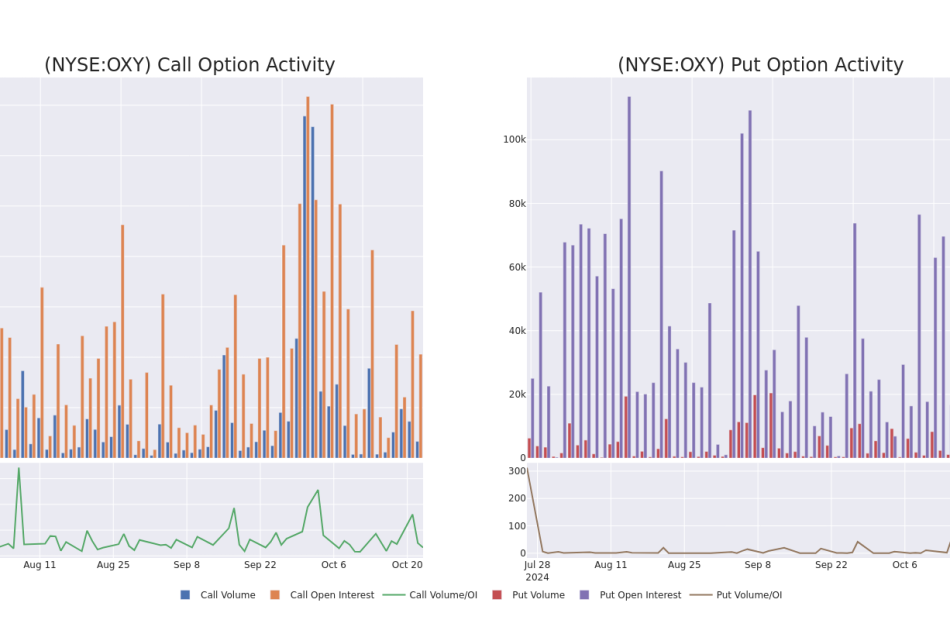
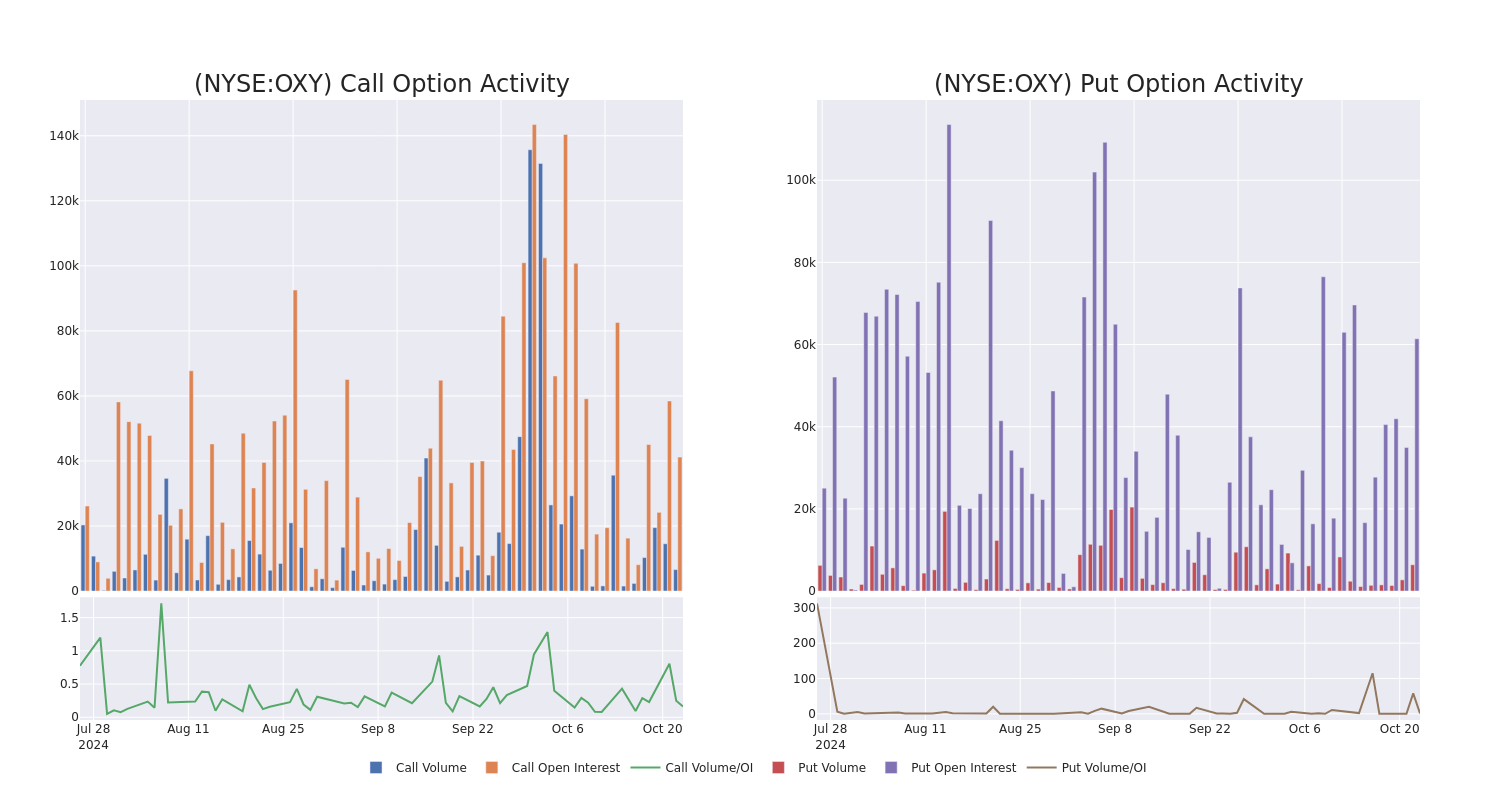
In the following chart, we are able to follow the development of volume and open interest of call and put options for Occidental Petroleum’s big money trades within a strike price range of $45.0 to $67.5 over the last 30 days.
Occidental Petroleum Option Volume And Open Interest Over Last 30 Days
Noteworthy Options Activity:
| Symbol | PUT/CALL | Trade Type | Sentiment | Exp. Date | Ask | Bid | Price | Strike Price | Total Trade Price | Open Interest | Volume |
|---|---|---|---|---|---|---|---|---|---|---|---|
| OXY | PUT | TRADE | BULLISH | 01/16/26 | $3.4 | $3.3 | $3.31 | $45.00 | $595.8K | 5.8K | 1.8K |
| OXY | PUT | SWEEP | BEARISH | 01/16/26 | $12.4 | $12.3 | $12.4 | $62.50 | $243.0K | 1.1K | 197 |
| OXY | CALL | SWEEP | BULLISH | 09/19/25 | $7.5 | $7.4 | $7.5 | $50.00 | $225.0K | 684 | 316 |
| OXY | PUT | SWEEP | BEARISH | 01/16/26 | $10.65 | $10.6 | $10.65 | $60.00 | $181.0K | 6.0K | 171 |
| OXY | PUT | SWEEP | BEARISH | 01/16/26 | $16.35 | $16.25 | $16.35 | $67.50 | $174.9K | 539 | 109 |
About Occidental Petroleum
Occidental Petroleum is an independent exploration and production company with operations in the United States, Latin America, and the Middle East. At the end of 2023, the company reported net proved reserves of nearly 4 billion barrels of oil equivalent. Net production averaged 1,234 thousand barrels of oil equivalent per day in 2023 at a ratio of roughly 50% oil and natural gas liquids and 50% natural gas.
In light of the recent options history for Occidental Petroleum, it’s now appropriate to focus on the company itself. We aim to explore its current performance.
Present Market Standing of Occidental Petroleum
- Currently trading with a volume of 4,085,232, the OXY’s price is down by -1.74%, now at $51.2.
- RSI readings suggest the stock is currently is currently neutral between overbought and oversold.
- Anticipated earnings release is in 20 days.
What The Experts Say On Occidental Petroleum
5 market experts have recently issued ratings for this stock, with a consensus target price of $63.2.
Unusual Options Activity Detected: Smart Money on the Move
Benzinga Edge’s Unusual Options board spots potential market movers before they happen. See what positions big money is taking on your favorite stocks. Click here for access.
* An analyst from Evercore ISI Group has decided to maintain their Underperform rating on Occidental Petroleum, which currently sits at a price target of $63.
* An analyst from Susquehanna has decided to maintain their Positive rating on Occidental Petroleum, which currently sits at a price target of $77.
* Maintaining their stance, an analyst from Scotiabank continues to hold a Sector Outperform rating for Occidental Petroleum, targeting a price of $65.
* Reflecting concerns, an analyst from Goldman Sachs lowers its rating to Neutral with a new price target of $55.
* An analyst from Wells Fargo persists with their Equal-Weight rating on Occidental Petroleum, maintaining a target price of $56.
Options are a riskier asset compared to just trading the stock, but they have higher profit potential. Serious options traders manage this risk by educating themselves daily, scaling in and out of trades, following more than one indicator, and following the markets closely.
If you want to stay updated on the latest options trades for Occidental Petroleum, Benzinga Pro gives you real-time options trades alerts.
Market News and Data brought to you by Benzinga APIs
© 2024 Benzinga.com. Benzinga does not provide investment advice. All rights reserved.
An Overview of Deckers Outdoor's Earnings
Deckers Outdoor DECK is preparing to release its quarterly earnings on Thursday, 2024-10-24. Here’s a brief overview of what investors should keep in mind before the announcement.
Analysts expect Deckers Outdoor to report an earnings per share (EPS) of $1.21.
Deckers Outdoor bulls will hope to hear the company announce they’ve not only beaten that estimate, but also to provide positive guidance, or forecasted growth, for the next quarter.
New investors should note that it is sometimes not an earnings beat or miss that most affects the price of a stock, but the guidance (or forecast).
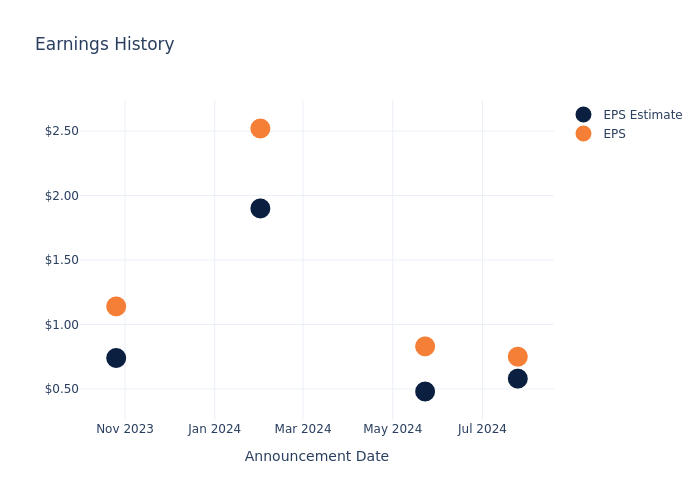
Overview of Past Earnings
During the last quarter, the company reported an EPS beat by $0.17, leading to a 6.32% increase in the share price on the subsequent day.
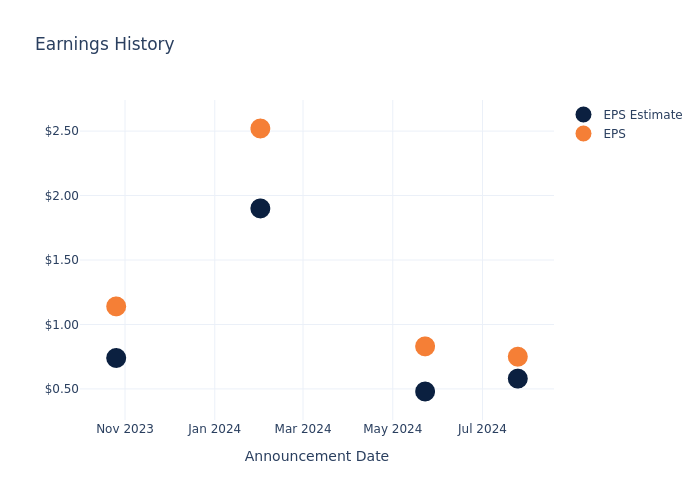
Here’s a look at Deckers Outdoor’s past performance and the resulting price change:
| Quarter | Q1 2025 | Q4 2024 | Q3 2024 | Q2 2024 |
|---|---|---|---|---|
| EPS Estimate | 0.58 | 0.48 | 1.90 | 0.74 |
| EPS Actual | 0.75 | 0.83 | 2.52 | 1.14 |
| Price Change % | 6.0% | 14.000000000000002% | 14.000000000000002% | 19.0% |
Stock Performance
Shares of Deckers Outdoor were trading at $154.05 as of October 22. Over the last 52-week period, shares are up 88.09%. Given that these returns are generally positive, long-term shareholders are likely bullish going into this earnings release.
Analyst Opinions on Deckers Outdoor
Understanding market sentiments and expectations within the industry is crucial for investors. This analysis delves into the latest insights on Deckers Outdoor.
The consensus rating for Deckers Outdoor is Outperform, based on 16 analyst ratings. With an average one-year price target of $692.3, there’s a potential 349.4% upside.
Comparing Ratings with Competitors
In this analysis, we delve into the analyst ratings and average 1-year price targets of Skechers USA, Birkenstock Holding and Crocs, three key industry players, offering insights into their relative performance expectations and market positioning.
- The consensus outlook from analysts is an Buy trajectory for Skechers USA, with an average 1-year price target of $78.0, indicating a potential 49.37% downside.
- Analysts currently favor an Outperform trajectory for Birkenstock Holding, with an average 1-year price target of $68.0, suggesting a potential 55.86% downside.
- The consensus among analysts is an Outperform trajectory for Crocs, with an average 1-year price target of $166.86, indicating a potential 8.32% upside.
Summary of Peers Analysis
Within the peer analysis summary, vital metrics for Skechers USA, Birkenstock Holding and Crocs are presented, shedding light on their respective standings within the industry and offering valuable insights into their market positions and comparative performance.
| Company | Consensus | Revenue Growth | Gross Profit | Return on Equity |
|---|---|---|---|---|
| Deckers Outdoor | Outperform | 22.13% | $470M | 5.53% |
| Skechers USA | Buy | 7.21% | $1.18B | 3.35% |
| Birkenstock Holding | Outperform | 19.35% | $335.93M | 2.87% |
| Crocs | Outperform | 3.65% | $681.92M | 14.09% |
Key Takeaway:
Deckers Outdoor ranks at the top for Gross Profit and Return on Equity among its peers. It is in the middle for Revenue Growth.
All You Need to Know About Deckers Outdoor
Deckers Outdoor Corp designs and sells casual and performance footwear, apparel, and accessories. Primary brands include UGG, Teva, and Sanuk. The company distributes Majority of its products through its wholesale business, but it also has a substantial direct-to-consumer business with its company-owned retail stores and websites. Majority of its sales are in the United States, although the company also has retail stores and distributors throughout Europe, Asia, Canada, and Latin America. It has structured their reporting around six segments which inlcudes the wholesale operations of specific brands like UGG, HOKA, Teva, Sanuk, and Other brands, alongside a segment focused on direct-to-consumer (DTC) operations.
Deckers Outdoor’s Financial Performance
Market Capitalization Highlights: Above the industry average, the company’s market capitalization signifies a significant scale, indicating strong confidence and market prominence.
Revenue Growth: Deckers Outdoor displayed positive results in 3 months. As of 30 June, 2024, the company achieved a solid revenue growth rate of approximately 22.13%. This indicates a notable increase in the company’s top-line earnings. As compared to competitors, the company surpassed expectations with a growth rate higher than the average among peers in the Consumer Discretionary sector.
Net Margin: The company’s net margin is a standout performer, exceeding industry averages. With an impressive net margin of 14.01%, the company showcases strong profitability and effective cost control.
Return on Equity (ROE): Deckers Outdoor’s financial strength is reflected in its exceptional ROE, which exceeds industry averages. With a remarkable ROE of 5.53%, the company showcases efficient use of equity capital and strong financial health.
Return on Assets (ROA): Deckers Outdoor’s ROA stands out, surpassing industry averages. With an impressive ROA of 3.59%, the company demonstrates effective utilization of assets and strong financial performance.
Debt Management: With a below-average debt-to-equity ratio of 0.13, Deckers Outdoor adopts a prudent financial strategy, indicating a balanced approach to debt management.
To track all earnings releases for Deckers Outdoor visit their earnings calendar on our site.
This article was generated by Benzinga’s automated content engine and reviewed by an editor.
© 2024 Benzinga.com. Benzinga does not provide investment advice. All rights reserved.
This Is What Whales Are Betting On Thor Industries
Deep-pocketed investors have adopted a bearish approach towards Thor Industries THO, and it’s something market players shouldn’t ignore. Our tracking of public options records at Benzinga unveiled this significant move today. The identity of these investors remains unknown, but such a substantial move in THO usually suggests something big is about to happen.
We gleaned this information from our observations today when Benzinga’s options scanner highlighted 10 extraordinary options activities for Thor Industries. This level of activity is out of the ordinary.
The general mood among these heavyweight investors is divided, with 30% leaning bullish and 50% bearish. Among these notable options, 8 are puts, totaling $367,070, and 2 are calls, amounting to $188,275.
Expected Price Movements
After evaluating the trading volumes and Open Interest, it’s evident that the major market movers are focusing on a price band between $100.0 and $105.0 for Thor Industries, spanning the last three months.
Volume & Open Interest Development
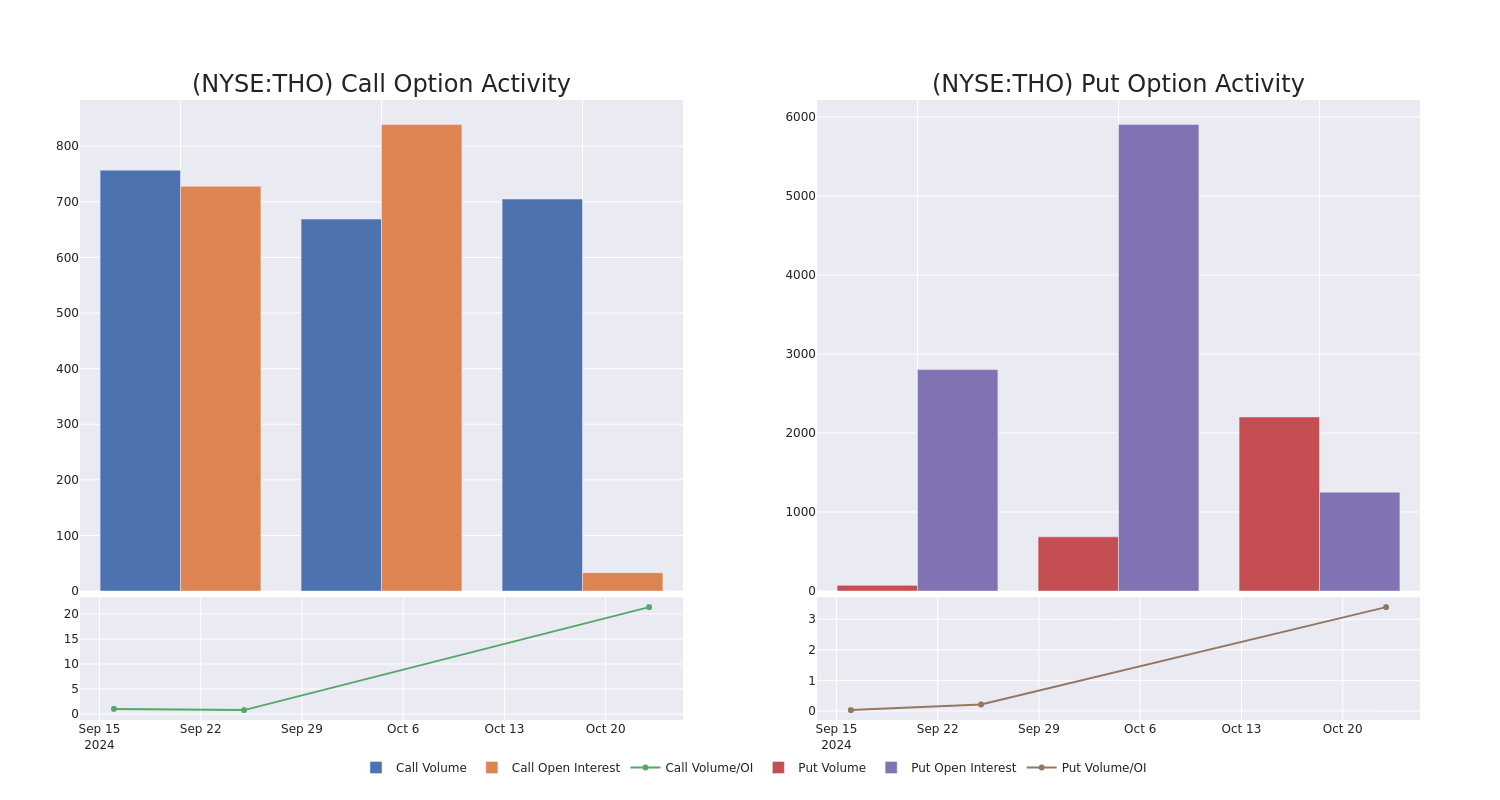
In terms of liquidity and interest, the mean open interest for Thor Industries options trades today is 428.0 with a total volume of 2,908.00.
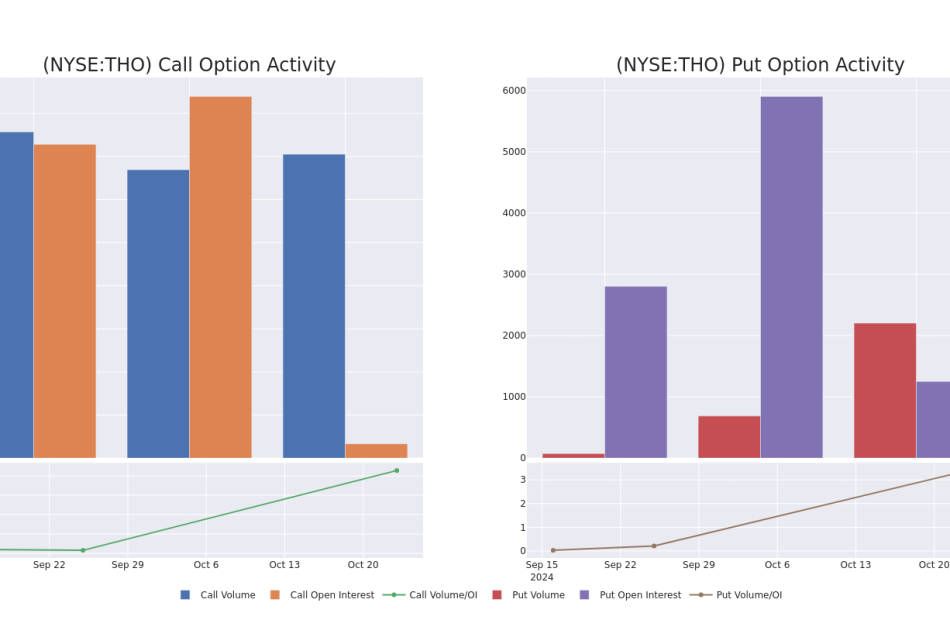
In the following chart, we are able to follow the development of volume and open interest of call and put options for Thor Industries’s big money trades within a strike price range of $100.0 to $105.0 over the last 30 days.
Thor Industries Option Volume And Open Interest Over Last 30 Days
Noteworthy Options Activity:
| Symbol | PUT/CALL | Trade Type | Sentiment | Exp. Date | Ask | Bid | Price | Strike Price | Total Trade Price | Open Interest | Volume |
|---|---|---|---|---|---|---|---|---|---|---|---|
| THO | CALL | SWEEP | BULLISH | 11/15/24 | $4.2 | $4.2 | $4.2 | $105.00 | $107.5K | 33 | 517 |
| THO | CALL | SWEEP | BULLISH | 11/15/24 | $4.2 | $3.9 | $3.9 | $105.00 | $80.7K | 33 | 188 |
| THO | PUT | SWEEP | NEUTRAL | 12/20/24 | $6.0 | $5.6 | $5.7 | $105.00 | $60.3K | 537 | 359 |
| THO | PUT | SWEEP | BEARISH | 12/20/24 | $3.8 | $3.5 | $3.8 | $100.00 | $57.0K | 714 | 716 |
| THO | PUT | SWEEP | BULLISH | 12/20/24 | $6.0 | $5.7 | $5.7 | $105.00 | $55.8K | 537 | 110 |
About Thor Industries
Based in Elkhart, Indiana, Thor Industries manufactures Class A, Class B, and Class C motor homes along with travel trailers and fifth-wheel towables across about 35 brands. Through the acquisition of Erwin Hymer in 2019, the company expanded its geographic footprint and now produces various motorized and towable recreational vehicles for Europe, including motor caravans, camper vans, urban vehicles, caravans, and other RV-related products and services. The company has also begun generating revenue through aftermarket component parts via the acquisition of Airxcel in 2021; however, this is still a nascent part of the business as it accounts for less than 10% of total sales. In fiscal 2024, the company wholesaled 186,908 units and generated over $10 billion in revenue.
After a thorough review of the options trading surrounding Thor Industries, we move to examine the company in more detail. This includes an assessment of its current market status and performance.
Present Market Standing of Thor Industries
- Trading volume stands at 329,112, with THO’s price down by -3.7%, positioned at $104.56.
- RSI indicators show the stock to be is currently neutral between overbought and oversold.
- Earnings announcement expected in 42 days.
Turn $1000 into $1270 in just 20 days?
20-year pro options trader reveals his one-line chart technique that shows when to buy and sell. Copy his trades, which have had averaged a 27% profit every 20 days. Click here for access.
Options trading presents higher risks and potential rewards. Astute traders manage these risks by continually educating themselves, adapting their strategies, monitoring multiple indicators, and keeping a close eye on market movements. Stay informed about the latest Thor Industries options trades with real-time alerts from Benzinga Pro.
Market News and Data brought to you by Benzinga APIs
© 2024 Benzinga.com. Benzinga does not provide investment advice. All rights reserved.
Polling Highlights Key Concerns Ahead of November Presidential Election
Austin, TX, Oct. 22, 2024 (GLOBE NEWSWIRE) — As we approach the critical November Presidential Election, national polling from the Cicero Institute reveals key insights into voter priorities and attitudes. The survey was conducted October 7–11, 2024, and had a ±2.94 margin of error.
Economy Remains Top Priority
Across party lines, voters overwhelmingly identify the economy as the most urgent issue to address in the coming year. A significant 42% of all voters, including 55% of Republicans and 41% of Independents, cite the economy as their primary concern. Healthcare, public education, and public safety trail behind, with just 24%, 19%, and 14% of voters, respectively, prioritizing these areas. This data highlights the need for candidates to present clear economic policies as part of their campaign strategy, particularly to capture the attention of swing voters.
Desire for Efficient Government Leadership
When asked who they believe is better equipped to lead an agency focused on improving government efficiency, voters are leaning towards experience outside of politics. More than half of all voters (53%) favor a successful business owner, with Independents showing notable support at 54%. This preference, particularly among undecided voters, suggests a growing appetite for leadership that brings private sector expertise to government rather than career politicians.
Presidential Election Neck-and-Neck
The race for the presidency appears evenly split, with former President Donald Trump and Vice President Kamala Harris each garnering 42% of the vote across all voters. However, when broken down by party, 85% of Republicans support Trump, while 83% of Democrats back Harris. Independents are a crucial battleground, with 33% split evenly between both candidates and 17% still undecided. This highlights the critical role that Independent voters will play in determining the outcome of the election.
Why This Matters
Cicero Institute Director of Communications and author of the poll said, “Voters are making it clear: the economy and efficient leadership are their top priorities. This election isn’t just about party lines; it’s about who can deliver real solutions to the challenges Americans are facing. With so many undecided voters, especially among Independents, the race is wide open, and that’s where the story lies.”
With the economy at the forefront of voter concerns, coupled with the desire for business-minded leadership, the upcoming election will hinge on which candidate can effectively address these issues. Independents, in particular, are poised to play a decisive role in this election, and both campaigns will need to focus on economic policies and government efficiency to win their support.
The November election is shaping up to be a pivotal moment, with voter sentiment clearly focused on leadership that delivers real economic solutions.

Stefani Buhajla
The Cicero Institute
3866817625
media@ciceroinstitute.org
Market News and Data brought to you by Benzinga APIs
© 2024 Benzinga.com. Benzinga does not provide investment advice. All rights reserved.
Beyond Earnings Preview
Beyond BYON will release its quarterly earnings report on Thursday, 2024-10-24. Here’s a brief overview for investors ahead of the announcement.
Analysts anticipate Beyond to report an earnings per share (EPS) of $-0.67.
Anticipation surrounds Beyond’s announcement, with investors hoping to hear about both surpassing estimates and receiving positive guidance for the next quarter.
New investors should understand that while earnings performance is important, market reactions are often driven by guidance.
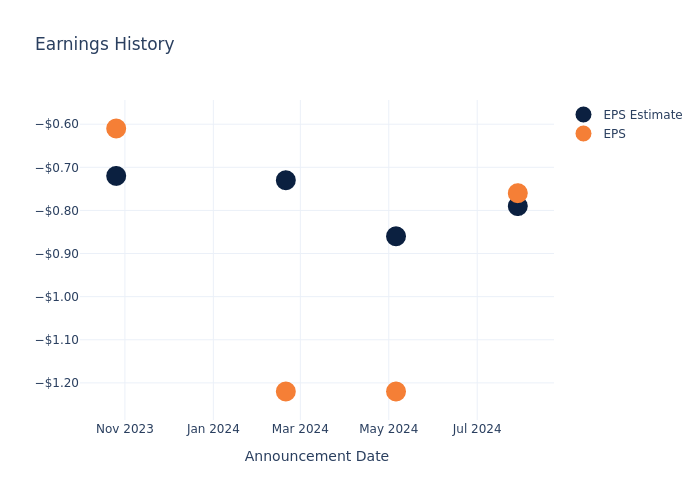
Overview of Past Earnings
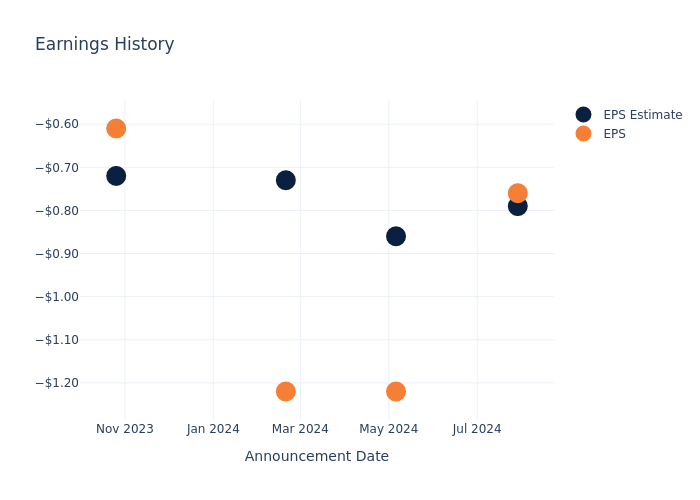
The company’s EPS beat by $0.03 in the last quarter, leading to a 9.79% drop in the share price on the following day.
Here’s a look at Beyond’s past performance and the resulting price change:
| Quarter | Q2 2024 | Q1 2024 | Q4 2023 | Q3 2023 |
|---|---|---|---|---|
| EPS Estimate | -0.79 | -0.86 | -0.73 | -0.72 |
| EPS Actual | -0.76 | -1.22 | -1.22 | -0.61 |
| Price Change % | -10.0% | -25.0% | -2.0% | -10.0% |
Market Performance of Beyond’s Stock
Shares of Beyond were trading at $10.16 as of October 22. Over the last 52-week period, shares are down 37.47%. Given that these returns are generally negative, long-term shareholders are likely unhappy going into this earnings release.
To track all earnings releases for Beyond visit their earnings calendar on our site.
This article was generated by Benzinga’s automated content engine and reviewed by an editor.
Market News and Data brought to you by Benzinga APIs
© 2024 Benzinga.com. Benzinga does not provide investment advice. All rights reserved.
Boeing reports $6B quarterly loss with big union vote looming
Boeing (BA) released third quarter earnings on Wednesday morning, highlighting the precarious nature of the plane maker ahead of another momentous event: a labor vote set for later Wednesday.
Boeing reported a net loss of $6.17 billion, bringing total losses in 2024 so far to nearly $8 billion. It said operating cash flow was at a loss of $1.34 billion. The company reported revenue of about $17.8 billion, down about 1% from the same period last year. The figures closely matched the preliminary numbers it released last week.
Boeing said its operating cash flow reflected “lower commercial widebody deliveries, as well as unfavorable working capital timing, including the impact of the IAM work stoppage.” A year ago, Boeing’s operating cash flow stood at $22 million.
On the conference call, Boeing CFO Brian West said the company expects to burn more cash in the fourth quarter, that the company expects negative free cash flow for full-year 2025, and that the 37-plane delivery target for the 737 Max would be delayed. The company also said its financial forecasts and long-term outlook were under review.
Boeing stock was down 3% in early trade.
“This is a big ship that will take some time to turn, but when it does, it has the capacity to be great again,” new CEO Kelly Ortberg said in a message to employees on the results.
In its preliminary report last week, Boeing said it would end production of its 767 tanker jet and push back the release of its upcoming 777X widebody jet. The company also said it would take $5 billion in pre-tax charges, with $3 billion coming from the commercial airlines division and $2 billion coming from its defense business.
Boeing also entered into an agreement to secure $10 billion in supplemental credit from a consortium of banks and filed a mixed shelf registration with the SEC to offer up to $25 billion in new debt securities, common stock, preferred stock, and other share offerings. The Wall Street Journal reported Boeing would pursue a $10 billion stock offering via the filing, sources said.
Boeing said it had $10.5 billion in cash and securities on hand at the end of the quarter. The company also reported it had a total backlog of $511 billion, which included over 5,400 commercial airplanes.
The new credit agreement and debt and stock offerings come as the company is mired in a labor dispute with its largest labor union, representing 30,000 workers.
Ortberg also announced the company would lay off 10% of its labor force, or around 17,000 employees, across all the divisions to shore up its financial position.
If You Invested $100 In This Stock 15 Years Ago, You Would Have $600 Today
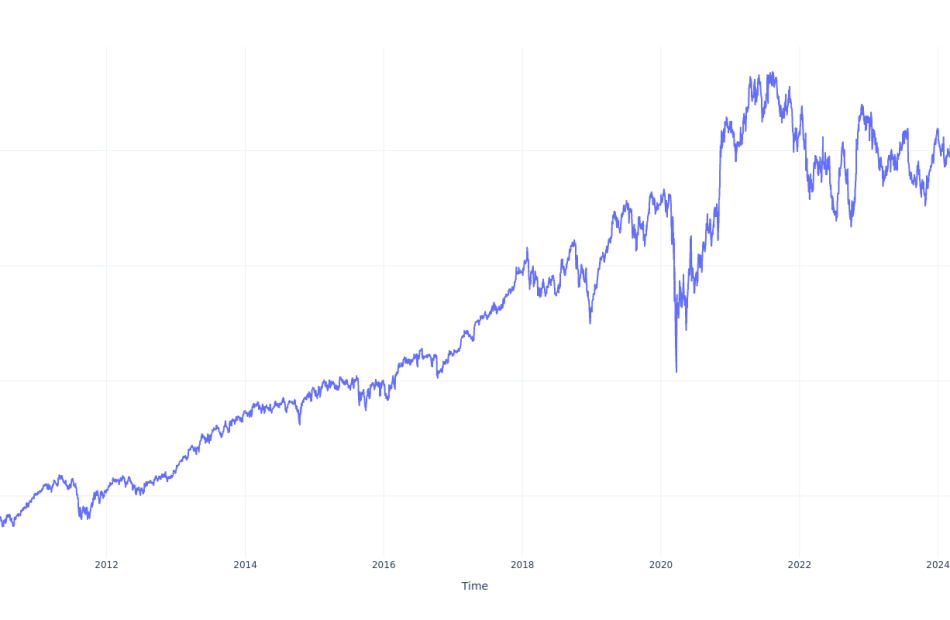
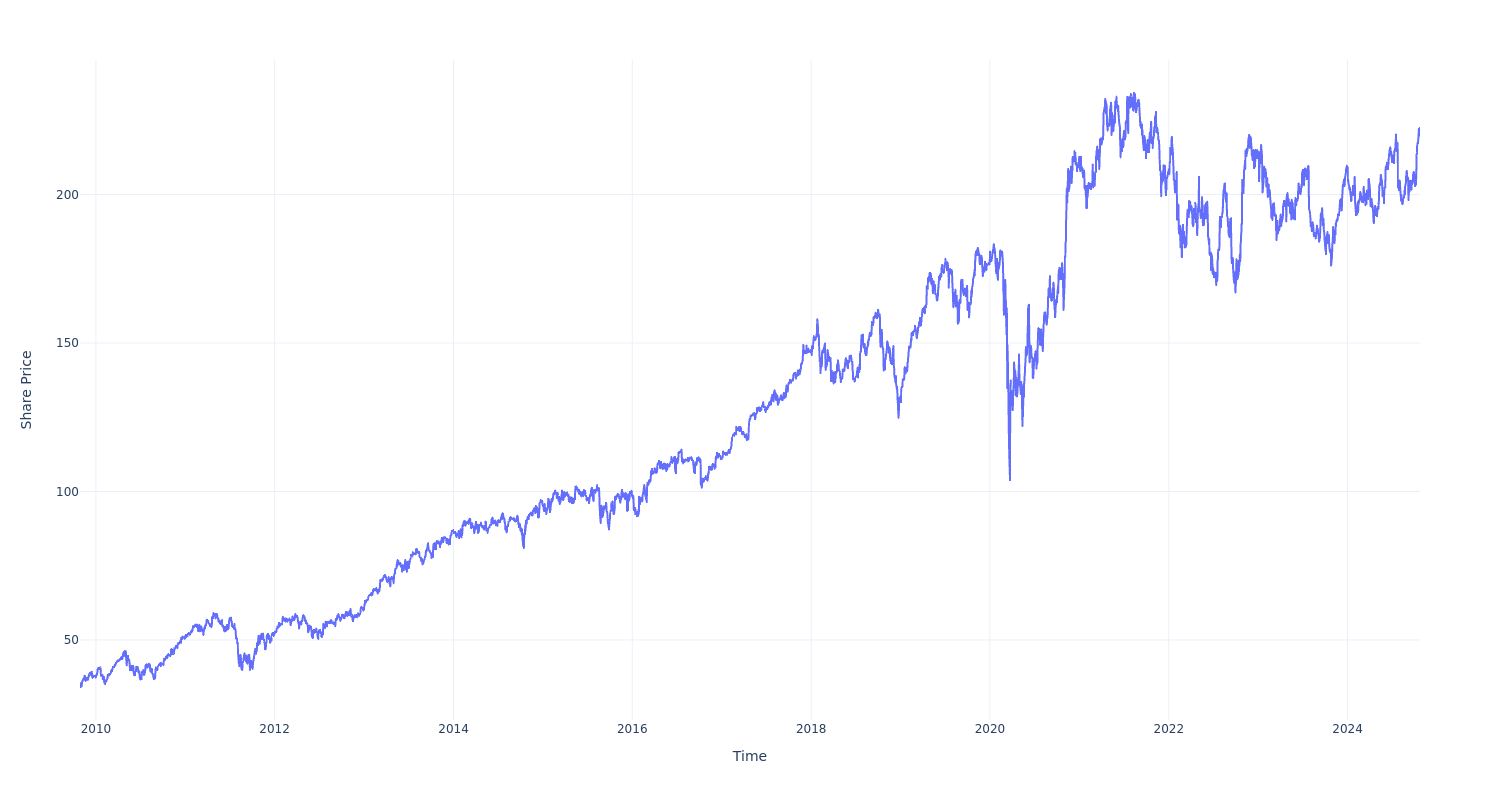
Honeywell Intl HON has outperformed the market over the past 15 years by 1.04% on an annualized basis producing an average annual return of 12.94%. Currently, Honeywell Intl has a market capitalization of $142.77 billion.
Buying $100 In HON: If an investor had bought $100 of HON stock 15 years ago, it would be worth $630.77 today based on a price of $219.75 for HON at the time of writing.
Honeywell Intl’s Performance Over Last 15 Years
Finally — what’s the point of all this? The key insight to take from this article is to note how much of a difference compounded returns can make in your cash growth over a period of time.
This article was generated by Benzinga’s automated content engine and reviewed by an editor.
Market News and Data brought to you by Benzinga APIs
© 2024 Benzinga.com. Benzinga does not provide investment advice. All rights reserved.
Summerwell Sunterra Now Offering Tours
Opening marks Greystar’s first build for rent project in the Houston area
KATY, Texas, Oct. 22, 2024 /PRNewswire/ — Greystar, a global leader in the investment, development, and management of real estate, including rental housing, logistics and life sciences, announced today that its latest Summerwell-branded community, Summerwell Sunterra, is now offering tours and welcoming move-ins.
Summerwell is Greystar’s dedicated build for rent brand focused on developing purpose-built, single-family rental communities across the United States. This approach to build for rent adds single-family housing supply while striving to deliver efficient and scalable communities in target markets that need this product most.
“We’re excited to open our doors at Summerwell Sunterra to renters looking for the privacy and comfort of a single family home without the hassles of ownership,” Brian Herwald, Managing Director of development for Greystar said. “Residents also have the added benefit of living within the master planned Sunterra community with access to The Retreat Amenity Village and so much more. Whether floating along the lazy river, grabbing a game of pickleball or hosting a barbecue in their private backyard, our residents will get the feeling of getting away from it all on a daily basis.”
The amenities in the Retreat Amenity Village, which is a across the street, include:
- Resort-style pool
- Lazy river
- Kids splash zone
- Boardwalk
- Event lawn
- Pickleball courts
- Horseshoe pits
- Yoga lawn
- Dog park
- Resident lounge
Residents also have access to Sunterra’s nearby 3.5-acre Crystal Lagoon. The lagoon features a beach-like area with sand, cabanas and a floating dock that allows kayaks and paddleboards to launch. The Crystal Lagoon is slated to open in May 2025.
Summerwell Sunterra consists of 156 townhomes and detached single-family rental homes in three- and four-bedroom layouts that range from 1,500 sq. ft. to 1,800 sq. ft. Each home features a two-car garage, beautiful landscaping and fully fenced-in private backyard.
Homes will also include:
- 20′ deep driveways
- Open concept floor plans bathed in natural light
- Granite countertops
- Hardwood-style floors available in two options
- Oversized primary closets
- SmartRent smart home features with electronic locks, thermostats and hub
- Ceiling fans
- Stainless steel appliances
- Washer and dryer
- Storage space
To schedule a tour, please visit www.summerwellsunterra.com.
About Greystar
Greystar is a leading, fully integrated global real estate company offering expertise in property management, investment management, development, and construction services in institutional-quality rental housing, logistics, and life sciences sectors. Headquartered in Charleston, South Carolina, Greystar manages and operates more than $320 billion of real estate in approximately 250 markets globally with offices throughout North America, Europe, South America, and the Asia-Pacific region. Greystar is the largest operator of apartments in the United States, manages nearly 997,000 units/beds globally, and has a robust institutional investment management platform comprised of over $78 billion of assets under management, including $36 billion of development assets. Greystar was founded by Bob Faith in 1993 to become a provider of world-class service in the rental residential real estate business. To learn more, visit www.greystar.com
![]() View original content to download multimedia:https://www.prnewswire.com/news-releases/summerwell-sunterra-now-offering-tours-302283676.html
View original content to download multimedia:https://www.prnewswire.com/news-releases/summerwell-sunterra-now-offering-tours-302283676.html
SOURCE Greystar
Market News and Data brought to you by Benzinga APIs
© 2024 Benzinga.com. Benzinga does not provide investment advice. All rights reserved.

