Thompson Thrift Brings Class A Industrial Space to Queen Creek, Arizona
Development is part of the company’s robust near-term commercial pipeline in Arizona
PHOENIX, Nov. 7, 2024 /PRNewswire/ — Thompson Thrift, a full-service nationally recognized real estate company engaged in industrial, commercial, multifamily, mixed-use and retail projects across the country, announced today that it has completed construction on the first phase of Germann Commerce Center industrial development in Queen Creek, a thriving suburb southeast of Phoenix.
“Thompson Thrift Commercial is continuing a significant period of expansion and growth,” said Dan Sink, president and chief financial officer for Thompson Thrift Development. “We are excited to have completed the first phase of Germann Commerce Center and are looking forward to continuing to expand our industrial development platform.”
Located on the southwest corner of Germann and Meridian Roads, the first phase of Germann Commerce Center consists of approximately 400,000 square feet of speculative light industrial space in five standalone buildings spread across approximately 26 acres. The buildings offer front-park/rear-load industrial, with clear heights from 28 to 32 feet and frontage on East Germann Road. Thompson Thrift will complete the build-out of the speculative office space in phase I by the end of the year.
The second phase is being marketed for build-to-suit and for-sale options. At full build-out, Thompson Thrift expects to have just over 1 million square feet of warehouse, distribution, light assembly and manufacturing space between 12 buildings on approximately 70 acres.
The Germann Commerce Center is the closest industrial facility to LG Energy Solution, which is underway with a $5.5 billion battery manufacturing complex that is expected to create 4,000 new jobs and propel them to be Queen Creek’s largest employer. The first 1.7 million square feet is expected to be completed in early 2026.
Ashlee Boyd, managing partner for Thompson Thrift Commercial stated, “It has been rewarding for our team to complete the first phase of Germann Commerce Center and bring Class A industrial space to Queen Creek to help support the rapidly growing economic growth in the community. It is developments like this, along with our strong pipeline, that continue to fuel our excitement for the future.”
Thompson Thrift remains very active throughout Arizona with a variety of mixed-use, retail and industrial developments. The first phase of Elliot Tech Center, the company’s mixed-use project in Mesa’s highly acclaimed Elliot Road Technology Corridor, is more than 45% leased and continuing to see strong leasing activity due to its strategic location and on-site amenities which help to differentiate the project. A second phase of the project will add approximately 622,000 square feet of industrial space. The company is currently marketing this expansion area for lease, sale or build-to-suit.
Pointe17 is another mixed-use development underway near the $40+ billion Taiwan Semiconductor Plant (TSMC) in northern Phoenix. The company has signed 12 leases with nationally recognized retailers and expects to begin delivering spaces during the fourth quarter. The 224-unit residential component of the development, Refinery at Pointe17, is underway with first resident move-ins projected for summer 2025, and these units will benefit from pedestrian connectivity to the onsite retail amenities.
Retail construction will commence in the next six months for South Bridge Marketplace in Maricopa and will include a 130,000-square-foot home improvement anchor which is currently under construction, a planned grocery store and additional retail and restaurant space. In addition, Thompson Thrift will complete construction late this year on District 99, a Sprouts-anchored shopping center near the intersection of Interstate 10 and Loop 101 in Phoenix. The project is nearly fully leased and will be home to many other retailers and restaurants including Shake Shack, Hawaiian Brothers and Dave’s Hot Chicken.
Thompson Thrift aims to begin construction on The Gilmore, a mixed-use project in the Phoenix suburb of Gilbert, in early 2025. The Gilmore will be a premier mixed-use project located at one of the most dynamic intersections in Gilbert at the northwest corner of Val Vista & Germann. This upscale project will contain approximately 190,000 square feet of retail and restaurant space including a 65,000-square-foot national grocery anchor and 300 vertically integrated multifamily units.
Thompson Thrift is a full-service real estate development company focused on ground-up commercial and mixed-use development with a 22-state footprint across the Midwest, Southeast and Southwest. Since its founding nearly 40 years ago, Thompson Thrift has invested more than $5 billion into local communities and has become known as a trusted partner committed to developing high-quality, attractive commercial and multifamily communities.
About Thompson Thrift Real Estate Company
Thompson Thrift is an integrated full-service real estate company with offices in Indianapolis and Terre Haute, Indiana; Denver; Houston and Phoenix. Three business units drive Thompson Thrift’s success—Thompson Thrift Residential which is focused on upscale Class A multifamily communities and luxury leased homes, Thompson Thrift Commercial which is focused on ground-up commercial development, and Thompson Thrift Construction, a full-service construction company. Through these business units, Thompson Thrift is engaged in all aspects of development, construction, leasing, and management of quality commercial real estate projects across the country. The company earned national recognition as a winner of a 2024 Top Workplaces USA award, the latest accolade that reflects the company’s ongoing commitment to excellence in the community and workplace. For more information, please visit www.thompsonthrift.com
Contact:
Jennifer Franklin
Spotlight Marketing Communications
949.427.1385
jennifer@spotlightmarcom.com
![]() View original content to download multimedia:https://www.prnewswire.com/news-releases/thompson-thrift-brings-class-a-industrial-space-to-queen-creek-arizona-302298590.html
View original content to download multimedia:https://www.prnewswire.com/news-releases/thompson-thrift-brings-class-a-industrial-space-to-queen-creek-arizona-302298590.html
SOURCE Thompson Thrift
© 2024 Benzinga.com. Benzinga does not provide investment advice. All rights reserved.
Carbon Nanotubes Market Size & Share to Surpass USD 19.9 billion by 2031 | Transparency Market Research, Inc.
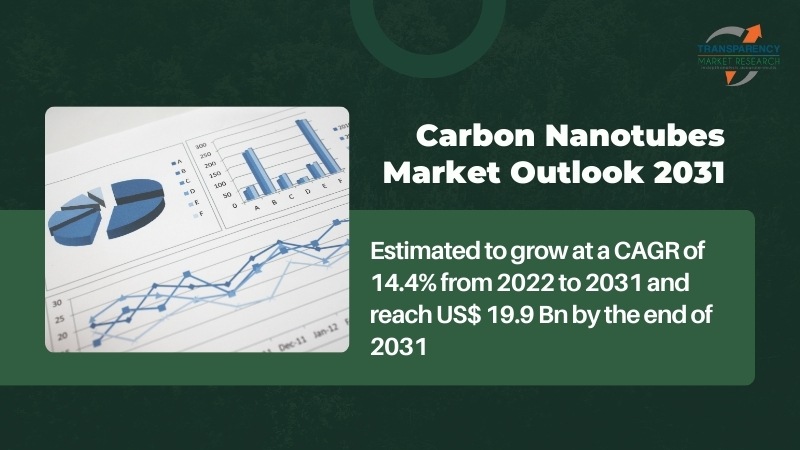
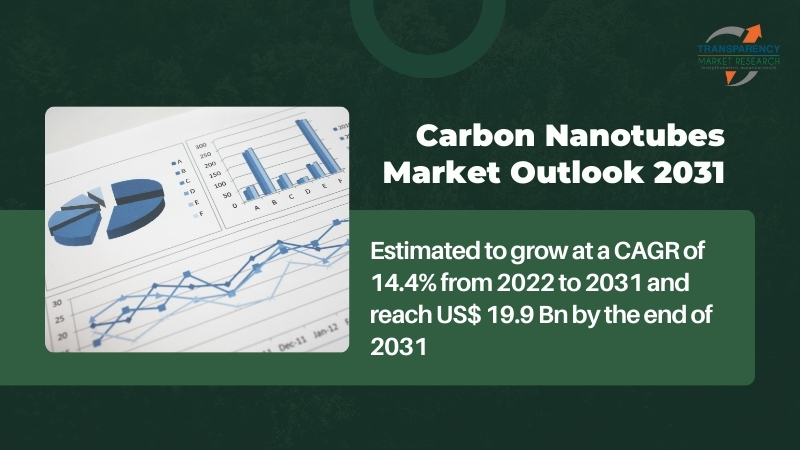
Wilmington, Delaware, United States, Transparency Market Research Inc. -, Nov. 07, 2024 (GLOBE NEWSWIRE) — The global carbon nanotubes market (탄소나노튜브 시장) is estimated to flourish at a CAGR of 14.4% from 2022 to 2031. Transparency Market Research projects that the overall sales revenue for carbon nanotubes is estimated to reach US$ 19.9 billion by the end of 2031.
A significant driver is the emergence of nanotubes in sports equipment manufacturing. Carbon nanotubes’ exceptional mechanical properties contribute to the production of stronger, lighter, and more resilient sports gear such as tennis rackets, bicycles, and golf clubs. Their integration enhances durability and performance, attracting interest from athletes and sports enthusiasts.
The growing utilization of carbon nanotubes in desalination technologies is an emerging driver. Nanotubes’ unique properties enable enhanced filtration capabilities, aiding in the removal of impurities from water more efficiently. This application is vital in addressing water scarcity issues globally, particularly in arid regions, driving the adoption of carbon nanotubes in water treatment processes.
The development of nanotube-based sensors for environmental monitoring is a significant driver. These sensors detect and analyze pollutants in air and water with exceptional sensitivity, contributing to improved environmental monitoring and pollution control efforts.
Request for sample PDF copy of report: https://www.transparencymarketresearch.com/sample/sample.php?flag=S&rep_id=239
Carbon Nanotubes Market: Competitive Landscape
The carbon nanotubes market presents a competitive landscape shaped by technological advancements and strategic collaborations. Leading players like Nanocyl, Arkema, and Showa Denko dominate with diverse product portfolios and extensive R&D initiatives. Emerging contenders such as OCSiAl and Raymor Industries challenge norms with novel production methods and superior quality offerings.
The market witnesses intensified competition due to the material’s application versatility across electronics, aerospace, and healthcare sectors. Focus on enhancing production efficiency, cost-effectiveness, and exploring new applications drives continuous innovation, reshaping the carbon nanotubes market and fueling the quest for breakthroughs in material science and technology. Some prominent manufacturers are as follows:
- Arkema
- Cabot Corporation
- CHASM
- Cheap Tubes
- Jiangsu Cnano Technology Co.
- Klein Commodities
- LG CHEM
- Nano-c
- Nanocyl SA
- Nanostructured & Amorphous Materials Inc.
Key Findings of the Market Report
- Multi-wall carbon nanotubes lead the market due to their superior mechanical strength, conductivity, and versatility in various industrial applications.
- Electricals & electronics lead the carbon nanotubes market, driven by demand for high-performance materials in cutting-edge technology applications.
- Asia Pacific leads the carbon nanotubes market, driven by robust industrialization, extensive research initiatives, and growing electronics and automotive sectors.
Carbon Nanotubes Market Growth Drivers & Trends
- Rising demand for lightweight, high-performance materials in electronics drives carbon nanotubes’ usage in batteries, displays, and semiconductors.
- Adoption of carbon nanotubes for lightweight composites, enhancing aircraft durability and fuel efficiency.
- Increasing utilization in drug delivery systems, imaging technologies, and tissue engineering for enhanced medical solutions.
- Growing emphasis on eco-friendly materials in construction, automotive, and energy sectors propels the demand for carbon nanotubes.
- Continuous R&D initiatives focused on improving production methods, cost-efficiency, and expanding applications drive market evolution.
Unlock Growth Potential in Your Industry! Download PDF Brochure: https://www.transparencymarketresearch.com/sample/sample.php?flag=S&rep_id=239
Global Carbon Nanotubes Market: Regional Profile
- North America, led by key players like Nanocyl and Hyperion Catalysis International, experiences substantial growth due to extensive research initiatives and robust adoption of nanotechnology. The region’s focus on technological innovation, particularly in electronics and aerospace, drives the demand for carbon nanotubes.
- In Europe, dominated by companies like Arkema and Thomas Swan & Co., stringent environmental regulations promote sustainable applications of carbon nanotubes. This region emphasizes their usage in automotive, construction, and healthcare sectors, encouraging eco-friendly advancements.
- The Asia Pacific region, with major players like Showa Denko and Hanwha Solutions, encounters rapid market growth. Factors such as extensive industrialization, burgeoning electronics market, and government investments in research contribute to the escalating demand for carbon nanotubes across various applications.
Product Portfolio
- Klein Commodities offers a diverse portfolio in the commodities market. Specializing in trading precious metals, energy, and agricultural products, Klein Commodities provides tailored solutions and investment opportunities for client’s worldwide, ensuring reliability and profitability.
- LG CHEM excels in innovative chemical solutions. Their portfolio spans advanced materials, batteries, and electronic components, driving innovation in diverse industries with a focus on sustainability and cutting-edge technology.
- Nano-C pioneers advanced materials for emerging technologies. Their portfolio includes cutting-edge carbon nanotubes and fullerenes, fueling innovations in electronics, energy storage, and biomedical applications, ensuring superior performance and functionality.
Carbon Nanotubes Market: Key Segments
By Product Type
- Single-wall Carbon Nanotubes
- Multi-wall Carbon Nanotubes
By Application
- Polymers
- Energy
- Electricals & Electronics
- Others (Medical, Chemical, Optical Devices, etc.)
By Region
- North America
- Latin America
- Europe
- Asia Pacific
- Middle East & Africa
Buy this Premium Research Report: https://www.transparencymarketresearch.com/checkout.php?rep_id=239<ype=S
Browse More Reports by TMR:
Flat Roofing Market (平屋根市場The industry was valued at US$ 30.9 Bn in 2021. It is estimated to grow at a CAGR of 5.4% from 2022 to 2031 and reach US$ 52.3 Bn by the end of 2031.
PVC Emulsion Market (Markt für PVC-Emulsionen) – The industry was valued at US$ 3.5 Bn in 2021. It is estimated to grow at a CAGR of 4.3% from 2022 to 2031 and reach US$ 5.1 Bn by the end of 2031.
About Transparency Market Research
Transparency Market Research, a global market research company registered at Wilmington, Delaware, United States, provides custom research and consulting services. Our exclusive blend of quantitative forecasting and trends analysis provides forward-looking insights for thousands of decision makers. Our experienced team of Analysts, Researchers, and Consultants use proprietary data sources and various tools & techniques to gather and analyses information.
Our data repository is continuously updated and revised by a team of research experts, so that it always reflects the latest trends and information. With a broad research and analysis capability, Transparency Market Research employs rigorous primary and secondary research techniques in developing distinctive data sets and research material for business reports.
Contact:
Transparency Market Research Inc.
CORPORATE HEADQUARTER DOWNTOWN,
1000 N. West Street,
Suite 1200, Wilmington, Delaware 19801 USA
Tel: +1-518-618-1030
USA – Canada Toll Free: 866-552-3453
Website: https://www.transparencymarketresearch.com
Email: sales@transparencymarketresearch.com
Follow Us: LinkedIn| Twitter| Blog | YouTube

© 2024 Benzinga.com. Benzinga does not provide investment advice. All rights reserved.
Trump Election Raises Odds Of 'Roaring 2020s Scenario,' Veteran Wall Street Investor Says: How High Could US Stock Market Rise?
The U.S. stock market erupted with gains following Donald Trump‘s victory in the 2024 presidential election and a potential Republican sweep of Congress. This sets the stage for what some analysts call a new “Roaring 2020s.”
The S&P 500 — tracked by the SPDR S&P 500 ETF Trust SPY — jumped 2.5% to fresh record highs on Wednesday, marking its best one-day performance in nearly two years and the strongest ever in a post-Election day.
Analysts and investors speculate that Trump’s planned corporate tax cuts and deregulation could fuel a prolonged rally in the stock market.
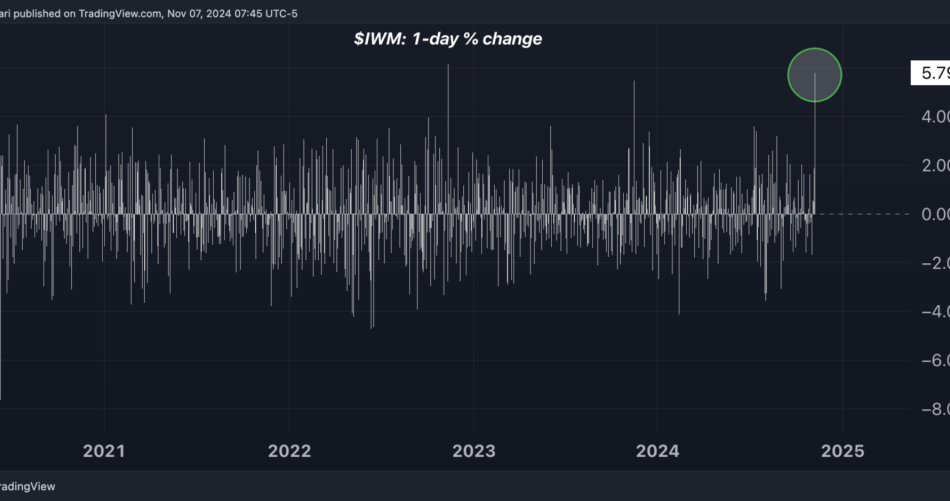
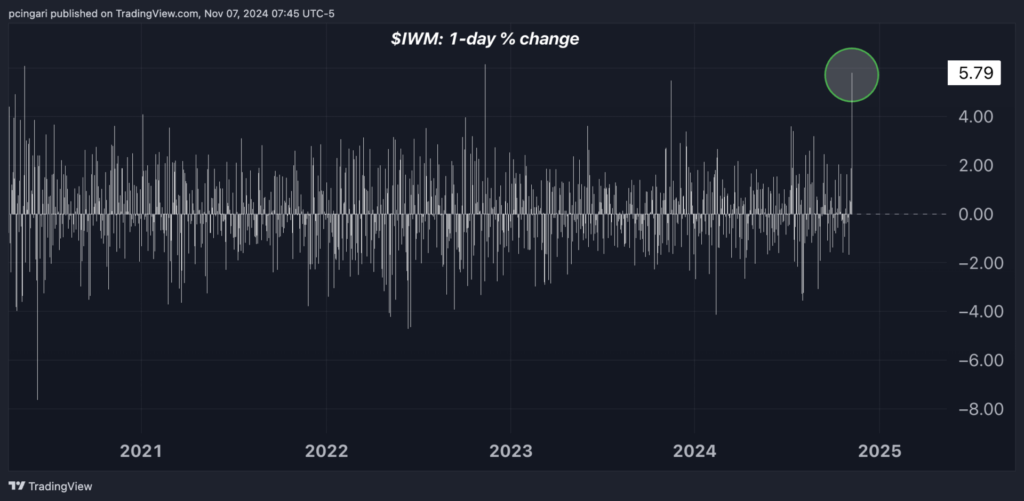
Notably, small-cap stocks, represented by the iShares Russell 2000 ETF Trust IWM, surged 5.8%, reflecting investor optimism that domestic-focused companies could benefit most from protectionist policies expected under Trump’s administration.
Chart: Small Caps Jump Nearly 6% After Election Day
A ‘Roaring 2020s’ Market Rally?
Veteran Wall Street investor Ed Yardeni described this post-election surge as “consistent with a Roaring 2020s scenario.” Yardeni believes that Trump’s policies could increase the odds of robust economic growth, strong corporate earnings, and an extended bull market.
“Stocks soared today on the widespread perception that Trump 2.0 will include a cut in the corporate tax rate and reductions in business regulations,” Yardeni wrote in a note on Thursday.
According to Yardeni, the conditions are shaping up for an economic boom similar to the 1920s — a period of rapid economic growth, technological advancement, and soaring stock prices.
But the economic boom of the 1920s eventually led to a stock market crash in 1929 and the onset of the Great Depression.
Yardeni draws a parallel, quoting Mark Twain: “History doesn’t repeat itself, but it often rhymes.”
The expert assigns a 50% probability to the “Roaring 2020s” scenario, a 20% probability to a “1990s-style stock market meltup,” and a 30% chance of a “1970s-style geopolitical crisis with a possible U.S. debt crisis.”
Yardeni also indicates that he is considering increasing the probability of the Roaring 2020s scenario, given the likelihood of a more business-friendly environment under Trump.
How High Could The S&P 500 Go?
Yardeni has bold projections for the S&P 500 if the “Roaring 2020s” scenario materializes.
He estimates an average annual return of around 11% for the S&P 500, including reinvested dividends.
This forecast sharply contrasts with the one presented by Goldman Sachs last month, where analysts at the investment bank predicted a decade of modest gains for stocks, with the S&P 500 averaging just 3% annually over the next 10 years.
In Yardeni’s view, stocks remain the best hedge against inflation, as companies can often pass on higher costs to consumers.
Under his “Roaring 2020s” scenario, strong productivity growth and stable inflation rates could bolster corporate profits and sustain the market’s upward trajectory.
Yardeni expects the S&P 500 could climb to 8,000 by the end of the decade, driven largely by rising corporate earnings rather than inflated valuation multiples.
Read now:
Market News and Data brought to you by Benzinga APIs
© 2024 Benzinga.com. Benzinga does not provide investment advice. All rights reserved.
Potato Protein Market Size Surges to USD 381.5 Million by 2031 at a 6.9% CAGR, Boosted by Advancements in Plant Protein Production| Analysis by Transparency Market Research, Inc.
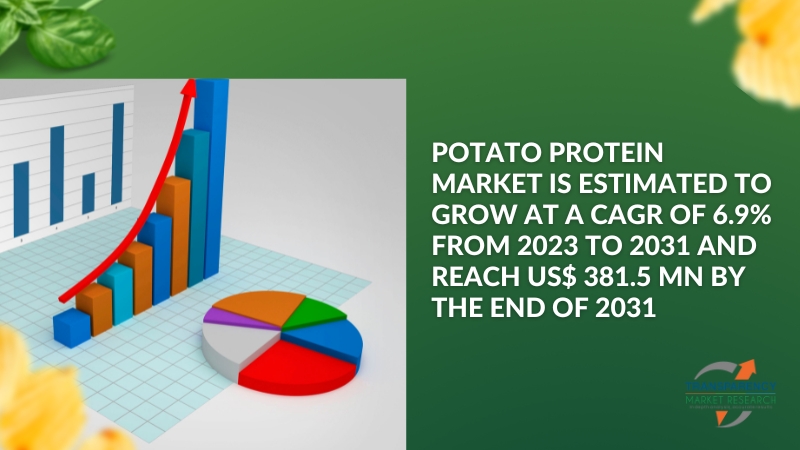
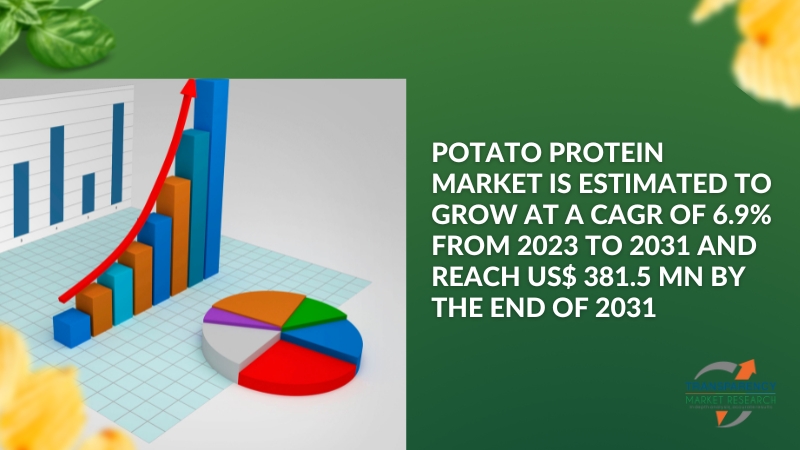
Wilmington, Delaware, United States, Transparency Market Research, Inc. , Nov. 07, 2024 (GLOBE NEWSWIRE) — The global potato protein market was projected to attain US$ 209.6 million in 2022. It is anticipated to garner a 6.9% CAGR from 2023 to 2031 and by 2031 the market is likely to attain US$ 381.5 million by 2031.
Leading companies in the market are making significant investments to advance the development of potato extract proteins and enhance the production process. In an effort to produce a fully plant-based product, the industry is moving toward using plant-based stabilizers and emulsifiers because of the growing consumer awareness of food additives and allergies.
Download Sample PDF Copy of the Potato Protein Market Research Summary Now –https://www.transparencymarketresearch.com/sample/sample.php?flag=S&rep_id=36767
As political unrest and climate change disrupt the supply chains for protein resources and threaten food security, plant-based proteins like those found in potatoes will become increasingly important to our future.
Global Potato Protein Market: Key Players
Prominent producers are concentrating on the ethical and sustainable source of potatoes. This can be attributed to growing concerns over foodstuffs, particularly proteins used in cooking, coming from sources free of animal cruelty and that practice.
To satisfy the growing demand from the profitable vegan food and sports nutrition industries, vendors are also making major investments in the production of potato extract proteins and tuberous crop proteins. The following companies are well-known participants in the global potato protein market:
- Tereos
- Avebe U.A.
- AGRANA Beteiligungs-AG
- Roquette Frères S. A.
- Bioriginal Food and Science Corp.
- Duynie Group
- Kemin Industries Inc.
- Meelunie B.V.
- KMC Kartoffelmelcentralen A.M.B.A
- Lyckeby Starch AB
- AKV Langholt AmbA
- Emsland Group
- Kerry Group
- PPZ SA Niechlów
- PEPEES S.A
Key Findings of the Market Report
- The potato protein market is being driven by an increasing trend toward clean-label products and sustainable dietary alternatives.
- Potato proteins are popular healthy snack substitutes for typical snacks since they are used as components in dairy products, nutritious bars, and meat substitutes.
- The market for potato protein is in line with changing customer preferences, and producers in the food and beverage industry are attempting to include it in a range of snacks.
- Commercial plant protein synthesis is a relatively new development in food technology, and more work has to be done to lower the cost of and increase public accessibility to potato-based proteins.
- Potato protein is becoming more and more popular as a main ingredient in animal feed and nutritious bars, two profitable and well-liked possibilities.
Market Trends for Potato Protein
- The food and beverage sector has to incorporate agents that are used in foaming, emulsification, and gelling. For the technology and food services industries, it is imperative that synthetic versions of these chemicals be replaced. Agents derived from potatoes provide special qualities such improved taste, texture, and product stability.
- The growing awareness of consumers towards food allergies and additives is propelling market growth. Suppliers are moving toward using the adaptable qualities of potato protein in their dairy, bread, and nutritious goods. In addition to fundamental components like plant- or dairy-based proteins, a report published in the Journal of Food Science claims that protein bars contain a sizable quantity of additional tastes and stabilizers.
- Stabilizers and additives made from potato protein are becoming more popular as companies in the food industry work to produce products which are entirely plant-based.
Unlock Growth Potential in Your Industry! Download PDF Brochure: https://www.transparencymarketresearch.com/sample/sample.php?flag=S&rep_id=36767
Global Market for Potato Protein: Regional Outlook
Various reasons are propelling the growth of potato protein throughout the region. These are:
- In 2022, Asia Pacific held the majority of the global market share for potato protein. Market statistics are being driven by greater consumer awareness of food allergies and increased uptake of plant-based protein in the area.
- In the long run, plant-based proteins help populous nations like China and India strengthen their efforts towards food security as they adjust to supply chain disruptions brought on by climate change.
- Europe held a prominent position in the global scene in 2022. Due to the prevalence of potatoes, the continent accounts for the a significant share of the global potato production and consumption.
- A major movement toward veganism and a healthy diet among the younger population, along with better government rules, is expected to promote market growth.
Some key developments by the players in this market are:
- PerfectaSOL, a new line of potato products, was introduced in December 2023 by Avebe, a provider of ingredients based on potatoes located in the Netherlands. This substance can be utilized for confections, alternative dairy, and other culinary items. The innovative product has emulsification, smoothness, neutral white hue, and smoothness.
- The distribution business Brenntag and Avebe announced their partnership in July 2023. As a result, Brenntag would distribute Avebe’s goods, including protein components and potato starch, across Turkey.
Global Potato Protein Market Segmentation
Form
End Use
- Meat Alternatives
- Plant Based Dairy Products
- Nutritional Bars
- Others
Region
- North America
- Latin America
- Western Europe
- Eastern Europe
- South Asia & Pacific
- East Asia
- Middle East & Africa
Discover the untapped potential of the Potato Protein Market! Unlock valuable information about each segment. Place your order now- https://www.transparencymarketresearch.com/checkout.php?rep_id=36767<ype=S
More Trending Report by Transparency Market Research:
- Probiotics Market – The global probiotics market is estimated to flourish at a CAGR of 8.0% from 2023 to 2031.
- Curcumin Market – The global curcumin market was estimated at US$ 362.0 million in 2022. A CAGR of 6.7% is anticipated from 2023 to 2031, resulting in US$ 608.2 million in 2031.
About Transparency Market Research
Transparency Market Research, a global market research company registered at Wilmington, Delaware, United States, provides custom research and consulting services. Our exclusive blend of quantitative forecasting and trends analysis provides forward-looking insights for thousands of decision makers. Our experienced team of Analysts, Researchers, and Consultants use proprietary data sources and various tools & techniques to gather and analyses information.
Our data repository is continuously updated and revised by a team of research experts, so that it always reflects the latest trends and information. With a broad research and analysis capability, Transparency Market Research employs rigorous primary and secondary research techniques in developing distinctive data sets and research material for business reports.
Contact:
Transparency Market Research Inc.
CORPORATE HEADQUARTER DOWNTOWN,
1000 N. West Street,
Suite 1200, Wilmington, Delaware 19801 USA
Tel: +1-518-618-1030
USA – Canada Toll Free: 866-552-3453
Website: https://www.transparencymarketresearch.com
Email: sales@transparencymarketresearch.com
Follow Us: LinkedIn| Twitter| Blog | YouTube

Market News and Data brought to you by Benzinga APIs
© 2024 Benzinga.com. Benzinga does not provide investment advice. All rights reserved.
Cell And Gene Therapy Market Size to Worth USD 190.82 Billion by 2033 | Straits Research
New York, United States , Nov. 07, 2024 (GLOBE NEWSWIRE) — “Cell therapy” refers to the process of administering live cells to patients with the purpose of treating various diseases. Both autologous and allogeneic cells, which can be produced from stem cells found in places like bone marrow, can serve as the source of the cell. The treatment of bone marrow transplant patients often involves stem cell therapy. In the context of medical practice, “gene therapy” refers to any procedure that modifies, deletes, or otherwise alters a patient’s genetic code. In addition, it can change the way a person’s genes are expressed or fix genes that aren’t functioning properly. In this treatment, nucleic acid (DNA or RNA) is given to the patient together with carriers that are referred to as vectors.
Download Free Sample Report PDF @ https://straitsresearch.com/report/cell-and-gene-therapy-market/request-sample
Market Dynamics
Investing More in Pharmaceutical Research and Development
The majority of pharmaceutical companies continue to make significant investments in the development of new medications and equipment. The pharmaceutical business, in particular, is heavily invested in research and development. Pharmaceutical firms spend on research and development in order to bring high-quality, innovative goods to market. The trend implies that major pharma companies are enhancing their R&D efficiency by investing heavily in R&D in order to obtain long-term returns on their investment, as well as through collaborating on R&D.
Increase in the Incidence of Cancer and Heart Diseases
Cell therapy targets various diseases at the cellular level, such as by restoring a certain cell population or by using cells as carriers of the therapeutic carriers, whereas gene therapy aims to influence the course of various genetic and acquired disorders at the genetic level. Gene therapies also aim to treat inherited disorders as well as acquired ones. It is anticipated that the high incidence of cardiovascular illness would accelerate demand for cell and gene therapy, which will in turn fuel the growth of the market.
Clinical Studies for Cell and Gene Therapy Are Becoming More Common
Clinical tests are an essential component of medical research, and they provide assistance to the pharmaceutical and biopharmaceutical industries in their efforts to develop and bring innovative cell and gene treatments to market. Due to the increased need for innovative medications to satisfy unmet medical requirements, there has been a worldwide increase in the number of clinical trials that have been conducted during the past several years.
Regional Analysis
The North American cell and gene therapy market is driven by the region’s high economic position as well as the region’s high spending on healthcare services. Sponsorship and financial support for cell and gene therapy products come mostly from national health institutions, companies, academic institutes, and hospitals respectively.
To Gather Additional Insights on the Regional Analysis of the Cell And Gene Therapy Market @ https://straitsresearch.com/report/cell-and-gene-therapy-market/request-sample
Key Highlights
- The global cell and gene therapy market size was valued at USD 30.27 billion in 2024 and is projected to reach from USD 37.14 billion in 2025 to USD 190.82 billion by 2033, expanding at a CAGR of 22.7% from 2025 to 2033.
- An increase in the prevalence of cancer will drive the market.
- Investing in Pharmaceutical R&D will fuel the market growth.
- The global market is segmented into the following categories: type, indication, application, end user, and by region.
- Based on product type, the market for cell and gene therapy market is divided into two categories: cell therapy and gene therapy. In this market in the year 2020, the most significant share was held by cell therapy.
- Based on application the cell and gene therapy market is segmented into: Oncology, Dermatology, Musculoskeletal and others. The need for solutions including cell and gene therapy will be driven by factors such as the growing use of target gene treatments for dermatological conditions, the increasing demand for wound healing, and the treatment of burnt skin.
- Based on end-user the cell and gene therapy market is divided into Pharmaceuticals and Biotechnologies companies, academic and research institutes and other end users. It is anticipated that the section representing pharmaceutical and biotechnology firms would record the greatest CAGR by the end of the projected period in the year 2020.
- The North American cell and gene therapy market is driven by the region’s high economic position as well as the region’s high spending on healthcare services.
Competitive Players
- Thermo Fisher Scientific (US)
- Merck KGaA (Germany)
- Charles River Laboratories (US)
- Lonza (Switzerland)
- Catalent (US)
- WuXi AppTec (China)
- Takara Bio Inc. (Japan)
- Nikon Corporation (Japan)
- FUJIFILM Holdings Corporation (Japan)
- F. Hoffmann-La Roche Ltd. (Switzerland)
- Oxford Biomedica plc (UK)
- Cell and Gene Therapy Catapult (UK)
Recent Developments
- In 2021, Charles River Laboratories expanded its cell and gene therapy manufacturing capabilities by purchasing Cognate BioServices, a contract manufacturing organization (CMO) specializing in cell and gene therapy.
- Thermo Fisher Scientific paid roughly USD 859.7 million to buy Henogen S.A. in 2021. Henogen S.A. was the viral vector production company that Novasep operated in Belgium. Through this purchase, it will be able to strengthen its position in the manufacturing therapeutic market for cell and gene therapies.
- In 2019, Thermo Fisher Scientific spent $1.7 billion to purchase Brammer Bio, a firm whose primary business was the production of viral vectors for use in gene and cell treatments.
Segmentation
- By Therapy Type
- Cell therapy
- CAR-T
- CAR-NK
- B-Cell
- Other
- Gene Therapy
- Viral
- Non-Viral
- Cell therapy
- By Region
- North America
- Europe
- APAC
- LAMEA
Get Detailed Market Segmentation @ https://straitsresearch.com/report/cell-and-gene-therapy-market/segmentation
About Straits Research Pvt. Ltd.
Straits Research is a market intelligence company providing global business information reports and services. Our exclusive blend of quantitative forecasting and trends analysis provides forward-looking insight for thousands of decision-makers. Straits Research Pvt. Ltd. provides actionable market research data, especially designed and presented for decision making and ROI.
Whether you are looking at business sectors in the next town or crosswise over continents, we understand the significance of being acquainted with the client’s purchase. We overcome our clients’ issues by recognizing and deciphering the target group and generating leads with utmost precision. We seek to collaborate with our clients to deliver a broad spectrum of results through a blend of market and business research approaches.
For more information on your target market, please contact us below:
Phone: +1 646 905 0080 (U.S.)
+91 8087085354 (India)
+44 203 695 0070 (U.K.)
Email: sales@straitsresearch.com
Follow Us: LinkedIn | Facebook | Instagram | Twitter

Market News and Data brought to you by Benzinga APIs
© 2024 Benzinga.com. Benzinga does not provide investment advice. All rights reserved.
Social Commerce Market to Grow at a CAGR of 31.60%, Says Straits Research
New York, United States, Nov. 07, 2024 (GLOBE NEWSWIRE) — E-commerce plays a crucial role in retail and reshapes the social commerce market. Since the turn of the century, online shopping has expanded significantly as internet access has spread to every corner of the globe, and smartphones have become an integral part of the lives of billions of people. Social commerce has ushered in an entirely new realm of shopping, granting consumers access to a vastly expanded selection and helping to meet the growing demand for convenience. Due to the increasing popularity of online shopping and the convenience it offers, social commerce is gaining momentum. Customers can now order products with minimal effort from the comfort of their own homes. Social commerce platform sellers offer discounts, cashback, same-day or next-day deliveries, click-and-collect services, ESR options, and other services that make online shopping more convenient and profitable than offline shopping. Businesses are investing in technologies such as artificial intelligence, chatbots, machine learning, and augmented reality, among others, to improve the customer experience. During the forecast period, the increasing convenience of online shopping is anticipated to be a significant market growth driver. Infrastructures for Social Commerce Market leaders in social commerce platforms include Facebook, Twitter, and Pinterest.
Download Free Sample Report PDF @ https://straitsresearch.com/report/social-commerce-market/request-sample
Market Dynamics
The rise of Social Media and E-Commerce and Social Networking Sites Encouraging Businesses to Grow Drives the Global Market
Many businesses are using social commerce to reach out to existing and prospective new customers. This trend is influenced by several factors, including the fact that individuals are spending more time on social media platforms; according to studies, the average person spends over two hours per day on social media platforms. In addition, these platforms serve as effective marketing tools, contributing to the steady growth of online shopping via social media platforms because they allow customers to make purchases more interactively than traditional e-commerce platforms. In the preceding decade, social media networks have attracted extraordinary attention and experienced exponential growth in user base. Access to social networking sites such as Facebook, Twitter, Instagram, LinkedIn, and YouTube is currently effortless. The exponential growth of these and other social networking sites’ user bases encourages companies to connect with customers through these platforms.
Moreover, the convergence of content sharing, shopping, payment, and messaging features has facilitated the growth of social commerce in recent years. Social commerce, defined as using a social media platform to drive and process e-commerce transactions, has spawned new shopping methods in tandem with online environments. Consequently, the increasing adoption of e-commerce and social media platforms for shopping and information exchange is anticipated to drive market expansion over the next few years.
Exposure to Big Data Analytics and Artificial IntelligenceMarket Creates Tremendous Opportunities
Over the past few years, the evolution and rapid adoption of big data and artificial intelligence (AI). Companies engaged in social commerce are aggressively adopting AI and big data technologies to optimize their service offerings. Big data, a vast collection of online and offline data, has evolved into a valuable resource for analyzing past trends and gaining valuable insights into customer behavior, thereby facilitating higher levels of customer satisfaction. By integrating big data into social commerce, businesses can gain access to data that can be used to increase revenue, acquire new customers, and streamline operations. AI enables e-commerce businesses to improve the customer experience, optimize brand competitiveness, and foster brand loyalty. It provides buyers with accurate product recommendations and enhanced search results, enabling them to find what they desire with the fewest clicks possible. The increased adoption of AI in social commerce has enabled businesses to meet rising customer demands precisely and effectively.
AI and big data are the next major transformative technologies that will influence how businesses interact with data and business processes. The technologies facilitate the development of digital data models and data collection. Utilizing data from multiple sources as a knowledge repository results in an accurate forecast of customer needs. Numerous advantages of these technologies for the social commerce industry compel businesses to leverage big data- and AI-based applications to enhance customer experience and convert dissatisfied customers into loyal customers. In addition to AI and big data analytics, cloud computing and the Internet of Things (IoT) are promising technologies that are anticipated to assist businesses shortly in enhancing their customer relationships and customer satisfaction.
Regional Analysis
Asia-Pacific held a market share of 69.5% and is anticipated to grow steadily over the forecast period. Rising investments in the telecommunication infrastructure, the proliferation of the internet and smartphones, and the widespread use of social media websites such as Facebook, Instagram, and Twitter are primarily responsible for the expansion of this region. In addition, the increasing number of smartphone and social media users in countries such as China largely favors regional market expansion.
North America has emerged as the second-largest market and is anticipated to grow incredibly during the forecast period. Compared to developing countries, the U.S. e-commerce and social commerce landscapes are significantly more fragmented, with different consumer attitudes and behaviors toward social media consumption, digital shopping, payments, and online privacy. According to GWI, 51 percent of U.K. and U.S. consumers will use YouTube to find products and conduct additional research before making a purchase.
To Gather Additional Insights on the Regional Analysis of the Social Commerce Market
@ https://straitsresearch.com/report/social-commerce-market/request-sample
Competitive Players
The global cryogenic pump market’s major players are –Etsy, Inc.; Fashnear Technologies Private Limited (Meesho); Meta Platforms, Inc. (Facebook); Pinduoduo Inc.; Pinterest, Inc.; Poshmark; Roposo; Snap, Inc.; Taobao; TikTok (Douyin); Trell Shop; Twitter, Inc.; WeChat (Weixin); Xiaohongshu; Yunji Sharing Technology Co., Ltd
Market Players
- May 2022– Twitter to pay USD 150 million penalties over protecting the privacy of users’ data.
- May 2022– Meta announces new privacy policies for Facebook, Instagram, and Messenger
- May 2022– The company, then known as Facebook, began its latest eCommerce push when it launched Facebook and Instagram Shops
Global Social Commerce Market: Segmentation
By Business Model
- Business to Consumer
- Business to Business
- Consumer to Consumer
By Product Type
- Personal and Beauty Care
- Apparel
- Accessories
- Home Products
- Health Supplements
- Food and Beverages
By Regions
- North America
- Europe
- Asia-Pacific
- Latin America
- The Middle East and Africa
Get Detailed Market Segmentation @ https://straitsresearch.com/report/social-commerce-market/segmentation
About Straits Research Pvt. Ltd.
Straits Research is a market intelligence company providing global business information reports and services. Our exclusive blend of quantitative forecasting and trends analysis provides forward-looking insight for thousands of decision-makers. Straits Research Pvt. Ltd. provides actionable market research data, especially designed and presented for decision making and ROI.
Whether you are looking at business sectors in the next town or crosswise over continents, we understand the significance of being acquainted with the client’s purchase. We overcome our clients’ issues by recognizing and deciphering the target group and generating leads with utmost precision. We seek to collaborate with our clients to deliver a broad spectrum of results through a blend of market and business research approaches.
Phone: +1 646 905 0080 (U.S.)
+44 203 695 0070 (U.K.)
Email: sales@straitsresearch.com
Follow Us: LinkedIn | Facebook | Instagram | Twitter

© 2024 Benzinga.com. Benzinga does not provide investment advice. All rights reserved.
Human Papillomavirus Vaccine Market Size on Track to Surpass USD 9.1 Billion by 2031 at a 9.4% CAGR, Aiding Global Cancer Prevention| Transparency Market Research, Inc.
Wilmington, Delaware, United States, Transparency Market Research Inc. , Nov. 07, 2024 (GLOBE NEWSWIRE) — The global human papillomavirus vaccine market (سوق لقاحات فيروس الورم الحليمي البشري) was projected to attain US$ 4 billion in 2022. It is anticipated to garner a 9.4% CAGR from 2023 to 2031 and by 2031, the market is likely to attain US$ 9.1 billion by 2031.
Human papillomavirus (HPV) is a widespread virus that affects many different regions of the body. Over two hundred viruses make up the HPV category, of which over forty types are transmitted during intercourse. Sexually transmitted infections (STIs) such as HPV that affect the genitalia are often spread through physical contact.
Request Sample PDF Report: Empower Your Industry Understanding with Invaluable Insights-https://www.transparencymarketresearch.com/sample/sample.php?flag=S&rep_id=37085
Throughout the forecast period, a rise in government efforts is anticipated to support the size of the global market for human papillomavirus vaccines. The creation of new compounds that target HPV presents market participants with profitable potential. To get a larger market share, manufacturers are heavily investing in the creation of novel HPV vaccinations for all age groups.

Global Human Papillomavirus Vaccine Market: Key Players
The primary objective of major companies is to enhance the efficiency of the adult human papillomavirus vaccination by investing in research and development and launching new products.
These firms are pursuing profitable revenue prospects by staying up to date with the newest developments in the human papillomavirus vaccine industry. The following companies are well-known participants in the global human papillomavirus vaccine market:
- Merck & Co. Inc.
- GlaxoSmithKline plc
- Sanofi
- AstraZeneca
- Serum Institute of India Pvt. Ltd.
- Xiame Innovax Biotech CO. LTD.
- General Incorporated Foundation
- Chemo-Sero-Therapeutic Research Institute (Kaketsuken)
- Bharat Biotech
Key Findings of the Market Report
- To stop the spread of the human papillomavirus, governments everywhere are launching a number of campaigns and efforts for the creation and distribution of HPV vaccinations.
- Global distribution of HPV vaccinations as well as screening and immunization programs are funded by both private and public entities.
- According to a January 2023 Vaccines Journal article, Switzerland completely funds the HPV vaccination for girls between the ages of 15 and 26 and for boys between the ages of 11 and 14.
Market Trends for Human Papillomavirus Vaccine Market
- The most prevalent sexually transmitted infection (STI) globally is HPV. It is believed that 80% of those who engage in sexual activity have had HPV infection at some point in their life. Over the course of the projection period, an increase in the incidence of HPV-related illnesses such as vaginal, anal, and cervical cancer is anticipated to support demand for the human papillomavirus vaccines globally.
- Cervical cancer is the second most common disease among Indian women, and the second most common among women aged 15 to 44, according to the HPV and Related Cancers report 2023. According to the same source, India diagnoses 123,907 women with cervical cancer annually.
Global Market for Human Papillomavirus Vaccine: Regional Outlook
Various reasons are propelling the growth of human papillomavirus vaccine throughout the region. These are:
- In terms of global market share for human papillomavirus vaccines in 2022, North America held the majority of the share. This is attributed to the population’s increased incidence of cervical cancer and other HPV-related malignancies as well as the enhanced healthcare infrastructure.
- In the United States, 9,440 new cases of anal cancer were discovered in 2022, according to research released by the American Cancer Society. Furthermore, 1,450 Canadian women had a cervical cancer diagnosis in 2022, according to the Canadian Cancer Society.
- An article in the Human Vaccine and Immunotherapeutic Journal from February 2023 states that HPV vaccinations in the United States can begin as early as age nine and continue until age 26.
- Approximately 77% of teens, aged 13 to 17 have gotten one or more doses of the HPV vaccination, with roughly 62% completing the whole series. The human papillomavirus vaccine market is anticipated to develop significantly in the area due to significant coverage for the HPV vaccination and early screening programs.
Unlock Growth Potential in Your Industry! Download PDF Brochure @ https://www.transparencymarketresearch.com/sample/sample.php?flag=S&rep_id=37085
Some key developments by the players in this market are:
- To begin a cervical cancer screening program in India, Roche Diagnostics India and the Cancer Awareness Prevention and Early Detection Trust (CAPED) signed a Memorandum of Understanding (MoU) in March 2023.
- Health Canada approved the expanded use of GARDASIL 9 (Human Papillomavirus 9-valent Vaccine, Recombinant) in April 2022 for people 9 to 45 years old in order to protect against infection with Human Papillomavirus (HPV) types 6, 11, 16, 18, 31, 33, 45, 52, and 58. Merck Canada received this approval.
Global Human Papillomavirus Vaccine Market Segmentation
Valence
- Bivalent
- Quadrivalent and Nonavalent
Indication
- Cervical Cancer
- Anal Cancer
- Vaginal Cancer
- Penile Cancer
- Vulvar Cancer
- Oropharyngeal Cancer
- Genital Warts
- Others
Distribution Channel
- Physicians
- Wholesalers
- Physician Distributors
- Government Entities
- Public and Private Alliances
Region
- North America
- Latin America
- Europe
- Asia Pacific
- Middle East & Africa
Elevate Your Business Strategy! Purchase the Report for Market-Driven Insights https://www.transparencymarketresearch.com/checkout.php?rep_id=37085<ype=S
More Trending Report by Transparency Market Research:
- Vaccines Market – The global vaccines market (سوق اللقاحات) was estimated at a value of US$ 119.1 billion in 2022. It is anticipated to register a 4.2% CAGR from 2022 to 2031 and by 2031, the market is likely to attain US$ 99.3 billion by 2031.
- Neurotoxin Market – The global neurotoxin market (سوق السموم العصبية) stood at US$ 7.78 billion in 2023 and is projected to reach US$ 13.3 billion in 2031. The global neurotoxin market is anticipated to expand at a CAGR of 6.8% between 2023 and 2031.
About Transparency Market Research
Transparency Market Research, a global market research company registered at Wilmington, Delaware, United States, provides custom research and consulting services. Our exclusive blend of quantitative forecasting and trends analysis provides forward-looking insights for thousands of decision makers. Our experienced team of Analysts, Researchers, and Consultants use proprietary data sources and various tools & techniques to gather and analyses information.
Our data repository is continuously updated and revised by a team of research experts, so that it always reflects the latest trends and information. With a broad research and analysis capability, Transparency Market Research employs rigorous primary and secondary research techniques in developing distinctive data sets and research material for business reports.
Contact:
Transparency Market Research Inc.
CORPORATE HEADQUARTER DOWNTOWN,
1000 N. West Street,
Suite 1200, Wilmington, Delaware 19801 USA
Tel: +1-518-618-1030
USA – Canada Toll Free: 866-552-3453
Website: https://www.transparencymarketresearch.com
Email: sales@transparencymarketresearch.com
Follow Us: LinkedIn| Twitter| Blog | YouTube

Market News and Data brought to you by Benzinga APIs
© 2024 Benzinga.com. Benzinga does not provide investment advice. All rights reserved.
Almost 90% of Metro Areas Posted Home Price Increases in Third Quarter of 2024
Key Highlights
- Single-family existing-home sales prices climbed in 87% of measured metro areas – 196 of 226 – in the third quarter, down from 89% in the prior quarter. The national median single-family existing-home price grew 3.1% from a year ago to $418,700.
- Fifteen markets (7%) experienced double-digit annual price appreciation (down from 13% in the previous quarter).
- The monthly mortgage payment on a typical, existing single-family home with a 20% down payment was $2,137 – down 2.4% from one year ago.
WASHINGTON (November 7, 2024) – Approximately 90% of metro markets (196 out of 226, or 87%) registered home price gains in the third quarter of 2024, as the 30-year fixed mortgage rate ranged from 6.08% to 6.95%, according to the National Association of Realtors®‘ latest quarterly report. Seven percent of the 226 tracked metro areas recorded double-digit price gains over the same period, down from 13% in the second quarter.
“Home prices remain on solid ground as reflected by the vast number of markets experiencing gains,” said NAR Chief Economist Lawrence Yun. “A typical homeowner accumulated $147,000 in housing wealth in the last five years. Even with the rapid price appreciation over the last few years, the likelihood of a market crash is minimal. Distressed property sales and the number of people defaulting on mortgage payments are both at historic lows.”
Compared to one year ago, the national median single-family existing-home price ascended 3.1% to $418,700. In the prior quarter, the year-over-year national median price increased 4.9%.
Among the major U.S. regions, the South registered the largest share of single-family existing-home sales (45.1%) in the third quarter, with year-over-year price appreciation of 0.8%. Prices also increased 7.8% in the Northeast, 4.3% in the Midwest and 1.8% in the West.[1]
The top 10 metro areas with the largest year-over-year median price increases, which can be influenced by the types of homes sold during the quarter, all experienced gains of at least 10.6%. Four of the markets were in Illinois. Overall, those markets were Racine, Wis. (13.7%); Youngstown-Warren-Boardman, Ohio-Pa. (13.1%); Syracuse, N.Y. (13.0%); Peoria, Ill. (12.4%); Springfield, Ill. (12.3%); Burlington-South Burlington, Vt. (11.7%); Shreveport-Bossier City, La. (11.5%); Rockford, Ill. (11.1%); Decatur, Ill. (10.9%); and Norwich-New London, Conn. (10.6%).
Eight of the top 10 most expensive markets in the U.S. were in California. Overall, those markets were San Jose-Sunnyvale-Santa Clara, Calif. ($1,900,000; 2.7%); Anaheim-Santa Ana-Irvine, Calif. ($1,398,500; 7.2%); San Francisco-Oakland-Hayward, Calif. ($1,309,000; 0.7%); Urban Honolulu, Hawaii ($1,138,000; 7.2%); San Diego-Carlsbad, Calif. ($1,010,000; 3.2%); Salinas, Calif. ($959,800; 1.5%); San Luis Obispo-Paso Robles, Calif. ($949,800; 6.7%); Los Angeles-Long Beach-Glendale, Calif. ($947,500; 5.6%); Oxnard-Thousand Oaks-Ventura, Calif. ($947,400; 2.8%); and Boulder, Colo. ($832,200; -3.0%).
Nearly 13% of markets (29 of 226) experienced home price declines in the third quarter, up from almost 10% in the second quarter.
Housing affordability slightly improved in the third quarter as mortgage rates trended lower. The monthly mortgage payment on a typical existing single-family home with a 20% down payment was $2,137, down 5.5% from the second quarter ($2,262) and 2.4% – or $52 – from one year ago. Families typically spent 25.2% of their income on mortgage payments, down from 26.9% in the prior quarter and 27.1% one year ago.
“Housing affordability has been a challenge, but the worst appears to be over,” Yun said. “Rising wages are outpacing home price increases. Despite some short-term swings, mortgage rates are set to stabilize below last year’s levels. More inventory is reaching the market and providing additional options for consumers.”
First-time buyers found marginally better affordability conditions compared to the previous quarter. For a typical starter home valued at $355,900 with a 10% down payment loan, the monthly mortgage payment declined to $2,097, down 5.5% from the prior quarter ($2,218). That was a decrease of $49, or 2.3%, from one year ago ($2,146). First-time buyers typically spent 38% of their family income on mortgage payments, down from 40.6% in the previous quarter.
A family needed a qualifying income of at least $100,000 to afford a 10% down payment mortgage in 42.5% of markets, down from 48% in the prior quarter. Yet, a family needed a qualifying income of less than $50,000 to afford a home in 2.2% of markets, down from 2.7% in the previous quarter.
About the National Association of Realtors®
The National Association of Realtors® is America’s largest trade association, representing 1.5 million members involved in all aspects of the residential and commercial real estate industries. The term Realtor® is a registered collective membership mark that identifies a real estate professional who is a member of the National Association of Realtors® and subscribes to its strict Code of Ethics. For free consumer guides about navigating the homebuying and selling transaction processes – from written buyer agreements to negotiating compensation – visit facts.realtor.
# # #
Information about NAR is available at nar.realtor. This and other news releases are posted in the newsroom at nar.realtor/newsroom. Statistical data in this release, as well as other tables and surveys, are posted in the “Research and Statistics” tab.
Data tables for MSA home prices (single-family and condo) are posted at https://www.nar.realtor/research-and-statistics/housing-statistics/metropolitan-median-area-prices-and-affordability. If insufficient data is reported for an MSA in a particular quarter, it is listed as N/A. For areas not covered in the tables, please contact the local association of Realtors®.
NOTE: NAR releases quarterly median single-family price data for approximately 220 Metropolitan Statistical Areas (MSAs). In some cases, the MSA prices may not coincide with data released by state and local Realtor® associations. Any discrepancy may be due to differences in geographic coverage, product mix, and timing. In the event of discrepancies, Realtors® are advised that for business purposes, local data from their association may be more relevant.
[1] Areas are generally metropolitan statistical areas as defined by the U.S. Office of Management and Budget. NAR adheres to the OMB definitions, although in some areas an exact match is not possible from the available data. A list of counties included in MSA definitions is available at: https://www.census.gov/geographies/reference-files/time-series/demo/metro-micro/delineation-files.html.
Regional median home prices are from a separate sampling that includes rural areas and portions of some smaller metros that are not included in this report; the regional percentage changes do not necessarily parallel changes in the larger metro areas. The only valid comparisons for median prices are with the same period a year earlier due to seasonality in buying patterns. Quarter-to-quarter comparisons do not compensate for seasonal changes, especially for the timing of family buying patterns.
Median price measurement reflects the types of homes that are selling during the quarter and can be skewed at times by changes in the sales mix. For example, changes in the level of distressed sales, which are heavily discounted, can vary notably in given markets and may affect percentage comparisons. Annual price measures generally smooth out any quarterly swings.
NAR began tracking of metropolitan area median single-family home prices in 1979; the metro area condo price series dates back to 1989.
The seasonally adjusted annual rate for a particular quarter represents what the total number of actual sales for a year would be if the relative sales pace for that quarter was maintained for four consecutive quarters. Total home sales include single-family, townhomes, condominiums and co-operative housing.

Troy Green
National Association of Realtors®
tgreen@nar.realtor
© 2024 Benzinga.com. Benzinga does not provide investment advice. All rights reserved.
Rotogravure Printing Machine Market Size Expected to Hit USD 2.8 Billion by 2031, Expanding at a 3.5% CAGR: Transparency Market Research, Inc.
Wilmington, Delaware, United States, Transparency Market Research Inc. , Nov. 07, 2024 (GLOBE NEWSWIRE) — The global rotogravure printing machine market was projected to attain US$ 2 billion in 2022. It is anticipated to garner a 3.5% CAGR from 2023 to 2031 and by 2031, the market is likely to attain US$ 2.8 billion by 2031.
Newspapers, periodicals, and flex printing may be printed in large quantities using a gravure printing press. To guarantee excellent prints, the rotogravure printing method uses sophisticated cylinder engraving.
The packaging industry uses high-volume printing machines to boost output while preserving print quality in line with brand specifications. Businesses are able to print their desired logos, brand pictures, and other content on packaging materials with an industrial rotogravure press that is customized.
Request for a Sample PDF of this Research Report: https://www.transparencymarketresearch.com/sample/sample.php?flag=S&rep_id=36734

Global Rotogravure Printing Machine Market: Key Players
With modern technology, businesses operating in the global environment are making significant investments in product innovation. To expedite the packaging of products, businesses in the packaging industry are using automated printing equipment.
To increase their worldwide presence, they are entering into commercial contracts with well-known companies in the rotogravure printing machine industry. The following companies are well-known participants in the global rotogravure printing machine market:
- Bobst Group SA.
- Windmoeller & Hoelscher Corporation
- Comexi Group S.L.
- DCM-ATN
- KKA GmbH
- ROTATEK S.A.
- Uteco Converting SpA
- Shaanxi Beiren Printing Machinery Co., Ltd.
- Pelican Rotoflex Pvt Ltd.
- Fuji Kikai Kogyo Co Ltd
- Officine Meccaniche Giovanni Cerutti SpA
Key Findings of the Market Report
- In the food and beverage sectors, there is an increasing need for visually appealing and reasonably priced packaging.
- The cost of printing on substrates with rotogravure printing is cheap per unit.
- Businesses in the food and beverage industry favor it.
- With the use of precise rotogravure printing technology, businesses may efficiently communicate product specifications to their clientele through labels and tags.
- The market statistics for rotogravure printing machines are supported by the rise in demand for gravure printing in the e-commerce industry.
- High accuracy and print quality bulk printing is made possible by rotogravure printing machines.
Market Trends for Rotogravure Printing Machines
- Flexible packaging is utilized in a variety of end-use sectors, such as food and beverage, pharmaceuticals, cosmetics and personal care, industrial, and consumer products. Since rotogravure printing uses high-quality ink, it is often utilized in commercial packaging.
- The rotogravure printing machine market is growing because of the increase in demand for flexible packaging solutions in many sectors due to its efficient, long-lasting, and high-quality packaging.
- The packaging industry is seeing a rise in expenditures in technical improvements, which is changing the dynamics of the market. Leading manufacturers use high-speed rotogravure printing machines for flexible packaging in order to boost production through automated printing processes. These devices can print excellent designs on a variety of surfaces, including paper, metal, glass, and plastic.
Global Market for Rotogravure Printing Machine: Regional Outlook
Various reasons are propelling the growth of rotogravure printing machines throughout the region. These are:
- In 2022, Europe constituted the largest portion of the world’s landmass. From 2023 to 2031, the industry in the region is expected to grow at a CAGR of 2.1%.
- Over the next few years, Europe’s market share for rotogravure printing machines is expected to grow due to the continent’s high volume of magazine production and growing need for bulk printing solutions. Market expansion in the region is also being aided by the packaging industry’s rapid rise.
- The population’s growing consumption of packaged food is also fueling the need for rotogravure printing equipment in Europe’s food and beverage industry.
- Ultra-Processed Foods (UFDs) account for 12.0% of the average adult daily food intake amount in Europe, according to the National Institutes of Health, where adult consumption of UFDs is 328 g/day.
Unlock Growth Potential in Your Industry! Download PDF Brochure: https://www.transparencymarketresearch.com/sample/sample.php?flag=S&rep_id=36734
Key developments by the players in this market are:
- The multinational manufacturer of flexible packaging Takigawa Corporation expanded their operations in Bardstown, Kentucky, in October 2022 by adding a second HELIOSTAR gravure press from Windmoeller & Hoelscher Corporation. The 10-color HELIOSTAR gravure press allows for excellent mass printing on various materials.
- Berkshire Labels, a well-known producer of creative and superior self-adhesive labels, sticker sheets, and shrink sleeves in the United Kingdom, inked a deal with BOBST Group in October 2022 to acquire the BOBST DIGITAL MASTER 340 label press, an entirely automated and digitalized production line.
Global Rotogravure Printing Machine Market Segmentation
Ink Type
Substrate
- Plastic
- Aluminum Foil
- Paper & Paperboard
Drying Source
- Electrical
- Thermal Fluid
- Gas
Automation Type
- Automatic Rotogravure Machine
- Manual Rotogravure Machine
End Use
- Newspaper
- Security Printing
- Food & Beverages
- Pharmaceuticals
- Consumer Goods
- Industrial
- Others
Region
- North America
- Latin America
- Europe
- Asia Pacific
- Middle East & Africa
Get an Exclusive Discount Now to Access Industry Forecasts: https://www.transparencymarketresearch.com/checkout.php?rep_id=36734<ype=S
Explore Trending Reports of Packaging:
- Aerosol Cans Market – The global aerosol cans market stood at US$ 3.0 billion in 2022 and is projected to reach US$ 4.9 billion in 2031. The global aerosol cans market is anticipated to expand at a CAGR of 5.5% between 2023 and 2031.
- Flexible Packaging Market – The global flexible packaging market is projected to flourish at a CAGR of 4.9% from 2023 to 2031.
About Transparency Market Research
Transparency Market Research, a global market research company registered at Wilmington, Delaware, United States, provides custom research and consulting services. Our exclusive blend of quantitative forecasting and trends analysis provides forward-looking insights for thousands of decision makers. Our experienced team of Analysts, Researchers, and Consultants use proprietary data sources and various tools & techniques to gather and analyses information.
Our data repository is continuously updated and revised by a team of research experts, so that it always reflects the latest trends and information. With a broad research and analysis capability, Transparency Market Research employs rigorous primary and secondary research techniques in developing distinctive data sets and research material for business reports.
Contact:
Transparency Market Research Inc.
CORPORATE HEADQUARTER DOWNTOWN,
1000 N. West Street,
Suite 1200, Wilmington, Delaware 19801 USA
Tel: +1-518-618-1030
USA – Canada Toll Free: 866-552-3453
Website: https://www.transparencymarketresearch.com
Email: sales@transparencymarketresearch.com
Follow Us: LinkedIn| Twitter| Blog | YouTube

Market News and Data brought to you by Benzinga APIs
© 2024 Benzinga.com. Benzinga does not provide investment advice. All rights reserved.
Why Trump's Boost To Treasury Yields, Inflation Expectations May Weaken Fed's Efforts To Cut Interest Rates
Rising U.S. Treasury yields and a strengthening in the value of the dollar in the wake of Donald Trump’s return to the White House are threatening to counteract the Federal Reserve’s efforts to lower interest rates.
The Federal Reserve is expected to cut its benchmark interest rate by 25 basis points on Thursday, marking a back-to-back reduction and bringing the policy rate to a range of 4.5%-4.75%, the lowest since February 2023.
The bond market appears less influenced by the Fed’s dovish stance and more by the fiscal and inflationary implications of Trump’s victory in the 2024 presidential election.
Trump’s Fiscal Plans Drive Deficit Concerns
Trump’s proposed fiscal policies are expected to add significantly to the U.S. national debt.
According to the nonprofit Committee for a Responsible Federal Budget (CRFB), Trump’s tax and spending plans could increase the federal deficit by approximately $7.75 trillion between 2026 and 2035 in a baseline scenario.
This would push the debt-to-GDP ratio from 102% to a staggering 143%, or 18% higher than current law projections.
In a high-deficit scenario, the CRFB estimates that deficits could swell by $15.55 trillion, elevating the debt-to-GDP ratio to 157%.
Such a sharp rise in the national debt would necessitate a sharp increase in Treasury issuance by the government in the upcoming years, putting upward pressure on yields as investors demand higher returns to offset heightened risks of fiscal instability.
On top of that, Trump’s pledge to raise import tariffs — by 60% on goods from China and 10% on imports from other countries — is widely viewed by economists as an inflationary move.
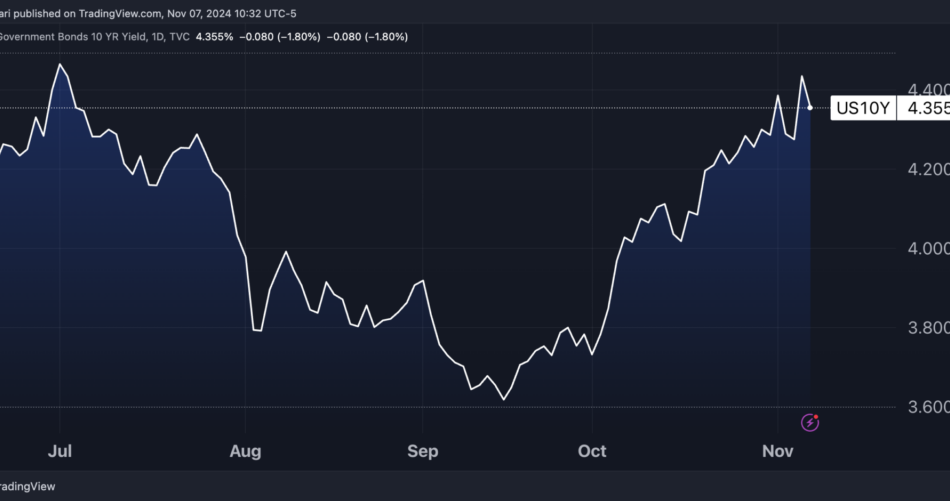
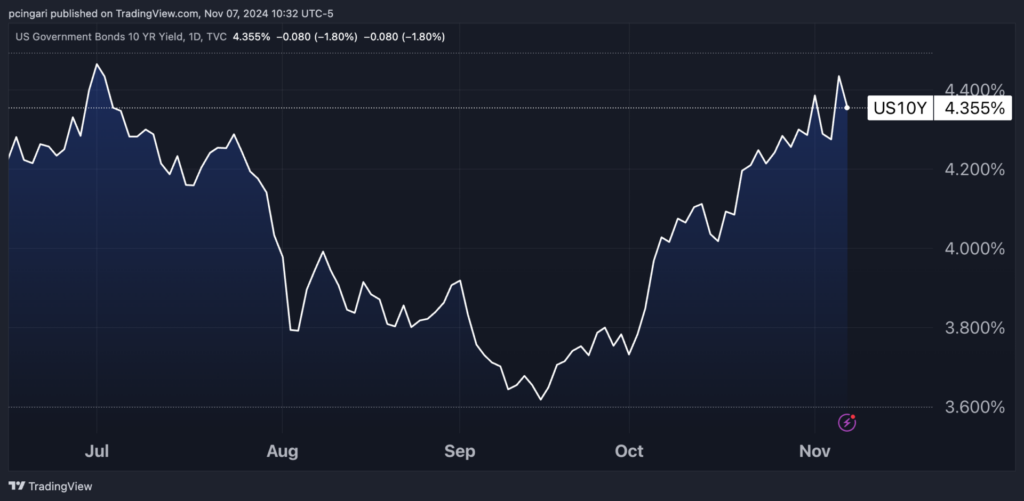
Treasury yields have surged sharply in under two months, with the 10-year yield climbing from 3.6% to 4.35%. As a result, the U.S. 10 Year Treasury Note ETF UTEN has fallen by over 5% since its September highs.
Chart: 10-Year Treasury Yields Spike, Anticipate Worsening Debt Path After 2024 Elections
Rising Yields Complicate Fed’s Easing Path
In the meantime, the Fed cut interest rates by 50 basis points in September and guided investors toward a further cut in November, a stance that would typically lower borrowing costs and ease financial conditions.
The bond market’s reaction has been the opposite, creating tighter financial conditions that investors wouldn’t normally expect under a Fed easing bias.
In addition to rising yields, the U.S. dollar has also strengthened significantly.
“Bond yields are rising for a good reason, as the economy is holding up stronger than expected and markets are also pricing in continued government spending and the potential for widening deficits,” said Glen Smith, chief investment officer at GDS Wealth Management.
The recent spike in yields is undermining the Fed’s attempts to ease financial conditions, the CIO said.
“Rising bond yields are reversing the Fed’s efforts to loosen policy, as bond yields determine the interest rates that consumers pay on mortgages and credit cards,” he said.
Smith suggested Thursday’s expected rate cut could be the last for a while, as the Fed might pause its rate cuts in December and into 2025 if the economy remains resilient and disinflation slows.
Inflation Expectations Spike With Trump Win
Trump’s return to the White House has heightened inflationary concerns.
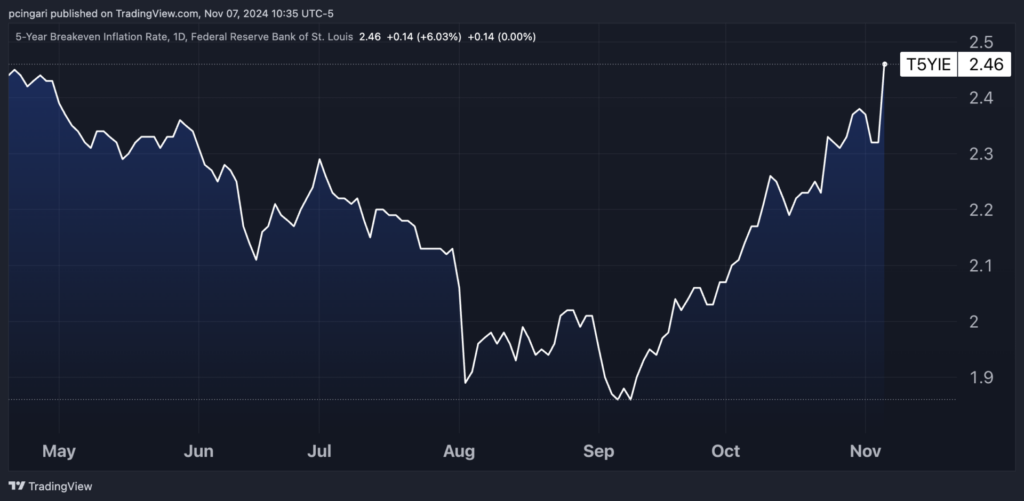
The five-year breakeven inflation rate, a widely watched gauge of inflation expectations derived from Treasury yields, rose by 14 basis points to 2.46% on Wednesday.
This shift indicates that investors are now anticipating inflation to average 2.5% over the next five years, well above the Fed’s 2% target.
Russell Shor, senior market specialist at Jefferies-owned trading platform Tradu, warned that Trump’s policies could push inflation even higher.
“With Trump’s return to the White House, the Fed may feel pressure to tighten its stance on inflation. His tariff and immigration plans could drive up prices, and the central bank will be watching closely for any inflation resurgence,” Shor said.
Chart: 5-Year Breakeven Inflation Rate Spikes To Nearly 2.5% After Trump’s Election Victory
Read Next:
Image created using Shutterstock and Fed photos with a background created using artificial intelligence via MidJourney.
© 2024 Benzinga.com. Benzinga does not provide investment advice. All rights reserved.


