Gold: The Rise And Fall
Gold, an ancient asset with millennia-long human fascination, demonstrates substantial price fluctuations and distinct growth and correction cycles. A thorough technical analysis of gold’s price history reveals crucial support and resistance levels, forming the backbone of its trend patterns. From its lows in 1999 to its fresh highs in 2024, gold’s price journey offers investors insights into its cyclical nature and potential future moves.

The Foundations of a Bullish Path: 1999 to 2011
In August 1999, gold found major support at $252 per ounce, marking a significant low and becoming a pivotal springboard for future growth. By July 2005, a new fractal support developed at $417, strengthening the asset’s uptrend and paving the way for a sustained rally. In 2008, gold tested the symbolic $1,000 mark — a key psychological barrier in its ascent, which was soon surpassed as gold soared to a peak of $1,921 in September 2011. This milestone represented an impressive 166% gain from the lows of 1999, underscoring a robust bullish trend that attracted increasing investor interest.
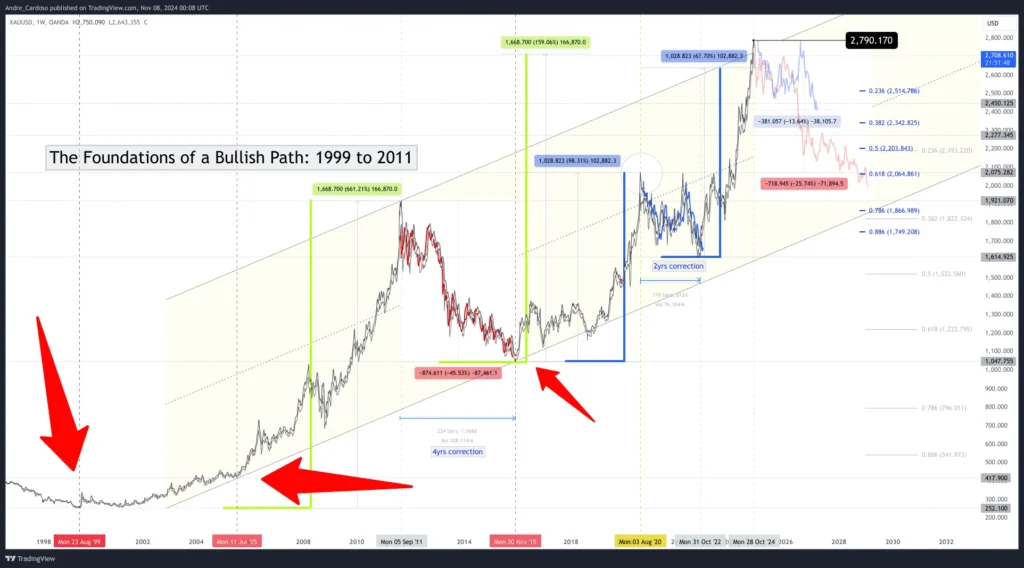
However, gold’s upward trajectory experienced interruptions. After reaching its peak in 2011, the metal entered a correction phase lasting four years, finding new support at $1,047 in November 2015. This established a fresh fractal level, indicating the potential for a new upward channel encompassing the key lows of 1999 and 2005, the highs of 2011, and the support found in 2015.
A Fresh Uptrend: 2015 to 2020
Following the November 2015 lows, gold resumed its upward movement, surpassing previous highs to reach a new peak of $2,075 per ounce in August 2020. This marked a 98% appreciation from the 2015 lows and reinforced gold’s reputation as a safe-haven asset, particularly during times of global uncertainty. However, the 2020 price rally was followed by a two-year consolidation phase.
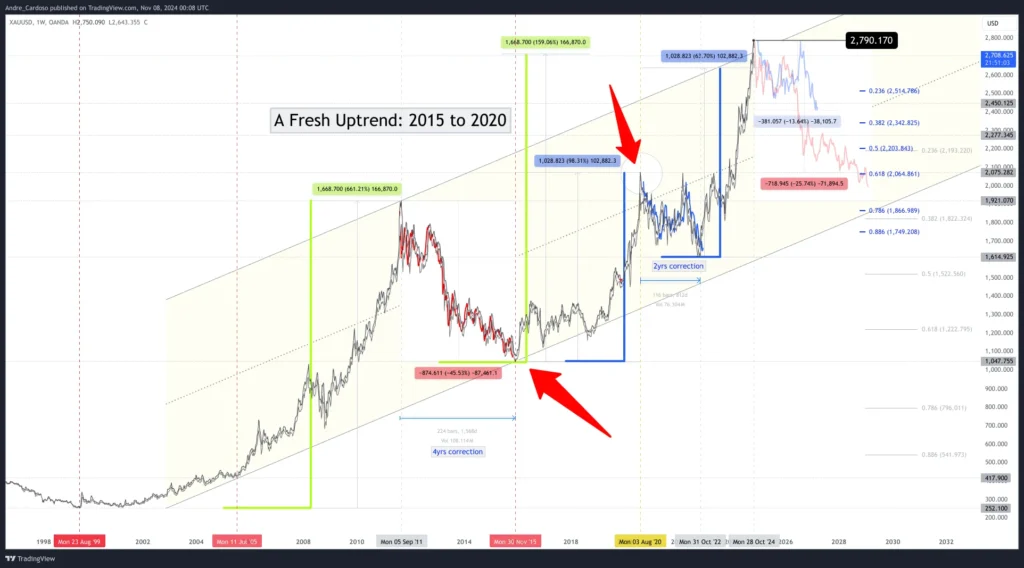
By October 2022, support had been established at $1,614, with trading range stabilizing between this support level and the previous high of $2,075. This range laid a structural foundation for future price fluctuations, setting the stage for a potential breakout amid emerging economic factors and geopolitical tensions.
2024 and Beyond: The Breakout to New Highs
In February 2024, gold broke through previous resistance levels, surpassing the $2,075 mark and sparking renewed optimism among traders and investors. This breakout established a new fractal resistance level on October 28, 2024, with gold reaching $2,790. This significant price movement highlights gold’s long-term ascending parallel channel, a structure formed over decades, encompassing key points such as the lows of 1999 and 2015, the highs of 2011, and the recent highs of 2024.
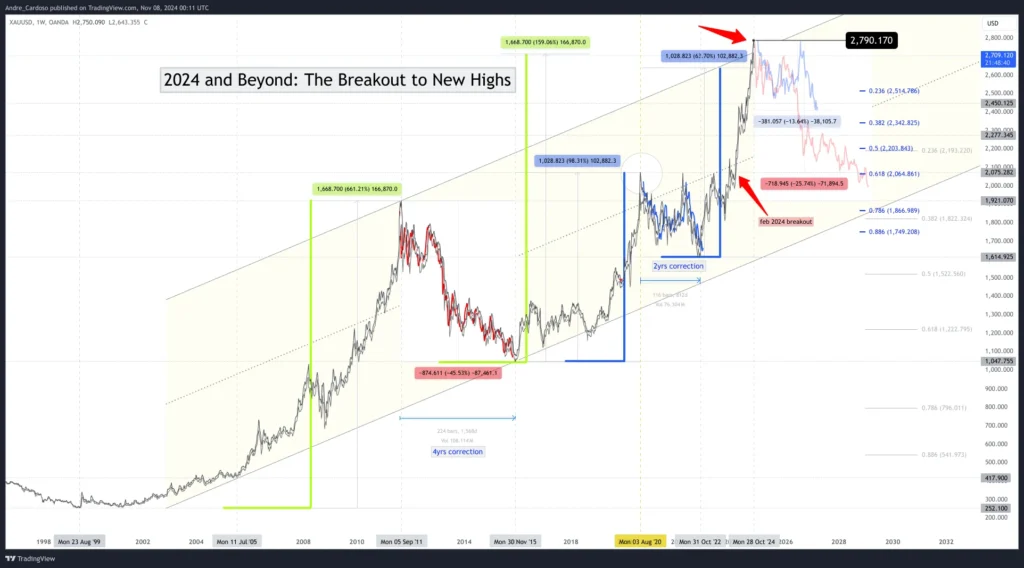
Currently, gold appears to be approaching the upper boundary of this channel, suggesting potential resistance. Should this resistance hold, it could signal an imminent correction. Nonetheless, given the asset’s resilience over the past two decades, any correction may present buying opportunities for long-term investors.
Symmetry and Structural Patterns: Insights for Future Movement
An intriguing aspect of gold’s current price structure is its symmetry with previous bullish phases. The price movement from the 1999 lows to the 2011 highs mirrors, in many ways, the journey from the 2015 lows to the recent highs of 2024. Similarly, the rally from November 2015 to the August 2020 peak shows parallels to the movement from October 2022 to October 2024. This structural symmetry suggests overlapping AB=CD patterns at various scales, potentially indicating a corrective phase if resistance proves formidable.
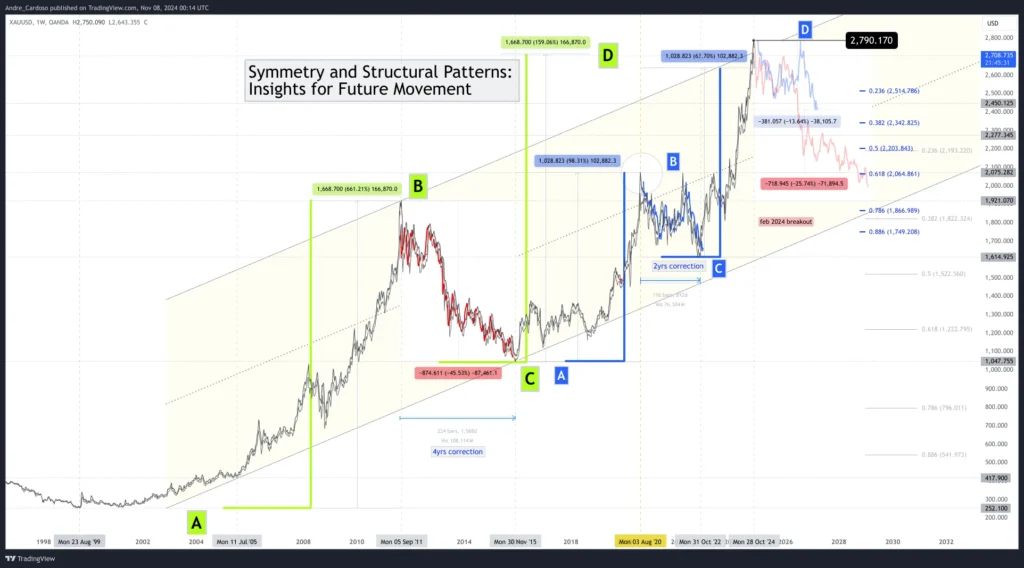
Considering these patterns and the potential resistance from the upper boundary of the ascending channel, a technical argument can be made for a temporary pullback. Such a correction might see gold revisiting previous resistance levels, potentially around $2,075, as part of a broader consolidation phase. This period of recalibration could set the stage for another rally, contingent upon evolving global economic conditions and investor sentiment.
Concluding Thoughts
Gold’s price evolution from 1999 to 2024 exemplifies its robustness as a store of value and the recurring technical patterns governing its price action. With well-defined support and resistance levels, a clear ascending channel, and identifiable symmetrical patterns, gold stands at a critical juncture. For investors, understanding these technical markers is crucial, as the asset’s long-term trajectory often mirrors broader market sentiments influenced by economic cycles and geopolitical events.
Happy Trading,
André Cardoso at Forex Analytix
© 2024 Benzinga.com. Benzinga does not provide investment advice. All rights reserved.


Leave a Reply