Innocan Pharma Reports Third Quarter 2024 Financial Results
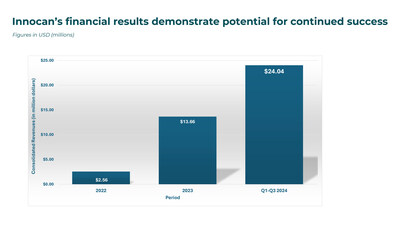
2.7X Revenue Growth Year-Over-Year at US $24 Million for 9-month Period
HERZLIYA, Israel and CALGARY, Alberta, Nov. 20, 2024 /CNW/ — Innocan Pharma Corporation INNO IP INNPF (the “Company” or “Innocan”), a pharmaceutical technology company focusing on developing innovative drug delivery platform technologies, is pleased to announce its consolidated financial results for the three and nine-month periods ended September 30, 2024.
Financial Highlights
- Revenue Growth: 9-month revenues up 174% year over year (YoY) to US $24.0 million and 3-month revenues up 111% YoY to US $8.6 million, driven by strong sales growth of Innocan’s subsidiary, BI Sky Global Ltd.
- Gross Profit in the 9-month year-to-date period increased 183% to US$21.8 million, compared to US$7.7 million in the nine-month period of 2023; Third quarter gross profit increased 112% to US$7.8 million, compared to US$3.7 million in the third quarter of 2023.
- Operating Profit increased to US$0.4 million, an increase of US$1.6 million compared to an operating loss of US$1.2 million in the third quarter of 2023.
- Net Profit increased to US$0.3 million, an increase of US$2.1 million compared to a net loss of US$1.8 million in the third quarter of 2023.
Management Comments
Iris Bincovich, the CEO of Innocan commented: “As our results for both the third quarter and nine-month period have demonstrated, Innocan is bringing strong value for shareholders through our dual focus on our pharma and wellness activities. Chronic pain, which affects over a quarter of the U.S. population, remains one of the most pressing issues in outpatient care today*. Our commitment and solution for chronic pain management is backed by rigorous pharmaceutical innovation and science. With our LPT-CBT injection targeting pain relief, we are bringing a unique, non-opioid chronic pain management solution for both animals and humans, utilizing our proprietary drug delivery mechanism.”
Roni Kamhi, CEO of BI Sky Global, subsidiary of Innocan, and COO of Innocan Pharma, commented, “Our strong operational and financial momentum continued throughout 2024 and now in the third quarter, we again demonstrated solid financial results. We are pleased to report nine consecutive quarters of continuous revenue growth. Our online platform continues to perform exceptionally well, contributing to our strong nine-month revenue growth of 174% YoY to US$24.0 million and a gross profit increase of 183% to US$21.8 million. This success reflects our successful introduction of new products and increased brand awareness”.
Innocan’s unaudited consolidated financial statements and related management’s discussion and analysis for the three month period ended September 30, 2024, can be found on the Company’s profile at www.sedarplus.ca.
About Innocan
Innocan is an innovator in the pharmaceuticals and wellness sectors. In the pharmaceuticals sector, Innocan developed a CBD-loaded liposome drug delivery platform with exact dosing, prolonged and controlled release of synthetic CBD for non-opioid pain management. In the wellness sector, Innocan develops and markets a wide portfolio of high-performance self-care and beauty products to promote a healthier lifestyle. Under this segment Innocan carries on business through its 60% owned subsidiary, BI Sky Global Ltd. which focuses on advanced, targeted online sales.
For further information, please contact:
Iris Bincovich, CEO
+1-516-210-4025
+972-54-3012842
+44 203 769 9377
info@innocanpharma.com
*Chronic Pain – StatPearls – NCBI Bookshelf
NEITHER THE CANADIAN SECURITIES EXCHANGE NOR ITS REGULATION SERVICES PROVIDER HAVE REVIEWED OR ACCEPT RESPONSIBILITY FOR THE ADEQUACY OR ACCURACY OF THIS RELEASE.
Cautionary note regarding forward-looking information
Certain information set forth in this news release, including, without limitation, information regarding research and development, collaborations, the filing of potential applications with the FDA and other regulatory authorities, the potential achievement of future regulatory milestones, the potential for treatment of conditions and other therapeutic effects resulting from research activities and/or the Company’s products, requisite regulatory approvals and the timing for market entry, is forward-looking information within the meaning of applicable securities laws. By its nature, forward-looking information is subject to numerous risks and uncertainties, some of which are beyond Innocan’s control. The forward-looking information contained in this news release is based on certain key expectations and assumptions made by Innocan, including expectations and assumptions concerning the anticipated benefits of the products, satisfaction of regulatory requirements in various jurisdictions and satisfactory completion of requisite production and distribution arrangements.
Forward-looking information is subject to various risks and uncertainties which could cause actual results and experience to differ materially from the anticipated results or expectations expressed in this news release. The key risks and uncertainties include but are not limited to: general global and local (national) economic, market and business conditions; governmental and regulatory requirements and actions by governmental authorities; and relationships with suppliers, manufacturers, customers, business partners and competitors. There are also risks that are inherent in the nature of product distribution, including import / export matters and the failure to obtain any required regulatory and other approvals (or to do so in a timely manner) and availability in each market of product inputs and finished products. The anticipated timeline for entry to markets may change for a number of reasons, including the inability to secure necessary regulatory requirements, or the need for additional time to conclude and/or satisfy the manufacturing and distribution arrangements. As a result of the foregoing, readers should not place undue reliance on the forward-looking information contained in this news release concerning the timing of launch of product distribution. A comprehensive discussion of other risks that impact Innocan can also be found in Innocan’s public reports and filings which are available under Innocan’s profile at www.sedar.com.
Readers are cautioned that undue reliance should not be placed on forward-looking information as actual results may vary materially from the forward-looking information. Innocan does not undertake to update, correct or revise any forward looking information as a result of any new information, future events or otherwise, except as may be required by applicable law.
Photo – https://stockburger.news/wp-content/uploads/2024/11/Revenues.jpg
Logo – https://mma.prnewswire.com/media/2046271/3968398/Innocan_Pharma_Corporation_Logo.jpg
![]() View original content to download multimedia:https://www.prnewswire.com/news-releases/innocan-pharma-reports-third-quarter-2024-financial-results-302311841.html
View original content to download multimedia:https://www.prnewswire.com/news-releases/innocan-pharma-reports-third-quarter-2024-financial-results-302311841.html
SOURCE Innocan Pharma Corporation

![]() View original content to download multimedia: http://www.newswire.ca/en/releases/archive/November2024/20/c7162.html
View original content to download multimedia: http://www.newswire.ca/en/releases/archive/November2024/20/c7162.html
© 2024 Benzinga.com. Benzinga does not provide investment advice. All rights reserved.
Special Distribution Estimate for Canso Credit Income Fund (the "Fund")
TORONTO, Nov. 20, 2024 /CNW/ – Lysander Funds Limited announces estimated special distributions for each class of units of Canso Credit Income Fund ( the “Fund”) PBY as follows:
Estimated Special Distribution
Based on information prepared as of October 31, 2024, the Fund estimates paying an additional distribution (“Special Distribution“) in respect of each class of units as follows:
- Class A units: $0.19386 /unit
- Class F units: $0.22668 /unit
The estimated Special Distribution will be payable on December 31, 2024, to unitholders of record as of December 31, 2024. The estimated Special Distribution will be paid on or about January 2, 2025.
The estimated Special Distribution will be paid by the issuance of the same class of units of the Fund, and immediately thereafter, each class of issued and outstanding units of the Fund will be consolidated such that the number of issued and outstanding units of each class of the Fund will not change.
The final amount of the Special Distribution will be announced as soon as it is finalized. The actual taxable amounts of all distributions for 2024, including the tax characteristics of the monthly cash and Special Distributions, will be reported to investment dealers (through CDS Clearing and Depository Services Inc. or “CDS”) in early 2025.
Lysander Funds Limited (“Lysander”) is the Fund’s manager and provides estimated distributions for information purposes only. These estimates are not intended to be, nor should they be construed to be, legal or tax advice to any particular person.
Commissions, management fees and expenses all may be associated with investments funds. Please read the prospectus before investing. The Fund is not guaranteed, its value changes frequently and past performance may not be repeated. You will usually pay brokerage fees to your dealer if you purchase or sell units of the Fund on the Toronto Stock Exchange. If the units are purchased or sold on the Toronto Stock Exchange, investors may pay more than the current net asset value when buying units of the Fund and may receive less than the current net asset value when selling them. There are ongoing fees and expenses associated with owning units of an investment fund. An investment fund must prepare disclosure documents that contain key information about the fund. You can find more detailed information about the Fund in these documents.
Forward-looking Information
This press release contains forward-looking statements with respect to the estimated Special Distributions. By their nature, these forward-looking statements involve certain risks and uncertainties that could cause the actual distributions to differ materially from those contemplated by the forward-looking statements. Material factors that could cause the actual Special Distributions to differ from the estimated Special Distributions between now and the Fund’s tax year-end, without limitation: the actual amounts of income received by the Fund and the actual amount of capital gains generated from the sales of securities.
The forward-looking statements are not historical facts but reflect the current expectations of Lysander regarding future results or events and are based on information currently available to them. Certain material factors and assumptions were applied in providing these forward-looking statements. All forward-looking statements in this press release are qualified by these cautionary statements. Lysander believes that the expectations reflected in forward-looking statements are based upon reasonable assumptions; however, Lysander can give no assurance that the actual results or developments will be realized. These forward-looking statements are subject to a number of risks and uncertainties that could cause actual results or events to differ materially from current expectations. Readers, therefore, should not place undue reliance on any such forward-looking statements. Further, a forward-looking statement speaks only as of the date on which such statement is made. Lysander undertakes no obligation to publicly update any such statement or to reflect new information or the occurrence of future events or circumstances except as required by securities laws. These forward-looking statements are made as of the date of this press release.
SOURCE Canso Credit Income Fund

![]() View original content: http://www.newswire.ca/en/releases/archive/November2024/20/c4510.html
View original content: http://www.newswire.ca/en/releases/archive/November2024/20/c4510.html
Market News and Data brought to you by Benzinga APIs
© 2024 Benzinga.com. Benzinga does not provide investment advice. All rights reserved.
What's The Average 'Upper Class' Retirement Nest Egg? Here's A Look At What The Wealthiest 20% Have Stashed Away
You’re scrolling through social media and another friend is showing off their latest Mediterranean cruise. It’s hard not to wonder – are they living the dream or ignoring the whole “retirement savings” thing?
If they’re part of the upper class, there’s a good chance they have the money to fund both their vacations and their future. But how much have they saved for retirement? And where do you stand?
Don’t Miss:
What’s Considered “Upper Class?”
Before examining the numbers, it’s important to understand what “upper class” actually means.
According to Pew Research, the median income for a three-person upper-class household was $256,920 in 2022. However, income is only part of the equation. Wealth – defined as net worth – is a major factor, especially regarding retirement savings.
A New York Times analysis suggests that the top 20% of families have a wealth-to-income ratio of about 3 to 1. A household earning $256,920 has a net worth of around $770,760.
Now, let’s compare that to data from the Federal Reserve. According to their latest Survey of Consumer Finances:
-
The top 10% of households have a median net worth of $2.7 million.
-
The next bracket (11th – 25th percentile) holds a median net worth of just over $790,000.
So, whether you’re using income or wealth as your metric, the upper class is miles ahead of the national average.
Trending: Many are using this retirement income calculator to check if they’re on pace — here’s a breakdown on how on what’s behind this formula.
The Average Retirement Savings for the Upper Class
When it comes to retirement savings, the upper class doesn’t disappoint. According to data from The Motley Fool:
-
The top 10% of earners have a median retirement savings balance of $900,000.
-
Those in the next tier (75th – 89.9th percentile) have a median balance of $269,000.
Since the upper class typically includes the top 20%, a reasonable estimate for their median retirement savings is between $400,000 and $500,000. While exact numbers aren’t available for the full group, their savings are far above the national medians:
-
Median retirement savings for all U.S. households: $87,000.
-
Households under 35: Just $18,800.
If your retirement savings are in the six-figure range, you’re closer to the upper-class average than most people. If not, there’s still time to step up your game.
Sadot Group Recent Insider Activity
A new SEC filing reveals that Jennifer K Black, Chief Financial Officer at Sadot Group SDOT, made a notable insider purchase on November 20,.
What Happened: In a recent Form 4 filing with the U.S. Securities and Exchange Commission on Wednesday, Black increased their investment in Sadot Group by purchasing 40,178 shares through open-market transactions, signaling confidence in the company’s potential. The total transaction value is $134,998.
Sadot Group‘s shares are actively trading at $3.2, experiencing a up of 5.96% during Wednesday’s morning session.
Unveiling the Story Behind Sadot Group
Sadot Group Inc operates in the food supply chain sector, connecting producers and consumers across the globe, delivering agri-commodities from producing geographies such as the Americas, Africa, and the Black Sea to consumer markets in Southeast Asia, China, and the Middle East/North Africa (MENA) region. Its reportable segment includes Sadot food service and Sadot agri-foods. The key revenue is coming from the Sadot agri-foods segment which engaged in farming, commodity trading, and shipping of food and feed.
Financial Insights: Sadot Group
Revenue Growth: Sadot Group’s remarkable performance in 3 months is evident. As of 30 September, 2024, the company achieved an impressive revenue growth rate of 10.74%. This signifies a substantial increase in the company’s top-line earnings. When compared to others in the Consumer Staples sector, the company faces challenges, achieving a growth rate lower than the average among peers.
Key Profitability Indicators:
-
Gross Margin: The company issues a cost efficiency warning with a low gross margin of 1.22%, indicating potential difficulties in maintaining profitability compared to its peers.
-
Earnings per Share (EPS): Sadot Group’s EPS lags behind the industry average, indicating concerns and potential challenges with a current EPS of 0.25.
Debt Management: Sadot Group’s debt-to-equity ratio is below the industry average at 0.11, reflecting a lower dependency on debt financing and a more conservative financial approach.
Understanding Financial Valuation:
-
Price to Earnings (P/E) Ratio: Sadot Group’s P/E ratio of 10.07 is below the industry average, suggesting the stock may be undervalued.
-
Price to Sales (P/S) Ratio: The Price to Sales ratio is 0.02, which is lower than the industry average. This suggests a possible undervaluation based on sales performance.
-
EV/EBITDA Analysis (Enterprise Value to its Earnings Before Interest, Taxes, Depreciation & Amortization): Indicated by a lower-than-industry-average EV/EBITDA ratio of 3.41, the company suggests a potential undervaluation, which might be advantageous for value-focused investors.
Market Capitalization Analysis: Below industry benchmarks, the company’s market capitalization reflects a smaller scale relative to peers. This could be attributed to factors such as growth expectations or operational capacity.
Now trade stocks online commission free with Charles Schwab, a trusted and complete investment firm.
The Importance of Insider Transactions
Insider transactions shouldn’t be used primarily to make an investing decision, however an insider transaction can be an important factor in the investing decision.
When discussing legal matters, the term “insider” refers to any officer, director, or beneficial owner holding more than ten percent of a company’s equity securities, as stipulated in Section 12 of the Securities Exchange Act of 1934. This includes executives in the c-suite and significant hedge funds. Such insiders are required to report their transactions through a Form 4 filing, which must be completed within two business days of the transaction.
A new purchase by a company insider is a indication that they anticipate the stock will rise.
On the other hand, insider sells may not necessarily indicate a bearish view and can be motivated by various factors.
Navigating the World of Insider Transaction Codes
Delving into transactions, investors typically prioritize those unfolding in the open market, as precisely outlined in Table I of the Form 4 filing. A P in Box 3 indicates a purchase, while S signifies a sale. Transaction code C signals the conversion of an option, and transaction code A denotes a grant, award, or other acquisition of securities from the company.
Check Out The Full List Of Sadot Group’s Insider Trades.
Insider Buying Alert: Profit from C-Suite Moves
Benzinga Edge reveals every insider trade in real-time. Don’t miss the next big stock move driven by insider confidence. Unlock this ultimate sentiment indicator now. Click here for access.
This article was generated by Benzinga’s automated content engine and reviewed by an editor.
Market News and Data brought to you by Benzinga APIs
© 2024 Benzinga.com. Benzinga does not provide investment advice. All rights reserved.
Toronto Hydro Corporation reports its third quarter financial results for 2024
TORONTO, Nov. 20, 2024 /CNW/ – Toronto Hydro Corporation (Toronto Hydro) has announced its financial and operating results for the third quarter ended September 30, 2024.
|
Selected financial and operational highlights (in millions of Canadian dollars) |
||||
|
Three months ended September 30 |
Nine months ended September 30 |
|||
|
2024 $ |
2023 $ |
2024 $ |
2023 $ |
|
|
Distribution revenue |
246.4 |
219.9 |
705.3 |
629.1 |
|
Net income after net movements in regulatory balances |
45.0 |
39.3 |
121.3 |
119.5 |
|
Capital expenditures |
204.4 |
202.3 |
621.1 |
541.7 |
KEY FINANCIAL HIGHLIGHTS
Distribution revenue for the nine months ended Sep. 30, 2024 was $705.3 million:
- Increase of $76.2 million compared to the comparable period in 2023
- The increase was driven by higher revenue collected through Ontario Energy Board (OEB)-approved rate riders, higher 2024 distribution rates and higher electricity consumption
Net income after net movements in regulatory balances for the nine months ended Sep. 30, 2024 was $121.3 million:
- Increase of $1.8 million compared to the comparable period in 2023
- The increase was primarily due to higher distribution revenue
- This was partially offset by lower other gains related to variable consideration recognized in the prior period, higher operating expenses, higher financing costs, and higher depreciation and amortization expense
Capital expenditures for the nine months ended Sep. 30, 2024 were $621.1 million:
- Increase of $79.4 million compared to the comparable period in 2023
- Capital initiatives in 2024 included the delivery of customer connections, replacement of overhead and underground infrastructures, and customer-initiated plant relocations and expansions
CORPORATE DEVELOPMENTS
On Sep. 18, the maturity date of Toronto Hydro’s revolving credit facility was extended from Sep. 18, 2028 to Sep. 18, 2029.
On Sep. 26, Toronto Hydro issued $250.0 million of 3.99% senior unsecured debentures due on Sep. 26, 2034.
On Oct. 30, S&P Global Ratings raised Toronto Hydro’s issuer rating and senior unsecured debentures rating from “A” to “A+” and revised Toronto Hydro’s issuer rating outlook from “positive” to “stable.”
On Nov. 12, the OEB issued a decision in relation to Toronto Hydro’s 2025–2029 Custom Incentive Rate-setting Application, in which it approved the Settlement Proposal as filed, and provided for a process through which the OEB can finalize the electricity distribution rates for the first year of the five-year rate period effective Jan. 1, 2025. The OEB decision approves a custom incentive rate-setting index for the period commencing on Jan. 1, 2026 and ending on Dec. 31, 2029.
On Nov. 20, Toronto Hydro’s Board of Directors declared a dividend in the amount of $20.9 million with respect to the fourth quarter of 2024, which is payable to the City of Toronto by Dec. 31, 2024.
QUICK FACTS
- Toronto Hydro’s financial and operational results are reported quarterly and available at torontohydro.com/reports and through sedarplus.ca
- Toronto Hydro is required to submit a plan for its proposed rates and spending to the OEB through an open and transparent process known as a rate application
- Toronto Hydro continues to invest in its grid to maintain safety and reliability, support a growing city, enable clean energy, and prepare for and respond to extreme weather. For more information about Toronto Hydro’s next five-year plan, please visit torontohydro.com/investmentplan
QUOTE
“Toronto Hydro remains committed to providing safe and reliable electricity to the many homes and businesses of Toronto, while continuing to invest in expanding, modernizing and sustaining the grid and our operations to meet the current and future needs of our customers. The decision from the OEB this quarter on our 2025–2029 rate application and investment plan will help ensure that we can continue with this important work for years to come.”
– Jana Mosley, President and CEO, Toronto Hydro
ABOUT TORONTO HYDRO
Toronto Hydro is a holding company which wholly owns two subsidiaries:
- Toronto Hydro-Electric System Limited (THESL) – distributes electricity; and
- Toronto Hydro Energy Services Inc. – provides streetlighting and expressway lighting services in the city of Toronto
The principal business of Toronto Hydro and its subsidiaries is the distribution of electricity by THESL, which owns and operates the electricity distribution system for Canada’s largest city. Recognized as a Sustainable Electricity Leader™ by Electricity Canada, it has approximately 794,000 customers located in the city of Toronto and distributes approximately 18 per cent of the electricity consumed in Ontario.
SOCIAL MEDIA ACCOUNTS
X: x.com/torontohydro
Instagram: instagram.com/torontohydro
Facebook: facebook.com/torontohydro
YouTube: youtube.com/torontohydro
LinkedIn: linkedin.com/company/toronto-hydro
FORWARD-LOOKING INFORMATION
Certain information included in this news release constitutes “forward-looking information” within the meaning of applicable securities legislation. All information, other than statements of historical fact, which address activities, events or developments that we expect or anticipate may or will occur in the future, are forward-looking information. The words “anticipates,” “believes,” “budgets,” “can,” “committed,” “continual,” “could,” “estimates,” “expects,” “focus,” “forecasts,” “further notice,” “future,” “impact,” “increasingly,” “intends,” “may,” “might,” “objective,” “once,” “ongoing,” “outlook,” “plans,” “propose,” “projects,” “schedule,” “seek,” “should,” “trend,” “will,” “would,” or the negative or other variations of these words or other comparable words or phrases, are intended to identify forward-looking information, although not all forward-looking information contains these identifying words. The purpose of the forward-looking information (including any financial outlook) contained herein is to provide Toronto Hydro’s current expectations regarding its future results of operations, performance, business prospects and opportunities, and readers are cautioned that such information may not be appropriate for other purposes. All forward-looking information is given pursuant to the “safe harbour” provisions of applicable Canadian securities legislation.
Specific forward-looking information in this news release includes, but is not limited to, statements regarding the payment of dividends to the City of Toronto as shareholder.
The forward-looking information reflects Toronto Hydro’s current beliefs and is based on information currently available to Toronto Hydro. The forward-looking information is based on estimates and assumptions made by Toronto Hydro’s management in light of past experience and perception of historical trends, current conditions and expected future developments, as well as other factors that management believes to be reasonable in the circumstances, including, but not limited to: the amount of indebtedness of Toronto Hydro; changes in funding requirements; the future course of the economy and financial markets; no unforeseen delays and costs in Toronto Hydro’s capital projects; no unforeseen changes to project plans; compliance with covenants; the receipt of favourable judgments; no unforeseen changes in electricity distribution rate orders or rate-setting methodologies; no unfavourable changes in environmental regulation; the ratings issued by credit rating agencies; the level of interest rates; Toronto Hydro’s ability to borrow; and assumptions regarding general business and economic conditions.
Forward-looking information is subject to risks, uncertainties and other factors that could cause actual results to differ materially from historical results or results anticipated by the forward-looking information. The factors which could cause results or events to differ from current expectations include, but are not limited to: risks associated with the execution of Toronto Hydro’s capital and maintenance programs necessary to maintain the performance of aging distribution assets and make required infrastructure improvements, including to deliver a modernized grid and meet electrification requirements to achieve government net-zero greenhouse gas (GHG) emissions targets; risks associated with capital projects; risks associated with changing weather patterns due to climate change and resultant impacts to electricity consumption based on historical seasonal trends; risks of changing government policy and regulatory requirements, including in respect of climate change and the energy transition; risks of municipal government activity, including the risk that the City could introduce rules, policies or directives, including those relating to net-zero GHG emissions targets, that could potentially limit Toronto Hydro’s ability to meet its business objectives as laid out in its Shareholder Direction principles; risks of Toronto Hydro being unable to retain necessary qualified external contracting forces relating to its capital, maintenance and reactive infrastructure program; risk that Toronto Hydro is not able to arrange sufficient and cost-effective debt financing to repay maturing debt and to fund capital expenditures and other obligations; risk that Toronto Hydro is unable to maintain its financial health and performance at acceptable levels; risk that insufficient debt or equity financing will be available to meet Toronto Hydro’s requirements, objectives or strategic opportunities; risk of downgrades to Toronto Hydro’s credit rating; risks related to the timing and extent of changes in prevailing interest rates and discount rates and their effect on future revenue requirements and future post-employment benefit obligations; risks arising from inflation, the course of the economy and other general macroeconomic factors; risk associated with the impairment to Toronto Hydro’s image in the community, public confidence or brand; risk associated with Toronto Hydro failing to meet its material compliance obligations under legal and regulatory instruments; and risks associated with market expectations with respect to increases in demand for electricity.
The Corporation cautions the reader that the above list of factors is not exhaustive, and there may be other factors that cause actual events or results to differ materially from those described in forward-looking information. Some of the other factors are discussed more fully under the heading “Risk Factors” in Toronto Hydro’s Annual Information Form for the year ended December 31, 2023.
All forward-looking information in this document is qualified in its entirety by the above cautionary statements. Furthermore, unless otherwise stated, all forward-looking information contained herein is made as of the date hereof, and Toronto Hydro undertakes no obligation to revise or update any forward-looking information as a result of new information, future events or otherwise, except as required by law.
SOURCE Toronto Hydro Corporation

![]() View original content to download multimedia: http://www.newswire.ca/en/releases/archive/November2024/20/c4150.html
View original content to download multimedia: http://www.newswire.ca/en/releases/archive/November2024/20/c4150.html
© 2024 Benzinga.com. Benzinga does not provide investment advice. All rights reserved.
Spotlight on Wayfair: Analyzing the Surge in Options Activity
Financial giants have made a conspicuous bullish move on Wayfair. Our analysis of options history for Wayfair W revealed 12 unusual trades.
Delving into the details, we found 41% of traders were bullish, while 41% showed bearish tendencies. Out of all the trades we spotted, 3 were puts, with a value of $498,510, and 9 were calls, valued at $470,319.
What’s The Price Target?
Analyzing the Volume and Open Interest in these contracts, it seems that the big players have been eyeing a price window from $25.0 to $130.0 for Wayfair during the past quarter.
Insights into Volume & Open Interest
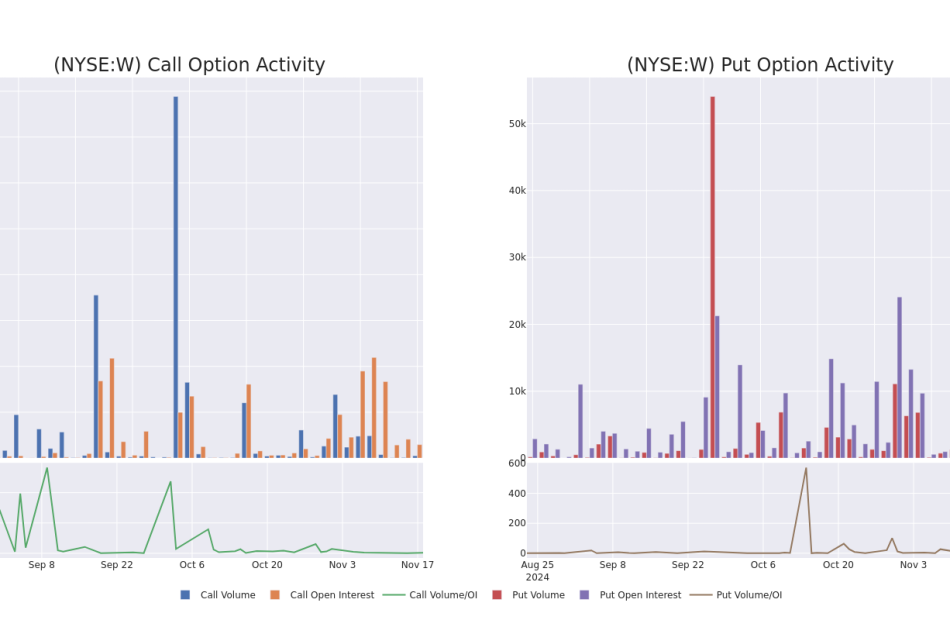
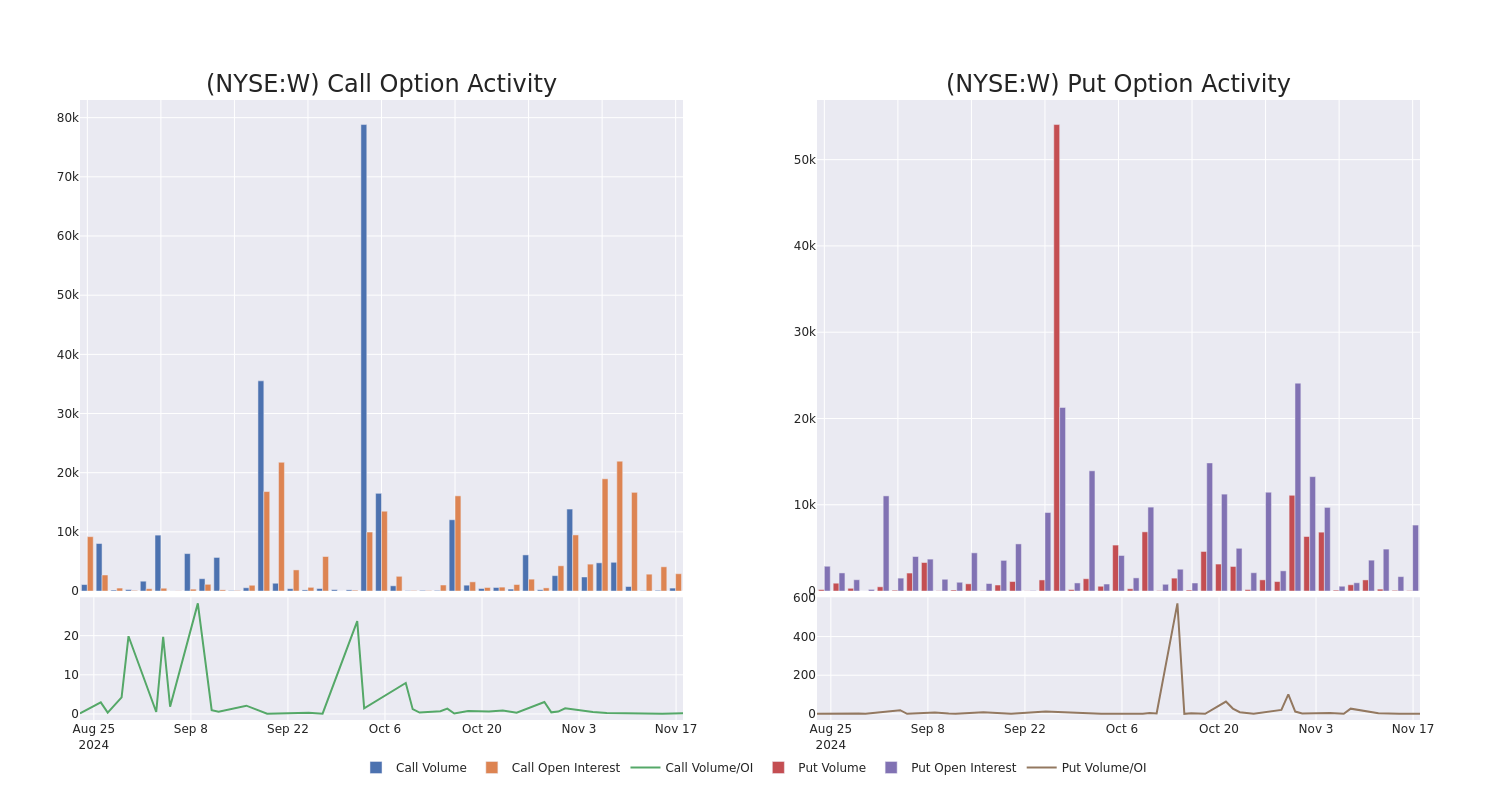
Examining the volume and open interest provides crucial insights into stock research. This information is key in gauging liquidity and interest levels for Wayfair’s options at certain strike prices. Below, we present a snapshot of the trends in volume and open interest for calls and puts across Wayfair’s significant trades, within a strike price range of $25.0 to $130.0, over the past month.
Wayfair Call and Put Volume: 30-Day Overview
Noteworthy Options Activity:
| Symbol | PUT/CALL | Trade Type | Sentiment | Exp. Date | Ask | Bid | Price | Strike Price | Total Trade Price | Open Interest | Volume |
|---|---|---|---|---|---|---|---|---|---|---|---|
| W | PUT | TRADE | BULLISH | 12/19/25 | $3.15 | $2.88 | $2.9 | $25.00 | $292.6K | 2.9K | 1.0K |
| W | PUT | SWEEP | BEARISH | 12/06/24 | $8.0 | $7.85 | $8.0 | $50.00 | $180.0K | 305 | 225 |
| W | CALL | TRADE | NEUTRAL | 12/19/25 | $1.49 | $1.28 | $1.4 | $130.00 | $140.0K | 1.2K | 1.0K |
| W | CALL | TRADE | BEARISH | 01/17/25 | $1.86 | $1.78 | $1.78 | $50.00 | $58.0K | 2.6K | 1.1K |
| W | CALL | TRADE | NEUTRAL | 05/16/25 | $8.65 | $8.35 | $8.52 | $42.50 | $51.9K | 97 | 61 |
About Wayfair
Wayfair engages in e-commerce in the United States (87% of 2023 sales), Canada, the United Kingdom, Germany, and Ireland. It’s also embarked on expansion into the brick-and-mortar landscape, with a handful of stores between the AllModern, Birch Lane, Joss & Main, and Wayfair banners. At the end of 2023, the firm offered more than 30 million products from more than 20,000 suppliers under the brands Wayfair, Joss & Main, AllModern, Birch Lane, and Perigold. Its offerings include furniture, everyday and seasonal decor, decorative accents, housewares, and other home goods. Wayfair was founded in 2002 and began trading publicly in 2014.
In light of the recent options history for Wayfair, it’s now appropriate to focus on the company itself. We aim to explore its current performance.
Where Is Wayfair Standing Right Now?
- With a trading volume of 2,701,071, the price of W is up by 4.21%, reaching $42.47.
- Current RSI values indicate that the stock is is currently neutral between overbought and oversold.
- Next earnings report is scheduled for 92 days from now.
What The Experts Say On Wayfair
Over the past month, 5 industry analysts have shared their insights on this stock, proposing an average target price of $55.4.
Turn $1000 into $1270 in just 20 days?
20-year pro options trader reveals his one-line chart technique that shows when to buy and sell. Copy his trades, which have had averaged a 27% profit every 20 days. Click here for access.
* Maintaining their stance, an analyst from Mizuho continues to hold a Outperform rating for Wayfair, targeting a price of $60.
* Consistent in their evaluation, an analyst from Citigroup keeps a Buy rating on Wayfair with a target price of $54.
* Maintaining their stance, an analyst from Piper Sandler continues to hold a Overweight rating for Wayfair, targeting a price of $63.
* Consistent in their evaluation, an analyst from RBC Capital keeps a Sector Perform rating on Wayfair with a target price of $50.
* An analyst from BMO Capital persists with their Market Perform rating on Wayfair, maintaining a target price of $50.
Options trading presents higher risks and potential rewards. Astute traders manage these risks by continually educating themselves, adapting their strategies, monitoring multiple indicators, and keeping a close eye on market movements. Stay informed about the latest Wayfair options trades with real-time alerts from Benzinga Pro.
Market News and Data brought to you by Benzinga APIs
© 2024 Benzinga.com. Benzinga does not provide investment advice. All rights reserved.
This Is What Whales Are Betting On JD.com
Investors with a lot of money to spend have taken a bearish stance on JD.com JD.
And retail traders should know.
We noticed this today when the trades showed up on publicly available options history that we track here at Benzinga.
Whether these are institutions or just wealthy individuals, we don’t know. But when something this big happens with JD, it often means somebody knows something is about to happen.
So how do we know what these investors just did?
Today, Benzinga‘s options scanner spotted 20 uncommon options trades for JD.com.
This isn’t normal.
The overall sentiment of these big-money traders is split between 40% bullish and 45%, bearish.
Out of all of the special options we uncovered, 5 are puts, for a total amount of $550,850, and 15 are calls, for a total amount of $2,486,931.
Expected Price Movements
Based on the trading activity, it appears that the significant investors are aiming for a price territory stretching from $28.0 to $70.0 for JD.com over the recent three months.
Volume & Open Interest Development
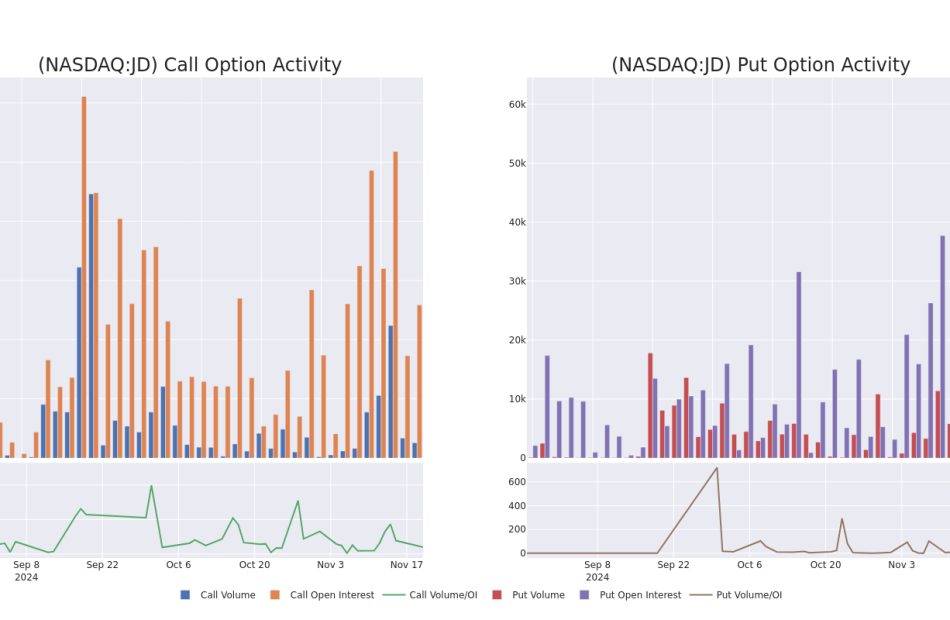
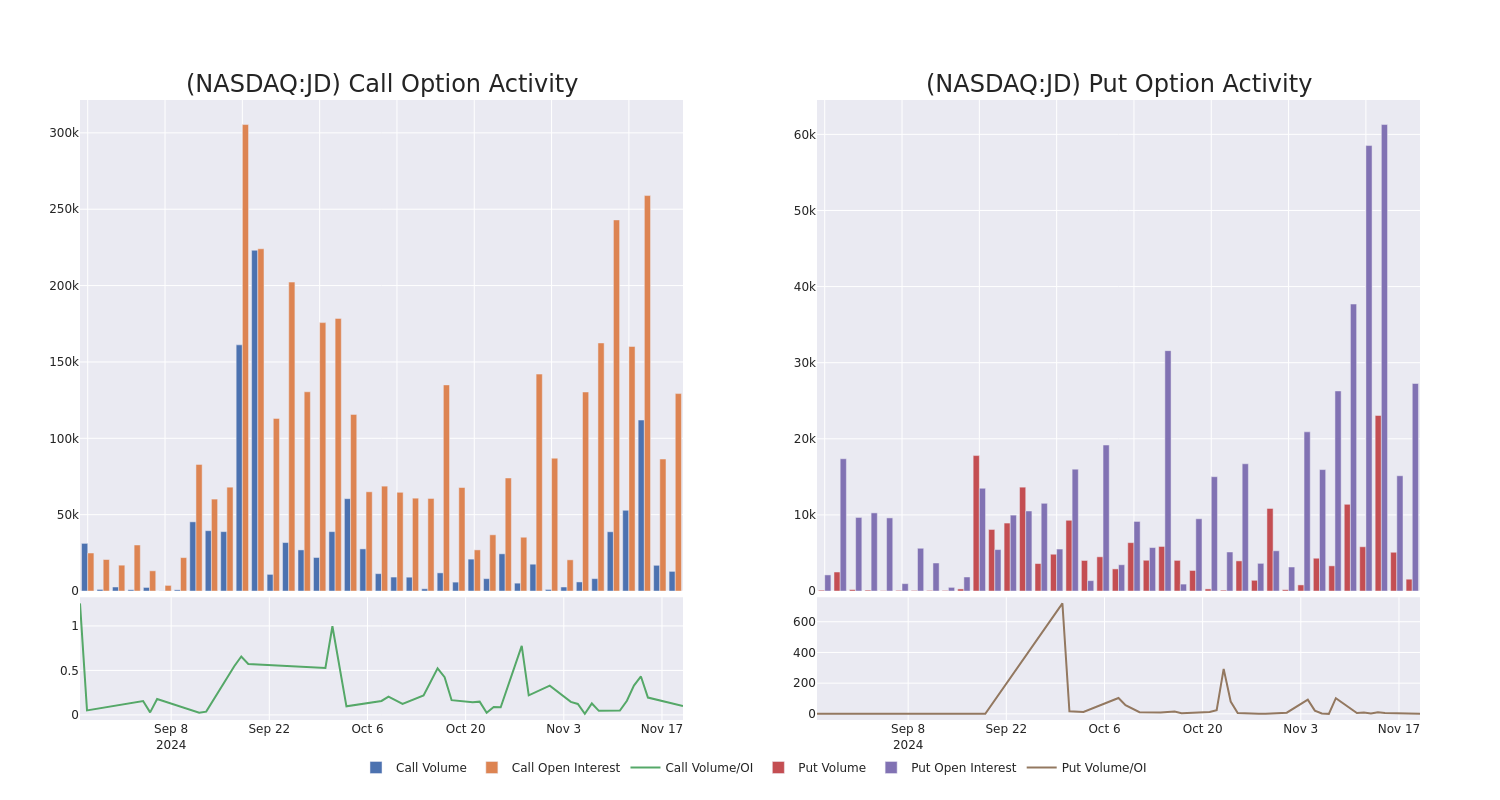
Assessing the volume and open interest is a strategic step in options trading. These metrics shed light on the liquidity and investor interest in JD.com’s options at specified strike prices. The forthcoming data visualizes the fluctuation in volume and open interest for both calls and puts, linked to JD.com’s substantial trades, within a strike price spectrum from $28.0 to $70.0 over the preceding 30 days.
JD.com Option Volume And Open Interest Over Last 30 Days
Biggest Options Spotted:
| Symbol | PUT/CALL | Trade Type | Sentiment | Exp. Date | Ask | Bid | Price | Strike Price | Total Trade Price | Open Interest | Volume |
|---|---|---|---|---|---|---|---|---|---|---|---|
| JD | CALL | TRADE | BULLISH | 03/21/25 | $2.53 | $2.47 | $2.51 | $39.00 | $815.7K | 528 | 0 |
| JD | CALL | SWEEP | NEUTRAL | 01/17/25 | $5.85 | $5.75 | $5.75 | $30.00 | $287.5K | 25.1K | 1.5K |
| JD | CALL | TRADE | BULLISH | 01/17/25 | $5.75 | $5.7 | $5.75 | $30.00 | $287.5K | 25.1K | 1.0K |
| JD | CALL | SWEEP | BULLISH | 01/17/25 | $5.75 | $5.7 | $5.75 | $30.00 | $287.5K | 25.1K | 1.0K |
| JD | CALL | SWEEP | BEARISH | 01/17/25 | $5.8 | $5.75 | $5.75 | $30.00 | $287.5K | 25.1K | 504 |
About JD.com
JD.com is a leading e-commerce platform with its 2022 China GMV being similar to Pinduoduo (GMV not reported), on our estimate, but still lower than Alibaba. it offers a wide selection of authentic products with speedy and reliable delivery. The company has built its own nationwide fulfilment infrastructure and last-mile delivery network, staffed by its own employees, which supports both its online direct sales, its online marketplace and omnichannel businesses.
In light of the recent options history for JD.com, it’s now appropriate to focus on the company itself. We aim to explore its current performance.
Where Is JD.com Standing Right Now?
- With a trading volume of 5,083,311, the price of JD is down by -0.26%, reaching $35.1.
- Current RSI values indicate that the stock is is currently neutral between overbought and oversold.
- Next earnings report is scheduled for 105 days from now.
What Analysts Are Saying About JD.com
In the last month, 2 experts released ratings on this stock with an average target price of $49.0.
Turn $1000 into $1270 in just 20 days?
20-year pro options trader reveals his one-line chart technique that shows when to buy and sell. Copy his trades, which have had averaged a 27% profit every 20 days. Click here for access.
* In a cautious move, an analyst from Benchmark downgraded its rating to Buy, setting a price target of $47.
* An analyst from Citigroup persists with their Buy rating on JD.com, maintaining a target price of $51.
Options trading presents higher risks and potential rewards. Astute traders manage these risks by continually educating themselves, adapting their strategies, monitoring multiple indicators, and keeping a close eye on market movements. Stay informed about the latest JD.com options trades with real-time alerts from Benzinga Pro.
Market News and Data brought to you by Benzinga APIs
© 2024 Benzinga.com. Benzinga does not provide investment advice. All rights reserved.
MicroStrategy Stock Surges Further as Big Bitcoin Buys Pay Off
CFOTO / Future Publishing via Getty Images
-
MicroStrategy shares surged again Wednesday, lifted by bitcoin’s recent record-high.
-
The technology company is the largest corporate holder of bitcoin, with about $31 billion worth in its portfolio.
-
MicroStrategy stock is up nearly 700% this year, even outperforming bitcoin itself.
MicroStrategy (MSTR) shares rocketed higher again Wednesday, as the largest corporate holder of bitcoin reaps the benefits of record high prices for the cryptocurrency.
The price of bitcoin hit a record of more than $94,000 on Tuesday, and MicroStrategy has been buying a ton of it. Over a six-day span earlier this month, the technology company acquired 51,780 bitcoin for roughly $4.6 billion, according to a recent regulatory filing, even with some prices already having crossed the $90,000 threshold.
All told, as of Sunday MicroStrategy held 331,200 bitcoin, which is worth about $31 billion at current prices. In fact, its shares have outperformed bitcoin this year, soaring nearly 700% this year as bitcoin has a bit more than doubled. Its stock, which has doubled this month, surged a further 15% to $495.98 in recent trading.
Notably, MicroStrategy still holds far less than the 474,627 bitcoin held as of yesterday by BlackRock’s iShares Bitcoin Trust (IBIT), which is the largest bitcoin exchange-traded fund (ETF).
Donald Trump Reportedly Eyeing The First Crypto-Focused Role In The White House
President-elect Donald Trump’s transition team is considering creating the first-ever White House role dedicated to cryptocurrency policy, signaling a potential shift in the U.S. government’s approach to digital assets.
What Happened: The Trump transition team is evaluating candidates for a role that would act as a bridge between the White House, Congress, and regulatory agencies like the SEC and CFTC.
Bloomberg reported on Wednesday that while the exact nature of the position remains unclear, industry advocates are pushing for direct access to Trump.
The creation of this position aligns with Trump’s campaign promises to overhaul crypto regulation, including replacing SEC Chair Gary Gensler and forming a new crypto advisory council.
Key industry players are already vying for influence.
Brian Brooks, a former executive at Coinbase and Binance.US, met with Trump at Mar-a-Lago, while Coinbase CEO Brian Armstrong reportedly held discussions with the president-elect this week.
Also Read: A Hedge Fund Hit Big On Trump’s Rumored Crypto Acquisition And Could Be Up $14.15 Million
Why It Matters: Trump’s connection to the crypto industry runs deep.
During his campaign, he promised substantial reforms and frequently engaged with Bitcoin mining firms and exchange executives.
In July, he even addressed a Bitcoin conference, further solidifying his interest in the sector by stating he will U.S. the crypto capital of the planet.
Beyond policy, Trump has made personal forays into the crypto space, including the release of his fourth NFT collection.
His media venture, Trump Media & Technology Group, has also expressed interest in acquiring Bakkt Holdings, a company specializing in crypto custody and trading.
Meanwhile, private equity billionaire Marc Rowan, a potential Treasury Secretary pick, admitted limited expertise in crypto’s role within the U.S. financial system, indicating the potential significance of a dedicated crypto-focused role.
Read Next:
Image: Shuterstock
Market News and Data brought to you by Benzinga APIs
© 2024 Benzinga.com. Benzinga does not provide investment advice. All rights reserved.
DoubleTree by Hilton Greensboro Airport Celebrates Grand Reopening with Ribbon-Cutting Event After Extensive Renovations
GREENSBORO, N.C., Nov. 20, 2024 /PRNewswire/ — DoubleTree by Hilton Greensboro Airport successfully held its grand opening and ribbon-cutting ceremony, celebrating the completion of extensive renovations to the property. The event welcomed local dignitaries, business leaders, members of the Greensboro Chamber of Commerce, Visit Greensboro, and members of the community to experience the revitalized spaces. The hotel is managed by Commonwealth Hotels, a Covington, Kentucky-based hotel management company, and owned by SMP Greensboro LLC which is a part of the Scale My Portfolio group which partners with retail investors to buy Commercial real estate assets such as hotels and Apartment communities around the country.
Located just minutes from Piedmont Triad International Airport, DoubleTree by Hilton Greensboro Airport has served as a prominent hospitality venue in Greensboro. The newly updated property now combines DoubleTree brand’s signature comfort with modern design and enhanced amenities, meeting the needs of today’s travelers.
Renovations included newly designed guestrooms, modernized lobby and public spaces, refreshed dining options, and enhanced meeting and event spaces.
Guests at the event had the opportunity to tour the renovated spaces, meet with the hotel’s management team, and enjoy light refreshments. A memorable photograph was taken as local leaders and hotel representatives participated in the ceremonial ribbon cutting.
“We are thrilled to welcome guests to see our transformed property and experience our commitment to excellence firsthand,” said Jennifer Porter, president of Commonwealth Hotels. “These renovations reflect our dedication to providing the highest quality of service and comfort to all who stay with us.”
With these renovations, DoubleTree by Hilton Greensboro Airport remains a top choice for travelers to Greensboro, offering all the signature touches of the brand, including its iconic warm chocolate chip cookie at check-in.
For more information about the DoubleTree by Hilton Greensboro Airport or to book your stay, please visit DoubleTree by Hilton Greensboro Airport or call 336-668-0421.
About Commonwealth Hotels
Commonwealth Hotels was founded in 1986 and is a proven partner in providing hotel management services with superior financial results. The company has extensive experience managing premium branded full-service and select-service hotels. Additional information may be found at commonwealthhotels.com
About Scale My Portfolio
Scale My Portfolio has been involved in over $400mm of Commercial Real Estate transactions across 16 properties over the past 10+ years. The company has over 650 investors who it partners with to invest in assets such as hotels and apartment communities and it offers investors above average returns for investing passively in these assets. Additional Information can be found at www.ScaleMyPortfolio.com
Contact
Barbara E. Willen
Commonwealth Hotels, LLC
bwillen@commonwealthhotels.com
859.392-2254
![]() View original content to download multimedia:https://www.prnewswire.com/news-releases/doubletree-by-hilton-greensboro-airport-celebrates-grand-reopening-with-ribbon-cutting-event-after-extensive-renovations-302311974.html
View original content to download multimedia:https://www.prnewswire.com/news-releases/doubletree-by-hilton-greensboro-airport-celebrates-grand-reopening-with-ribbon-cutting-event-after-extensive-renovations-302311974.html
SOURCE Commonwealth Hotels, Inc.
Market News and Data brought to you by Benzinga APIs
© 2024 Benzinga.com. Benzinga does not provide investment advice. All rights reserved.

