Kinder Morgan's Options Frenzy: What You Need to Know
Whales with a lot of money to spend have taken a noticeably bullish stance on Kinder Morgan.
Looking at options history for Kinder Morgan KMI we detected 8 trades.
If we consider the specifics of each trade, it is accurate to state that 62% of the investors opened trades with bullish expectations and 37% with bearish.
From the overall spotted trades, 2 are puts, for a total amount of $141,820 and 6, calls, for a total amount of $227,197.
What’s The Price Target?
Analyzing the Volume and Open Interest in these contracts, it seems that the big players have been eyeing a price window from $28.0 to $30.0 for Kinder Morgan during the past quarter.
Volume & Open Interest Trends
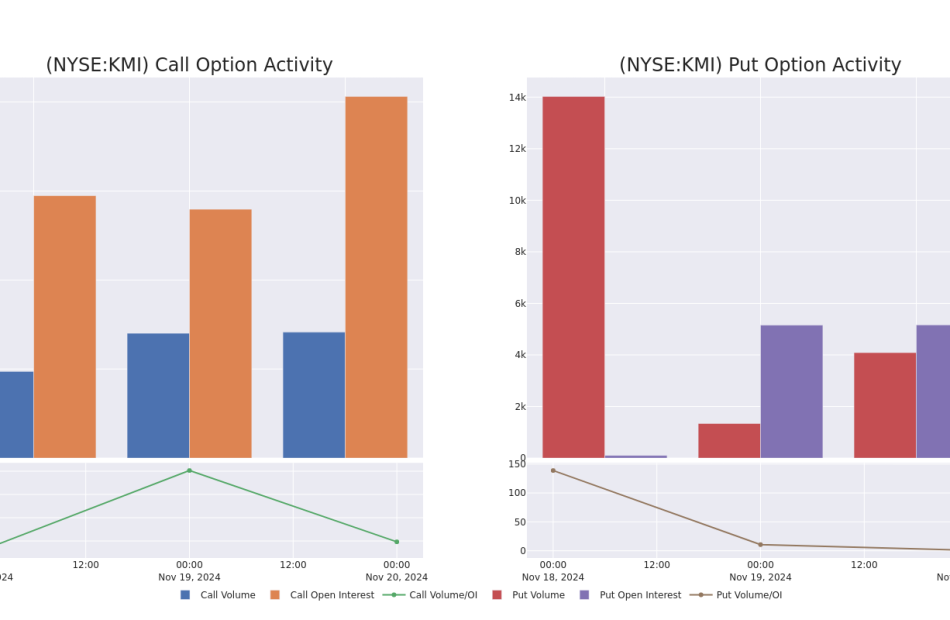
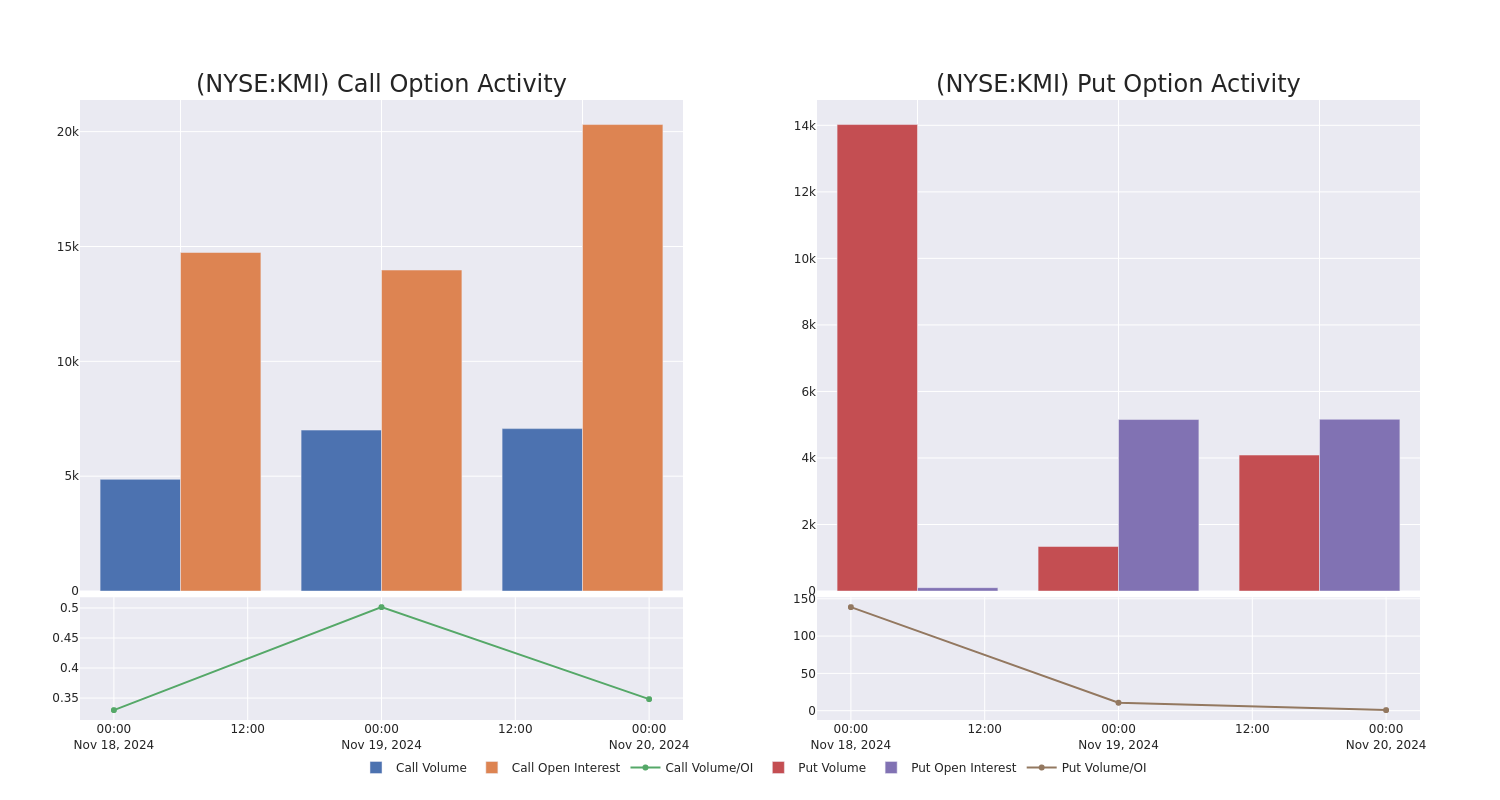
In today’s trading context, the average open interest for options of Kinder Morgan stands at 4245.33, with a total volume reaching 11,159.00. The accompanying chart delineates the progression of both call and put option volume and open interest for high-value trades in Kinder Morgan, situated within the strike price corridor from $28.0 to $30.0, throughout the last 30 days.
Kinder Morgan Call and Put Volume: 30-Day Overview
Largest Options Trades Observed:
| Symbol | PUT/CALL | Trade Type | Sentiment | Exp. Date | Ask | Bid | Price | Strike Price | Total Trade Price | Open Interest | Volume |
|---|---|---|---|---|---|---|---|---|---|---|---|
| KMI | PUT | TRADE | BULLISH | 01/17/25 | $0.95 | $0.9 | $0.9 | $28.00 | $88.9K | 5.1K | 1.0K |
| KMI | CALL | TRADE | BULLISH | 01/16/26 | $2.0 | $1.99 | $2.0 | $30.00 | $60.0K | 8.3K | 326 |
| KMI | PUT | SWEEP | BEARISH | 01/17/25 | $1.01 | $0.97 | $1.0 | $28.00 | $52.9K | 5.1K | 3.0K |
| KMI | CALL | SWEEP | BEARISH | 12/20/24 | $0.72 | $0.69 | $0.69 | $28.00 | $46.0K | 4.7K | 827 |
| KMI | CALL | TRADE | BULLISH | 01/17/25 | $0.6 | $0.59 | $0.6 | $29.00 | $35.1K | 4.0K | 1.1K |
About Kinder Morgan
Kinder Morgan is one of the largest midstream energy firms in North America, with an interest in or an operator on about 82,000 miles in pipelines and 139 storage terminals. The company is active in the transportation, storage, and processing of natural gas, crude oil, refined products, natural gas liquids, and carbon dioxide. The majority of Kinder Morgan’s cash flows stem from fee-based contracts for handling, moving, and storing fossil fuel products.
Following our analysis of the options activities associated with Kinder Morgan, we pivot to a closer look at the company’s own performance.
Kinder Morgan’s Current Market Status
- Currently trading with a volume of 4,049,944, the KMI’s price is down by -0.84%, now at $27.84.
- RSI readings suggest the stock is currently may be overbought.
- Anticipated earnings release is in 56 days.
Expert Opinions on Kinder Morgan
A total of 4 professional analysts have given their take on this stock in the last 30 days, setting an average price target of $28.25.
Turn $1000 into $1270 in just 20 days?
20-year pro options trader reveals his one-line chart technique that shows when to buy and sell. Copy his trades, which have had averaged a 27% profit every 20 days. Click here for access.
* An analyst from UBS persists with their Buy rating on Kinder Morgan, maintaining a target price of $33.
* Maintaining their stance, an analyst from RBC Capital continues to hold a Sector Perform rating for Kinder Morgan, targeting a price of $26.
* Consistent in their evaluation, an analyst from UBS keeps a Buy rating on Kinder Morgan with a target price of $30.
* Maintaining their stance, an analyst from Barclays continues to hold a Equal-Weight rating for Kinder Morgan, targeting a price of $24.
Trading options involves greater risks but also offers the potential for higher profits. Savvy traders mitigate these risks through ongoing education, strategic trade adjustments, utilizing various indicators, and staying attuned to market dynamics. Keep up with the latest options trades for Kinder Morgan with Benzinga Pro for real-time alerts.
Market News and Data brought to you by Benzinga APIs
© 2024 Benzinga.com. Benzinga does not provide investment advice. All rights reserved.
Crude Oil Moves Lower; Williams-Sonoma Shares Gain After Q3 Results
U.S. stocks traded lower toward the end of trading, with the Dow Jones index falling by more than 100 points on Wednesday.
The Dow traded down 0.27% to 43,153.13 while the NASDAQ fell 0.88% to 18,820.86. The S&P 500 also fell, dropping, 0.63% to 5,879.70.
Check This Out: Jim Cramer Likes Devon Energy, But Calls Another Stock ‘Far Superior‘
Leading and Lagging Sectors
Health care shares rose by 0.7% on Wednesday.
In trading on Wednesday, consumer discretionary shares fell by 1.2%.
Top Headline
The EIA said crude oil inventories in the U.S. increased by 0.545 million barrels in the week ended Nov. 15, compared to market estimates of a 0.4 million gain.
Equities Trading UP
- Quantum-Si incorporated QSI shares shot up 120% to $1.3941 after the company announced a distribution agreement with Avantor for next-generation protein sequencing portfolios for researchers.
- Shares of Williams-Sonoma, Inc. WSM got a boost, surging 28% to $175.78 after the company reported better-than-expected third-quarter financial results.
- Forte Biosciences, Inc. FBRX shares were also up, gaining 124% to $12.57 after the company secured $53 million in oversubscribed private placement to advance FB102 clinical programs across autoimmune indications, with key data readouts expected in 2025.
Equities Trading DOWN
- X3 Holdings Co., Ltd. XTKG shares dropped 38% to $1.0299. The company announced a 1-for-20 reverse stock split.
- Shares of PainReform Ltd. PRFX were down 27% to $1.0299 after the company announced initial topline data for PRF-110 Phase 3 clinical trial.
- Volato Group, Inc. SOAR was down, falling 24% to $0.3580. Volato reported $40.3 million in revenue and confirmed NYSE acceptance of compliance plan in third quarter 10-Q.
Commodities
In commodity news, oil traded down 0.4% to $69.10 while gold traded up 0.9% at $2,655.40.
Silver traded down 0.4% to $31.130 on Wednesday, while copper rose 0.3% to $4.1560.
Euro zone
European shares closed lower today. The eurozone’s STOXX 600 fell 0.02%, Germany’s DAX declined 0.29% and France’s CAC 40 fell 0.43%. Spain’s IBEX 35 Index rose 0.01%, while London’s FTSE 100 fell 0.17%.
Construction output in the Eurozone fell by 1.6% year-over-year in September compared to a 2.5% decline in the previous month. Producer prices in Germany fell by 1.1% year-over-year in October.
UK’s producer prices declined by 0.8% year-over-year in October versus a revised 0.6% fall in September. Annual inflation rate in the UK rose to 2.3% in October from 1.7% in September.
Asia Pacific Markets
Asian markets closed mostly higher on Wednesday, with Japan’s Nikkei 225 falling 0.16%, Hong Kong’s Hang Seng Index gaining 0.21% and China’s Shanghai Composite Index gaining 0.66%.
Japan’s trade deficit shrank to JPY 461.25 billion in October compared to JPY 702.86 in the year-ago month.
Economics
- Mortgage applications in the U.S. rose 1.7% from the previous week in the week ending Nov. 15, compared to a 0.5% gain in the prior period.
- The EIA said crude oil inventories in the U.S. increased by 0.545 million barrels in the week ended Nov. 15, compared to market estimates of a 0.4 million gain.
Now Read This:
Market News and Data brought to you by Benzinga APIs
© 2024 Benzinga.com. Benzinga does not provide investment advice. All rights reserved.
Lockheed Martin Unusual Options Activity For November 20
High-rolling investors have positioned themselves bearish on Lockheed Martin LMT, and it’s important for retail traders to take note.
This activity came to our attention today through Benzinga’s tracking of publicly available options data. The identities of these investors are uncertain, but such a significant move in LMT often signals that someone has privileged information.
Today, Benzinga’s options scanner spotted 8 options trades for Lockheed Martin. This is not a typical pattern.
The sentiment among these major traders is split, with 25% bullish and 62% bearish. Among all the options we identified, there was one put, amounting to $29,905, and 7 calls, totaling $237,179.
Predicted Price Range
After evaluating the trading volumes and Open Interest, it’s evident that the major market movers are focusing on a price band between $500.0 and $800.0 for Lockheed Martin, spanning the last three months.
Analyzing Volume & Open Interest
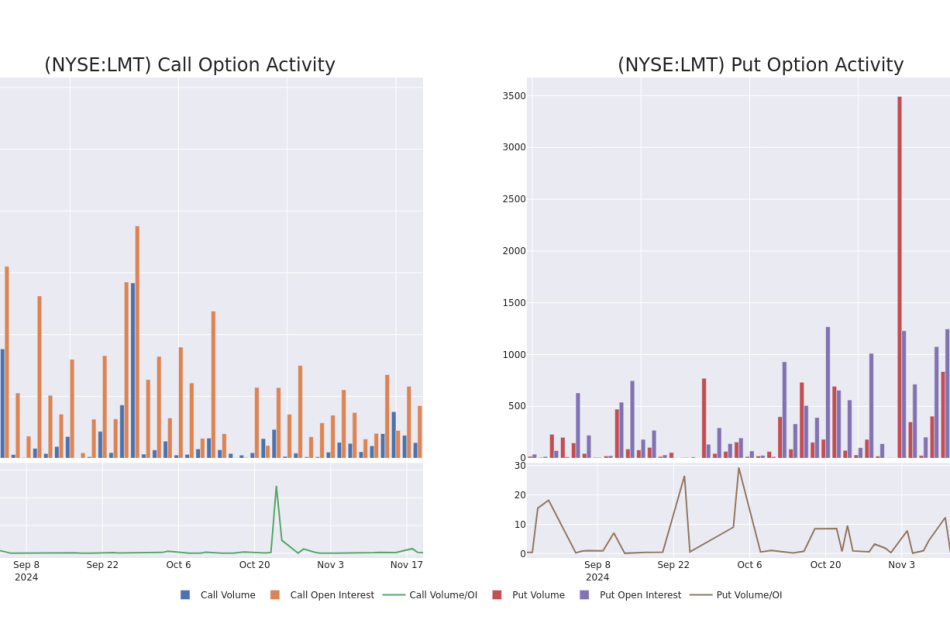
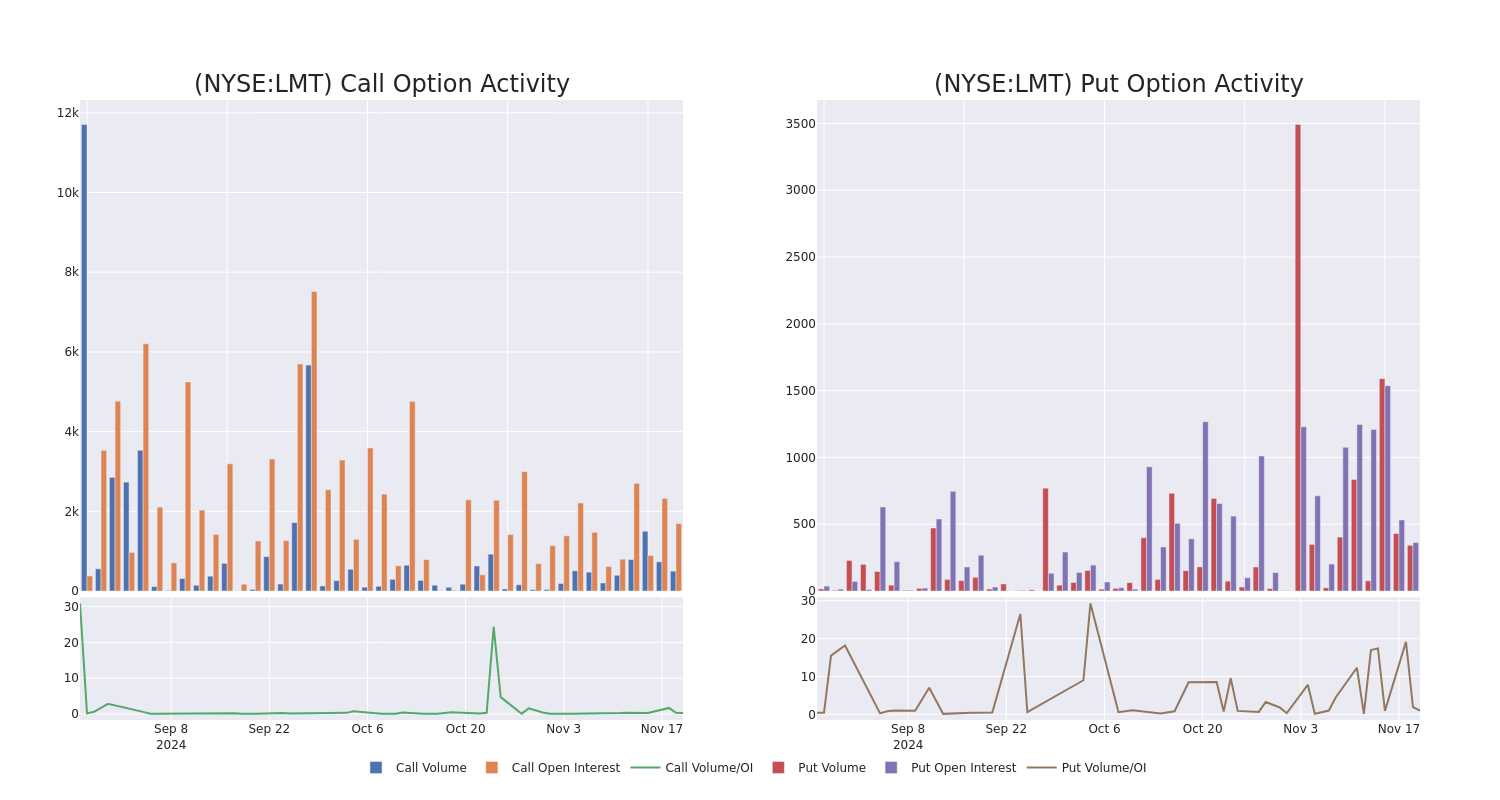
Examining the volume and open interest provides crucial insights into stock research. This information is key in gauging liquidity and interest levels for Lockheed Martin’s options at certain strike prices. Below, we present a snapshot of the trends in volume and open interest for calls and puts across Lockheed Martin’s significant trades, within a strike price range of $500.0 to $800.0, over the past month.
Lockheed Martin 30-Day Option Volume & Interest Snapshot
Biggest Options Spotted:
| Symbol | PUT/CALL | Trade Type | Sentiment | Exp. Date | Ask | Bid | Price | Strike Price | Total Trade Price | Open Interest | Volume |
|---|---|---|---|---|---|---|---|---|---|---|---|
| LMT | CALL | SWEEP | BEARISH | 11/29/24 | $2.8 | $2.45 | $2.8 | $542.50 | $42.0K | 12 | 152 |
| LMT | CALL | TRADE | BEARISH | 01/17/25 | $22.1 | $21.3 | $21.4 | $525.00 | $38.5K | 5 | 20 |
| LMT | CALL | SWEEP | BEARISH | 01/17/25 | $38.2 | $37.6 | $37.6 | $500.00 | $37.6K | 380 | 10 |
| LMT | CALL | TRADE | BEARISH | 01/17/25 | $38.6 | $37.3 | $37.8 | $500.00 | $34.0K | 380 | 20 |
| LMT | CALL | SWEEP | BULLISH | 01/17/25 | $30.1 | $29.4 | $30.02 | $510.00 | $30.0K | 597 | 11 |
About Lockheed Martin
Lockheed Martin is the world’s largest defense contractor and has dominated the Western market for high-end fighter aircraft since it won the F-35 Joint Strike Fighter program in 2001. Lockheed’s largest segment is aeronautics, which derives upward of two-thirds of its revenue from the F-35. Lockheed’s remaining segments are rotary and mission systems, mainly encompassing the Sikorsky helicopter business; missiles and fire control, which creates missiles and missile defense systems; and space systems, which produces satellites and receives equity income from the United Launch Alliance joint venture.
In light of the recent options history for Lockheed Martin, it’s now appropriate to focus on the company itself. We aim to explore its current performance.
Lockheed Martin’s Current Market Status
- With a volume of 461,035, the price of LMT is up 1.21% at $539.71.
- RSI indicators hint that the underlying stock may be oversold.
- Next earnings are expected to be released in 62 days.
What The Experts Say On Lockheed Martin
In the last month, 5 experts released ratings on this stock with an average target price of $627.6.
Unusual Options Activity Detected: Smart Money on the Move
Benzinga Edge’s Unusual Options board spots potential market movers before they happen. See what positions big money is taking on your favorite stocks. Click here for access.
* An analyst from Barclays persists with their Equal-Weight rating on Lockheed Martin, maintaining a target price of $565.
* An analyst from TD Cowen persists with their Buy rating on Lockheed Martin, maintaining a target price of $610.
* Maintaining their stance, an analyst from Susquehanna continues to hold a Positive rating for Lockheed Martin, targeting a price of $695.
* An analyst from UBS persists with their Neutral rating on Lockheed Martin, maintaining a target price of $603.
* Consistent in their evaluation, an analyst from RBC Capital keeps a Outperform rating on Lockheed Martin with a target price of $665.
Options are a riskier asset compared to just trading the stock, but they have higher profit potential. Serious options traders manage this risk by educating themselves daily, scaling in and out of trades, following more than one indicator, and following the markets closely.
If you want to stay updated on the latest options trades for Lockheed Martin, Benzinga Pro gives you real-time options trades alerts.
Market News and Data brought to you by Benzinga APIs
© 2024 Benzinga.com. Benzinga does not provide investment advice. All rights reserved.
What's Next: Gap's Earnings Preview
Gap GAP is set to give its latest quarterly earnings report on Thursday, 2024-11-21. Here’s what investors need to know before the announcement.
Analysts estimate that Gap will report an earnings per share (EPS) of $0.58.
Gap bulls will hope to hear the company announce they’ve not only beaten that estimate, but also to provide positive guidance, or forecasted growth, for the next quarter.
New investors should note that it is sometimes not an earnings beat or miss that most affects the price of a stock, but the guidance (or forecast).
Performance in Previous Earnings
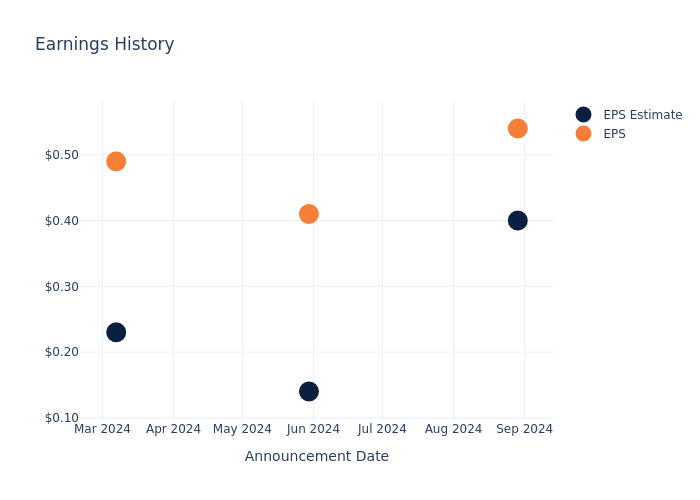
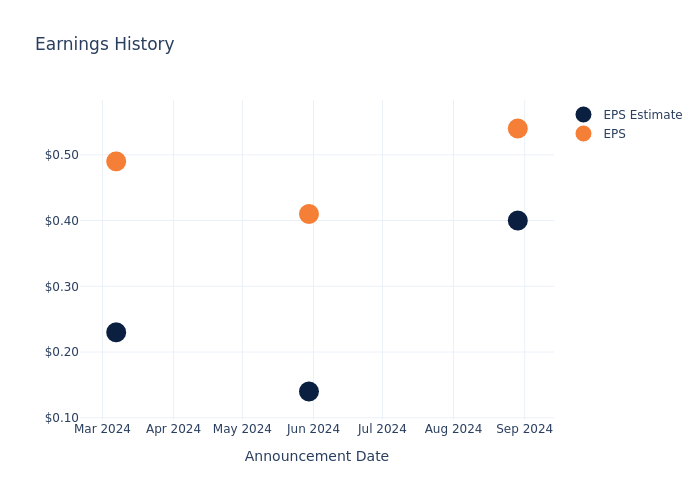
During the last quarter, the company reported an EPS beat by $0.14, leading to a 1.62% drop in the share price on the subsequent day.
Here’s a look at Gap’s past performance and the resulting price change:
| Quarter | Q2 2024 | Q1 2024 | Q4 2023 | Q3 2023 |
|---|---|---|---|---|
| EPS Estimate | 0.40 | 0.14 | 0.23 | 0.18 |
| EPS Actual | 0.54 | 0.41 | 0.49 | 0.59 |
| Price Change % | -2.0% | 28.999999999999996% | 8.0% | 31.0% |
Stock Performance
Shares of Gap were trading at $21.0 as of November 19. Over the last 52-week period, shares are up 8.72%. Given that these returns are generally positive, long-term shareholders are likely bullish going into this earnings release.
Analyst Views on Gap
For investors, staying informed about market sentiments and expectations in the industry is paramount. This analysis provides an exploration of the latest insights on Gap.
The consensus rating for Gap is Neutral, based on 6 analyst ratings. With an average one-year price target of $27.17, there’s a potential 29.38% upside.
Understanding Analyst Ratings Among Peers
The analysis below examines the analyst ratings and average 1-year price targets of Abercrombie & Fitch, Boot Barn Holdings and Urban Outfitters, three significant industry players, providing valuable insights into their relative performance expectations and market positioning.
- The consensus among analysts is an Neutral trajectory for Abercrombie & Fitch, with an average 1-year price target of $185.62, indicating a potential 783.9% upside.
- The consensus among analysts is an Buy trajectory for Boot Barn Holdings, with an average 1-year price target of $171.56, indicating a potential 716.95% upside.
- Urban Outfitters received a Neutral consensus from analysts, with an average 1-year price target of $41.0, implying a potential 95.24% upside.
Peers Comparative Analysis Summary
The peer analysis summary presents essential metrics for Abercrombie & Fitch, Boot Barn Holdings and Urban Outfitters, unveiling their respective standings within the industry and providing valuable insights into their market positions and comparative performance.
| Company | Consensus | Revenue Growth | Gross Profit | Return on Equity |
|---|---|---|---|---|
| Gap | Neutral | 4.85% | $1.58B | 7.35% |
| Abercrombie & Fitch | Neutral | 21.24% | $736.26M | 11.65% |
| Boot Barn Holdings | Buy | 13.71% | $152.86M | 2.94% |
| Urban Outfitters | Neutral | 6.27% | $493.29M | 5.34% |
Key Takeaway:
Gap is positioned in the middle among its peers for revenue growth. It ranks at the bottom for gross profit. In terms of return on equity, Gap is also placed in the middle.
Delving into Gap’s Background
Gap retails apparel, accessories, and personal-care products under the Gap, Old Navy, Banana Republic, and Athleta brands. Old Navy generates more than half of Gap’s sales. The firm also operates e-commerce sites, outlet stores, and specialty stores under various Gap names. Gap operates approximately 2,500 stores in North America, Europe, and Asia and franchises about 1,000 more in Asia, Europe, Latin America, and other regions. Gap was founded in 1969 and is based in San Francisco.
A Deep Dive into Gap’s Financials
Market Capitalization: With restricted market capitalization, the company is positioned below industry averages. This reflects a smaller scale relative to peers.
Revenue Growth: Over the 3 months period, Gap showcased positive performance, achieving a revenue growth rate of 4.85% as of 31 July, 2024. This reflects a substantial increase in the company’s top-line earnings. In comparison to its industry peers, the company stands out with a growth rate higher than the average among peers in the Consumer Discretionary sector.
Net Margin: Gap’s net margin excels beyond industry benchmarks, reaching 5.54%. This signifies efficient cost management and strong financial health.
Return on Equity (ROE): Gap’s ROE surpasses industry standards, highlighting the company’s exceptional financial performance. With an impressive 7.35% ROE, the company effectively utilizes shareholder equity capital.
Return on Assets (ROA): The company’s ROA is a standout performer, exceeding industry averages. With an impressive ROA of 1.84%, the company showcases effective utilization of assets.
Debt Management: The company faces challenges in debt management with a debt-to-equity ratio higher than the industry average. With a ratio of 1.88, caution is advised due to increased financial risk.
To track all earnings releases for Gap visit their earnings calendar on our site.
This article was generated by Benzinga’s automated content engine and reviewed by an editor.
© 2024 Benzinga.com. Benzinga does not provide investment advice. All rights reserved.
Behind the Scenes of Best Buy Co's Latest Options Trends
Investors with a lot of money to spend have taken a bullish stance on Best Buy Co BBY.
And retail traders should know.
We noticed this today when the trades showed up on publicly available options history that we track here at Benzinga.
Whether this is an institution or just a wealthy individual, we don’t know. But when something this big happens with BBY, it often means somebody knows something is about to happen.
Today, Benzinga’s options scanner spotted 14 options trades for Best Buy Co.
This isn’t normal.
The overall sentiment of these big-money traders is split between 50% bullish and 28%, bearish.
Out of all of the options we uncovered, 13 are puts, for a total amount of $723,146, and there was 1 call, for a total amount of $62,100.
Projected Price Targets
Based on the trading activity, it appears that the significant investors are aiming for a price territory stretching from $85.0 to $90.0 for Best Buy Co over the recent three months.
Volume & Open Interest Development
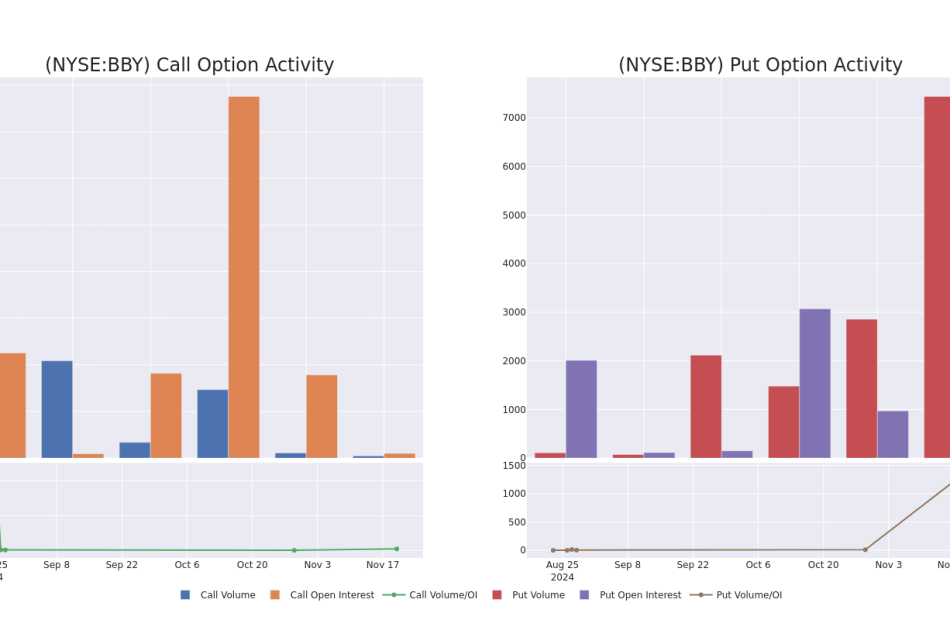
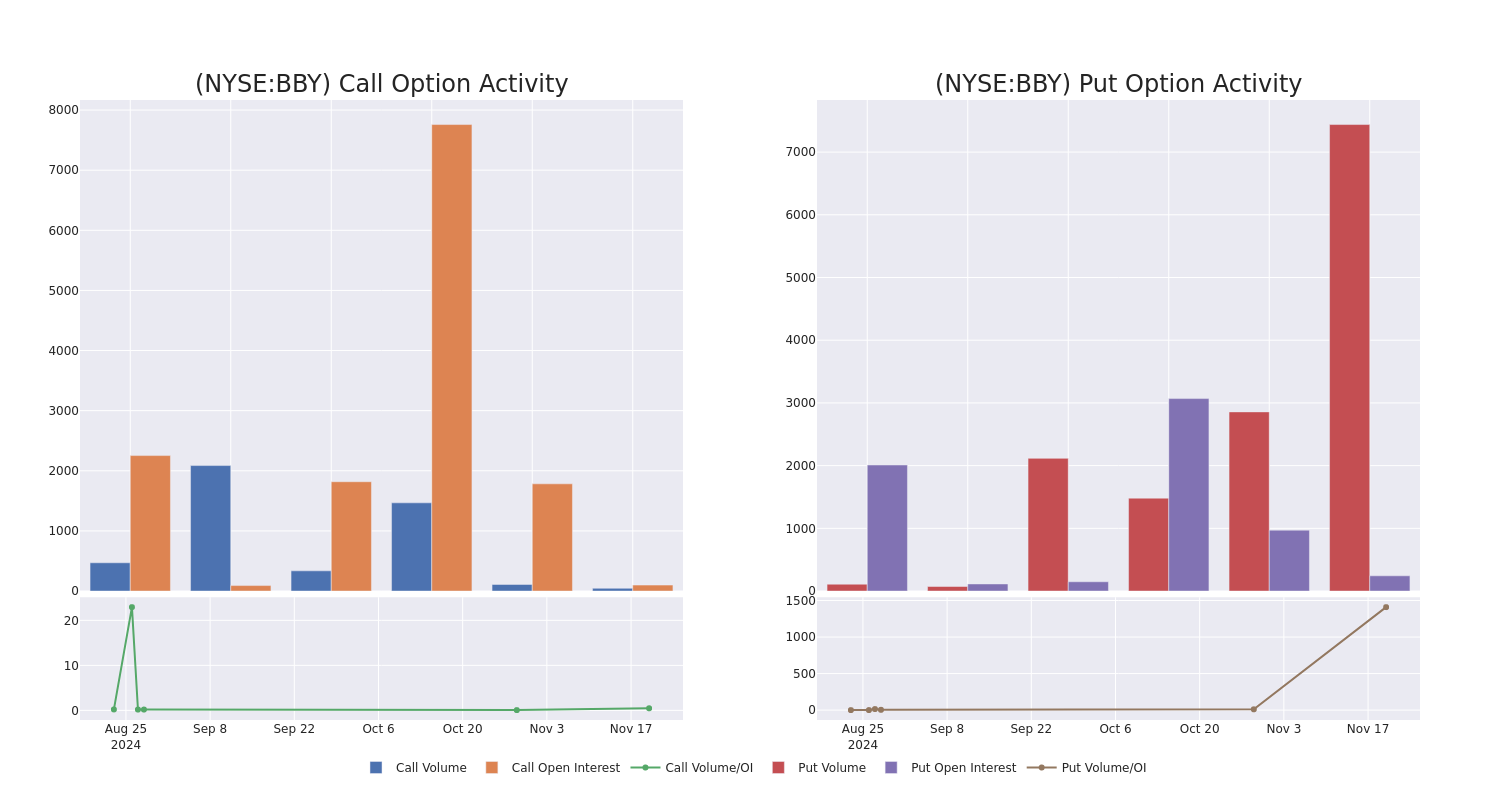
Looking at the volume and open interest is a powerful move while trading options. This data can help you track the liquidity and interest for Best Buy Co’s options for a given strike price. Below, we can observe the evolution of the volume and open interest of calls and puts, respectively, for all of Best Buy Co’s whale trades within a strike price range from $85.0 to $90.0 in the last 30 days.
Best Buy Co 30-Day Option Volume & Interest Snapshot
Largest Options Trades Observed:
| Symbol | PUT/CALL | Trade Type | Sentiment | Exp. Date | Ask | Bid | Price | Strike Price | Total Trade Price | Open Interest | Volume |
|---|---|---|---|---|---|---|---|---|---|---|---|
| BBY | PUT | SWEEP | BEARISH | 11/29/24 | $3.15 | $2.89 | $2.9 | $85.00 | $115.6K | 238 | 399 |
| BBY | PUT | SWEEP | NEUTRAL | 01/15/27 | $17.05 | $17.0 | $17.03 | $90.00 | $90.3K | 5 | 671 |
| BBY | PUT | SWEEP | BEARISH | 01/15/27 | $17.05 | $16.85 | $16.98 | $90.00 | $74.7K | 5 | 767 |
| BBY | PUT | SWEEP | BULLISH | 01/15/27 | $17.05 | $17.0 | $16.99 | $90.00 | $71.4K | 5 | 723 |
| BBY | CALL | TRADE | BULLISH | 12/18/26 | $13.5 | $13.5 | $13.5 | $90.00 | $62.1K | 99 | 46 |
About Best Buy Co
With $43.5 billion in consolidated 2023 sales, Best Buy is the largest pure-play consumer electronics retailer in the US, boasting roughly 8.3% share of the North American market and north of 33% share of offline sales in the region, per our calculations, CTA, and Euromonitor data. The firm generates the bulk of its sales in-store, with mobile phones and tablets, computers, and appliances representing its three largest categories. Recent investments in e-commerce fulfillment, accelerated by the covid-19 pandemic, have seen the US e-commerce channel roughly double from prepandemic levels, with management estimating that it will represent a mid-30% proportion of sales moving forward.
Following our analysis of the options activities associated with Best Buy Co, we pivot to a closer look at the company’s own performance.
Current Position of Best Buy Co
- With a volume of 1,775,641, the price of BBY is down -1.28% at $85.91.
- RSI indicators hint that the underlying stock may be approaching oversold.
- Next earnings are expected to be released in 6 days.
Expert Opinions on Best Buy Co
In the last month, 1 experts released ratings on this stock with an average target price of $109.0.
Unusual Options Activity Detected: Smart Money on the Move
Benzinga Edge’s Unusual Options board spots potential market movers before they happen. See what positions big money is taking on your favorite stocks. Click here for access.
* An analyst from Citigroup has decided to maintain their Buy rating on Best Buy Co, which currently sits at a price target of $109.
Options are a riskier asset compared to just trading the stock, but they have higher profit potential. Serious options traders manage this risk by educating themselves daily, scaling in and out of trades, following more than one indicator, and following the markets closely.
If you want to stay updated on the latest options trades for Best Buy Co, Benzinga Pro gives you real-time options trades alerts.
Market News and Data brought to you by Benzinga APIs
© 2024 Benzinga.com. Benzinga does not provide investment advice. All rights reserved.
Insights into Shoe Carnival's Upcoming Earnings
Shoe Carnival SCVL is gearing up to announce its quarterly earnings on Thursday, 2024-11-21. Here’s a quick overview of what investors should know before the release.
Analysts are estimating that Shoe Carnival will report an earnings per share (EPS) of $0.65.
Anticipation surrounds Shoe Carnival’s announcement, with investors hoping to hear about both surpassing estimates and receiving positive guidance for the next quarter.
New investors should understand that while earnings performance is important, market reactions are often driven by guidance.
Historical Earnings Performance
In the previous earnings release, the company missed EPS by $0.00, leading to a 1.13% drop in the share price the following trading session.
Here’s a look at Shoe Carnival’s past performance and the resulting price change:
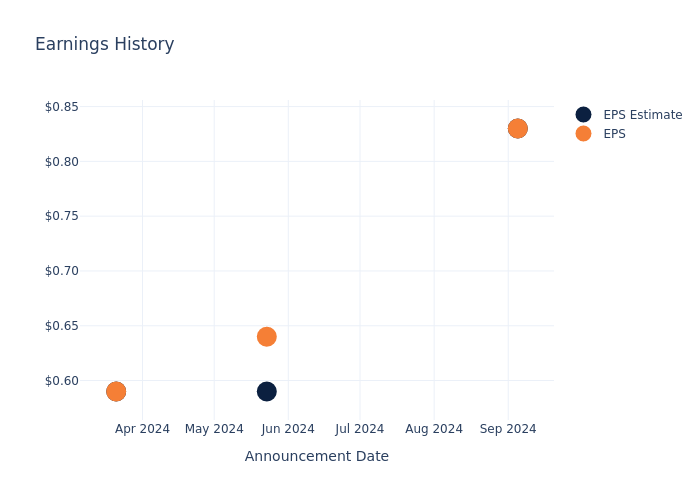
| Quarter | Q2 2024 | Q1 2024 | Q4 2023 | Q3 2023 |
|---|---|---|---|---|
| EPS Estimate | 0.83 | 0.59 | 0.59 | 1.01 |
| EPS Actual | 0.83 | 0.64 | 0.59 | 0.80 |
| Price Change % | -1.0% | 2.0% | 2.0% | 8.0% |
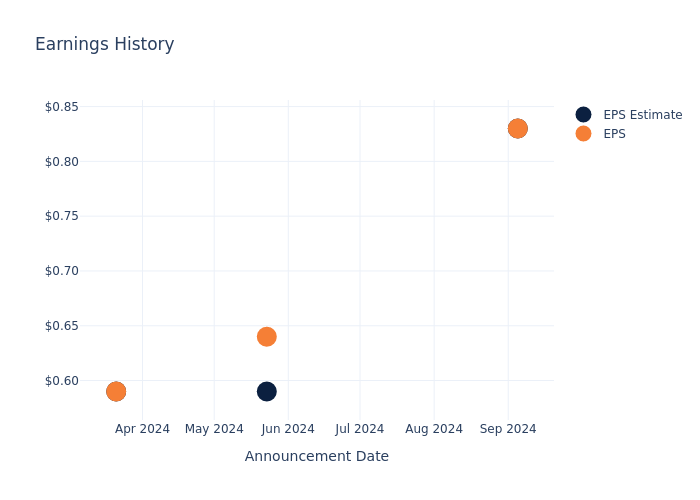
Performance of Shoe Carnival Shares
Shares of Shoe Carnival were trading at $33.67 as of November 19. Over the last 52-week period, shares are up 42.29%. Given that these returns are generally positive, long-term shareholders are likely bullish going into this earnings release.
Analyst Opinions on Shoe Carnival
For investors, staying informed about market sentiments and expectations in the industry is paramount. This analysis provides an exploration of the latest insights on Shoe Carnival.
With 1 analyst ratings, Shoe Carnival has a consensus rating of Buy. The average one-year price target is $51.0, indicating a potential 51.47% upside.
Peer Ratings Comparison
The analysis below examines the analyst ratings and average 1-year price targets of Guess and Caleres, three significant industry players, providing valuable insights into their relative performance expectations and market positioning.
- Guess is maintaining an Buy status according to analysts, with an average 1-year price target of $28.0, indicating a potential 16.84% downside.
- Analysts currently favor an Neutral trajectory for Caleres, with an average 1-year price target of $37.5, suggesting a potential 11.38% upside.
Summary of Peers Analysis
The peer analysis summary outlines pivotal metrics for Guess and Caleres, demonstrating their respective standings within the industry and offering valuable insights into their market positions and comparative performance.
| Company | Consensus | Revenue Growth | Gross Profit | Return on Equity |
|---|---|---|---|---|
| Shoe Carnival | Buy | 12.93% | $119.94M | 3.71% |
| Guess | Buy | 10.24% | $319.94M | -2.04% |
| Caleres | Neutral | -1.76% | $310.88M | 4.91% |
Key Takeaway:
Shoe Carnival ranks highest in revenue growth among its peers. It has the lowest gross profit margin. Its return on equity is in the middle compared to its peers.
All You Need to Know About Shoe Carnival
Shoe Carnival Inc is a family footwear retailer that offers a broad assortment of dress, casual and athletic footwear for men, women, and children with an emphasis on national name brands such as Nike, Skechers, Adidas, Puma, HEYDUDE, Converse, Vans, and Crocs. They operate their business as one reportable segment based on the similar nature of products sold; merchandising, distribution, and marketing processes involved; target customers; and economic characteristics of our stores and e-commerce platforms. Its bricks-first, omnichannel approach provides customers easy access to a wide assortment of branded footwear for work, athletics, daily activities, and special events via a choice of delivery channel.
Shoe Carnival’s Economic Impact: An Analysis
Market Capitalization: Indicating a reduced size compared to industry averages, the company’s market capitalization poses unique challenges.
Revenue Growth: Shoe Carnival’s revenue growth over a period of 3 months has been noteworthy. As of 31 July, 2024, the company achieved a revenue growth rate of approximately 12.93%. This indicates a substantial increase in the company’s top-line earnings. As compared to competitors, the company surpassed expectations with a growth rate higher than the average among peers in the Consumer Discretionary sector.
Net Margin: Shoe Carnival’s net margin surpasses industry standards, highlighting the company’s exceptional financial performance. With an impressive 6.78% net margin, the company effectively manages costs and achieves strong profitability.
Return on Equity (ROE): Shoe Carnival’s ROE stands out, surpassing industry averages. With an impressive ROE of 3.71%, the company demonstrates effective use of equity capital and strong financial performance.
Return on Assets (ROA): The company’s ROA is a standout performer, exceeding industry averages. With an impressive ROA of 2.04%, the company showcases effective utilization of assets.
Debt Management: The company maintains a balanced debt approach with a debt-to-equity ratio below industry norms, standing at 0.58.
To track all earnings releases for Shoe Carnival visit their earnings calendar on our site.
This article was generated by Benzinga’s automated content engine and reviewed by an editor.
© 2024 Benzinga.com. Benzinga does not provide investment advice. All rights reserved.
Sam Altman-Backed Oklo Slumps After Kerrisdale Says It’s Shorting Stock
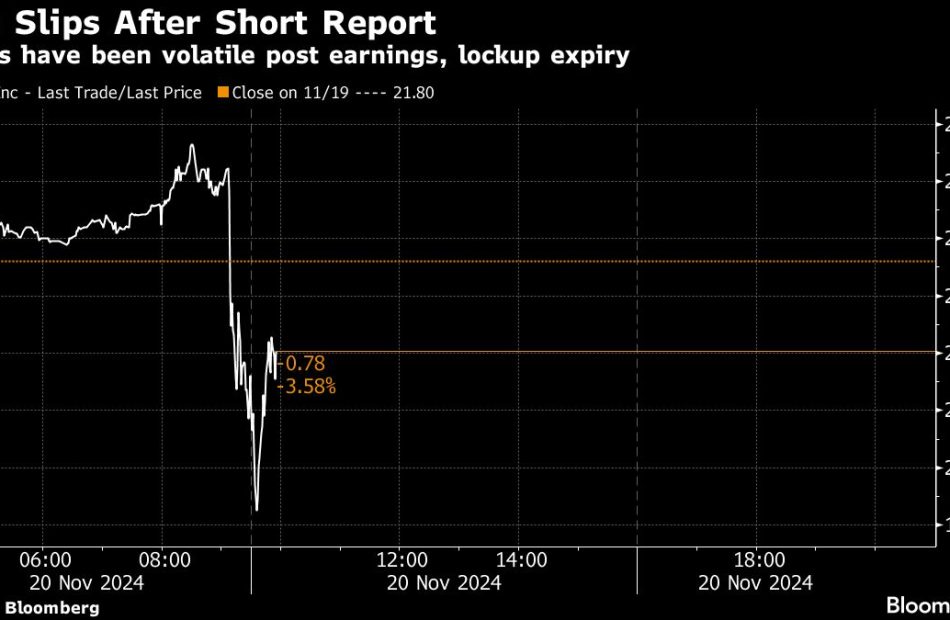
(Bloomberg) — Shares of Oklo Inc., the nuclear fission reactor company backed by OpenAI Inc’s Sam Altman, tumbled Wednesday after Kerrisdale Capital said it is shorting the stock.
Most Read from Bloomberg
The report alleges that “virtually every aspect of Oklo’s investment case warrants skepticism,” sending the stock down as much as 10%. Shares pared much of the decline and were down about 6% in midday trading in New York.
Oklo shares have whip-sawed recently, rallying more than 20% this week through Tuesday’s close after falling 25% on Friday following its earnings release and the expiration of a lockup period that allows key investors like Peter Thiel’s venture capital firm to start selling shares.
Oklo declined to comment.
Since the company went public via a special purpose acquisition merger in May, its shares have soared more than 150%.
“In classic SPAC fashion, Oklo has sold the market on inflated unit economics while grossly underestimating the time and capital it will take to commercialize its product,” the Kerrisdale report said.
The company is among a wave of firms developing so-called small modular reactors that are expected to be built in factories and assembled on site. Advocates say the approach will make it faster and cheaper to build nuclear power plants, but the technology is unproven. Only a handful have been developed, and only in Russia and China.
Oklo has said it expects its first system to go into service in 2027, but the Kerrisdale report highlights numerous technical and regulatory hurdles that may delay that schedule. Oklo is pursuing a new technology that it said will make its design safer and cheaper than conventional reactors in use today. The company’s design doesn’t have approval from the US Nuclear Regulatory Commission, a process that typically takes years.
Wall Street is split on the company thus far. Of the four analysts covering Oklo, two have buy-equivalent ratings and two are neutral. The average price target implies about 5% return from where shares are trading.
Besides Altman and Thiel, the company has another potentially high-profile connection. Board member Chris Wright was nominated by President-elect Donald Trump to lead the Energy Department last week.
(Updates stock move and adds company comment.)
Herbert Hughes Takes Money Off The Table, Sells $100K In Byrna Technologies Stock
On November 20, a recent SEC filing unveiled that Herbert Hughes, Board Member at Byrna Technologies BYRN made an insider sell.
What Happened: Hughes’s recent move involves selling 5,000 shares of Byrna Technologies. This information is documented in a Form 4 filing with the U.S. Securities and Exchange Commission on Wednesday. The total value is $100,376.
During Wednesday’s morning session, Byrna Technologies shares up by 0.19%, currently priced at $21.38.
Delving into Byrna Technologies’s Background
Byrna Technologies Inc is a designer, manufacturer, retailer and distributor of technological solutions for security situations that do not require the use of lethal force. The company generates its revenue from the United States, South Africa, Europe, South America, Asia and Canada.
Byrna Technologies: Delving into Financials
Revenue Growth: Over the 3 months period, Byrna Technologies showcased positive performance, achieving a revenue growth rate of 194.34% as of 31 August, 2024. This reflects a substantial increase in the company’s top-line earnings. When compared to others in the Industrials sector, the company excelled with a growth rate higher than the average among peers.
Holistic Profitability Examination:
-
Gross Margin: The company excels with a remarkable gross margin of 62.4%, indicating superior cost efficiency and profitability compared to its industry peers.
-
Earnings per Share (EPS): Byrna Technologies’s EPS is below the industry average. The company faced challenges with a current EPS of 0.05. This suggests a potential decline in earnings.
Debt Management: Byrna Technologies’s debt-to-equity ratio is below industry norms, indicating a sound financial structure with a ratio of 0.06.
Understanding Financial Valuation:
-
Price to Earnings (P/E) Ratio: With a higher-than-average P/E ratio of 194.0, Byrna Technologies’s stock is perceived as being overvalued in the market.
-
Price to Sales (P/S) Ratio: A higher-than-average P/S ratio of 6.63 suggests overvaluation in the eyes of investors, considering sales performance.
-
EV/EBITDA Analysis (Enterprise Value to its Earnings Before Interest, Taxes, Depreciation & Amortization): A high EV/EBITDA ratio of 146.15 reflects market recognition of Byrna Technologies’s value, positioning it as more highly valued compared to industry peers.
Market Capitalization Perspectives: The company’s market capitalization falls below industry averages, signaling a relatively smaller size compared to peers. This positioning may be influenced by factors such as perceived growth potential or operational scale.
Now trade stocks online commission free with Charles Schwab, a trusted and complete investment firm.
The Importance of Insider Transactions
Insider transactions contribute to decision-making but should be supplemented by a comprehensive investment analysis.
Considering the legal perspective, an “insider” is defined as any officer, director, or beneficial owner holding more than ten percent of a company’s equity securities, according to Section 12 of the Securities Exchange Act of 1934. This includes executives in the c-suite and major hedge funds. These insiders are mandated to disclose their transactions through a Form 4 filing, to be submitted within two business days of the transaction.
Pointing towards optimism, a company insider’s new purchase signals their positive anticipation for the stock to rise.
Nevertheless, insider sells may not necessarily indicate a bearish view and can be influenced by various factors.
Important Transaction Codes
Delving into transactions, investors typically prioritize those unfolding in the open market, as precisely outlined in Table I of the Form 4 filing. A P in Box 3 indicates a purchase, while S signifies a sale. Transaction code C signals the conversion of an option, and transaction code A denotes a grant, award, or other acquisition of securities from the company.
Check Out The Full List Of Byrna Technologies’s Insider Trades.
Insider Buying Alert: Profit from C-Suite Moves
Benzinga Edge reveals every insider trade in real-time. Don’t miss the next big stock move driven by insider confidence. Unlock this ultimate sentiment indicator now. Click here for access.
This article was generated by Benzinga’s automated content engine and reviewed by an editor.
Market News and Data brought to you by Benzinga APIs
© 2024 Benzinga.com. Benzinga does not provide investment advice. All rights reserved.
Decoding Amgen's Options Activity: What's the Big Picture?
Financial giants have made a conspicuous bullish move on Amgen. Our analysis of options history for Amgen AMGN revealed 8 unusual trades.
Delving into the details, we found 37% of traders were bullish, while 37% showed bearish tendencies. Out of all the trades we spotted, 4 were puts, with a value of $172,165, and 4 were calls, valued at $144,495.
Projected Price Targets
After evaluating the trading volumes and Open Interest, it’s evident that the major market movers are focusing on a price band between $280.0 and $350.0 for Amgen, spanning the last three months.
Analyzing Volume & Open Interest
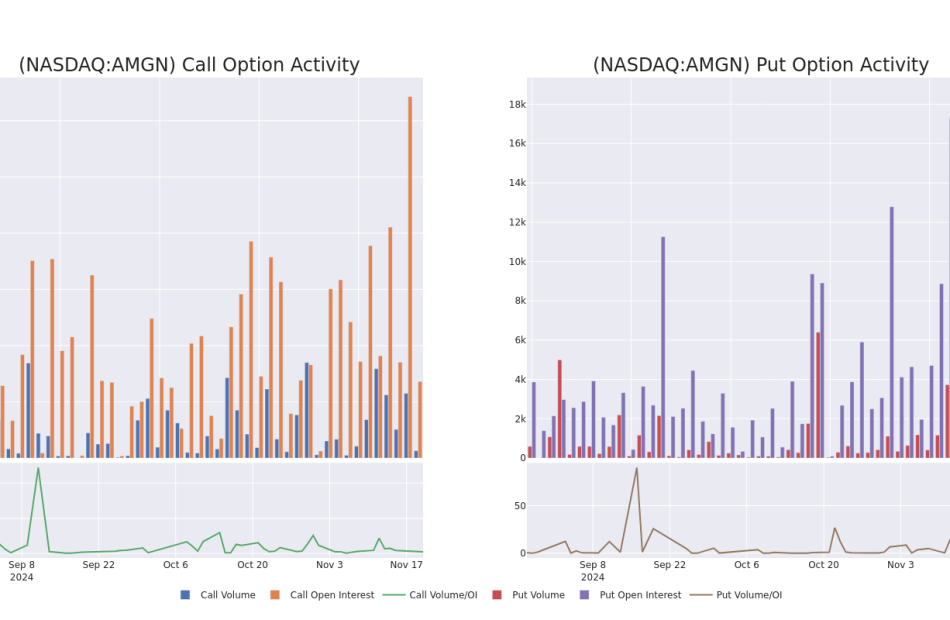
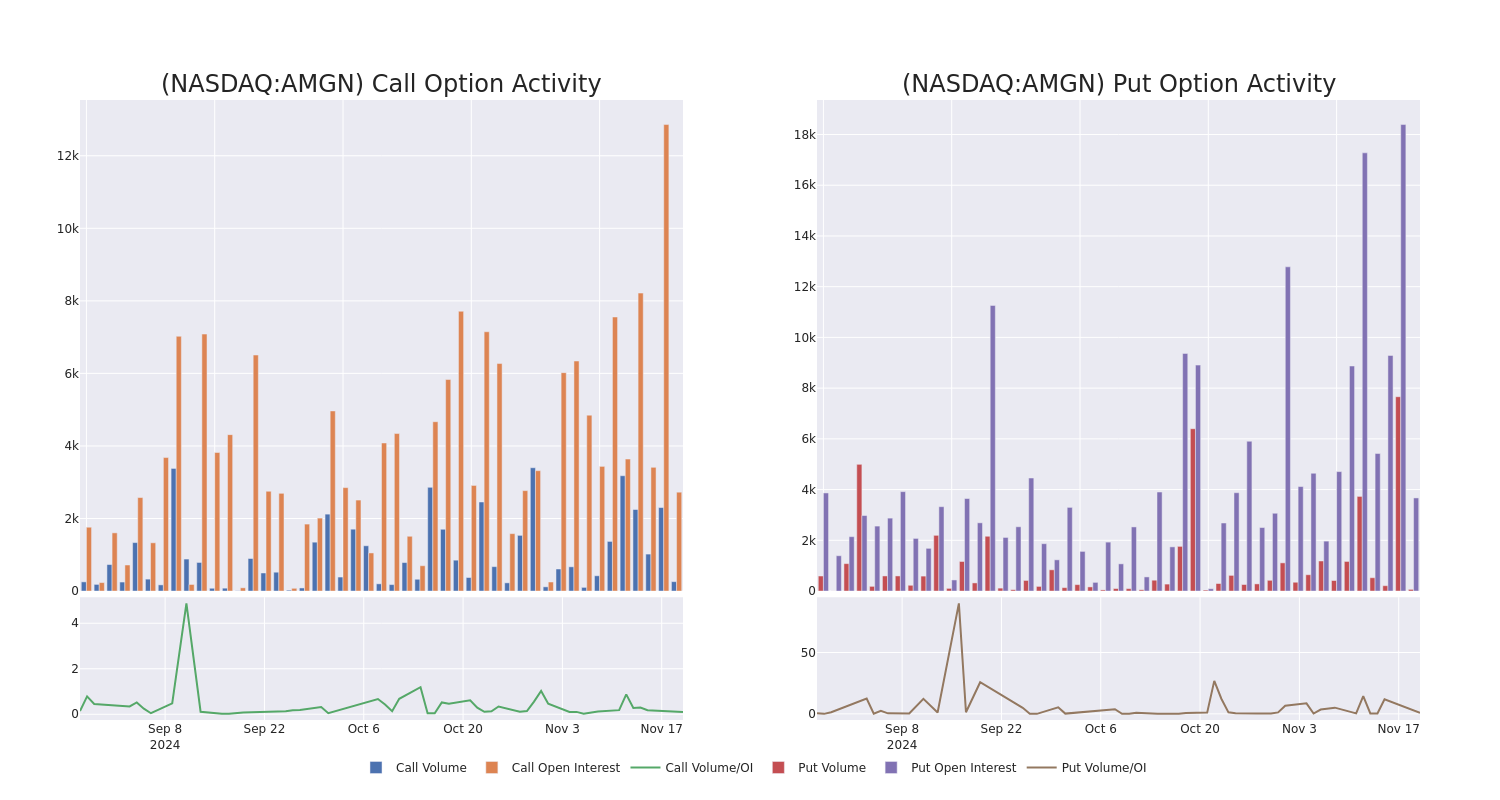
In today’s trading context, the average open interest for options of Amgen stands at 1066.0, with a total volume reaching 267.00. The accompanying chart delineates the progression of both call and put option volume and open interest for high-value trades in Amgen, situated within the strike price corridor from $280.0 to $350.0, throughout the last 30 days.
Amgen Option Volume And Open Interest Over Last 30 Days
Noteworthy Options Activity:
| Symbol | PUT/CALL | Trade Type | Sentiment | Exp. Date | Ask | Bid | Price | Strike Price | Total Trade Price | Open Interest | Volume |
|---|---|---|---|---|---|---|---|---|---|---|---|
| AMGN | PUT | TRADE | BULLISH | 12/20/24 | $22.0 | $21.4 | $21.55 | $292.50 | $60.3K | 70 | 51 |
| AMGN | PUT | SWEEP | BEARISH | 12/20/24 | $21.8 | $21.4 | $21.5 | $292.50 | $45.1K | 70 | 51 |
| AMGN | CALL | SWEEP | BEARISH | 12/20/24 | $18.0 | $17.4 | $17.44 | $282.50 | $43.7K | 703 | 113 |
| AMGN | CALL | SWEEP | BULLISH | 01/17/25 | $20.5 | $19.85 | $20.5 | $280.00 | $40.9K | 1.7K | 7 |
| AMGN | PUT | TRADE | NEUTRAL | 01/17/25 | $56.1 | $53.95 | $55.05 | $335.00 | $38.5K | 310 | 7 |
About Amgen
Amgen is a leader in biotechnology-based human therapeutics. Flagship drugs include red blood cell boosters Epogen and Aranesp, immune system boosters Neupogen and Neulasta, and Enbrel and Otezla for inflammatory diseases. Amgen introduced its first cancer therapeutic, Vectibix, in 2006 and markets bone-strengthening drug Prolia/Xgeva (approved 2010) and Evenity (2019). The acquisition of Onyx bolstered the firm’s therapeutic oncology portfolio with Kyprolis. Recent launches include Repatha (cholesterol-lowering), Aimovig (migraine), Lumakras (lung cancer), and Tezspire (asthma). The 2023 Horizon acquisition brings several rare-disease drugs, including thyroid eye disease drug Tepezza. Amgen also has a growing biosimilar portfolio.
Following our analysis of the options activities associated with Amgen, we pivot to a closer look at the company’s own performance.
Where Is Amgen Standing Right Now?
- With a trading volume of 2,464,150, the price of AMGN is up by 1.67%, reaching $284.63.
- Current RSI values indicate that the stock is may be approaching oversold.
- Next earnings report is scheduled for 76 days from now.
Unusual Options Activity Detected: Smart Money on the Move
Benzinga Edge’s Unusual Options board spots potential market movers before they happen. See what positions big money is taking on your favorite stocks. Click here for access.
Options trading presents higher risks and potential rewards. Astute traders manage these risks by continually educating themselves, adapting their strategies, monitoring multiple indicators, and keeping a close eye on market movements. Stay informed about the latest Amgen options trades with real-time alerts from Benzinga Pro.
Market News and Data brought to you by Benzinga APIs
© 2024 Benzinga.com. Benzinga does not provide investment advice. All rights reserved.
Nvidia Earnings Are Imminent; These Most Accurate Analysts Revise Forecasts Ahead Of Earnings Call
NVIDIA Corporation NVDA will release earnings results for its third quarter, after the closing bell on Wednesday, Nov. 20.
Analysts expect the Santa Clara, California-based bank to report quarterly earnings at 75 cents per share, up from 40 cents per share in the year-ago period. Nvidia projects to report revenue of $33.14 billion for the recent quarter, compared to $18.12 billion a year earlier, according to data from Benzinga Pro.
On Monday, Nvidia announced it partnered with Alphabet Inc GOOG GOOGL Google Quantum AI to accelerate the development of next-generation quantum computing devices.
Nvidia shares gained 3.8% to close at $145.41 on Tuesday.
Benzinga readers can access the latest analyst ratings on the Analyst Stock Ratings page. Readers can sort by stock ticker, company name, analyst firm, rating change or other variables.
Let’s have a look at how Benzinga’s most-accurate analysts have rated the company in the recent period.
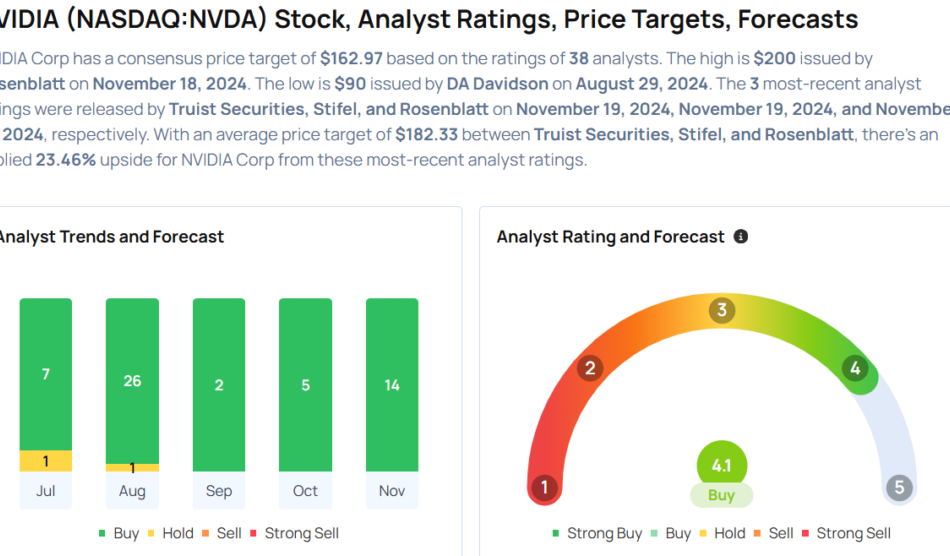
- Truist Securities analyst William Stein maintained a Buy rating and raised the price target from $148 to $167 on Nov. 19. This analyst has an accuracy rate of 87%.
- Stifel analyst Ruben Roy maintained a Buy rating and raised the price target from $165 to $180 on Nov. 19. This analyst has an accuracy rate of 86%.
- Wedbush analyst Matt Bryson maintained an Outperform rating and raised the price target from $138 to $160 on Nov. 14. This analyst has an accuracy rate of 82%.
- Raymond James analyst Srini Pajjuri maintained a Strong Buy rating and increased the price target from $140 to $170 on Nov. 14. This analyst has an accuracy rate of 80%.
- Susquehanna analyst Christopher Rolland maintained a Positive rating and boosted the price target from $160 to $180 on Nov. 14. This analyst has an accuracy rate of 72%.
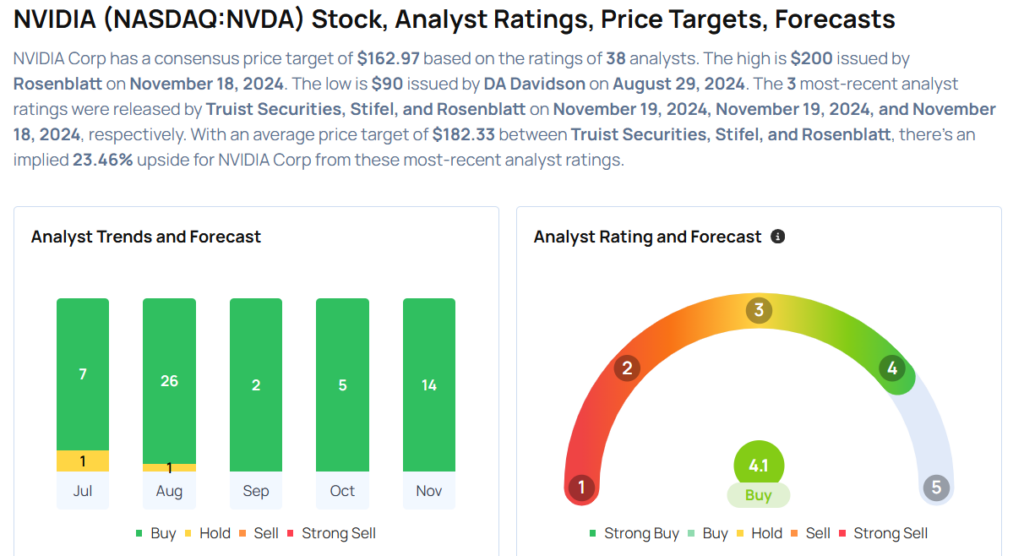
Considering buying NVDA stock? Here’s what analysts think:
Read This Next:
Market News and Data brought to you by Benzinga APIs
© 2024 Benzinga.com. Benzinga does not provide investment advice. All rights reserved.

