Natural Grocers By Vitamin Cottage, Elastic, Matthews International, Gap And Other Big Stocks Moving Higher On Friday
U.S. stocks were mixed, with the Dow Jones index gaining more than 150 points on Friday.
Shares of Natural Grocers by Vitamin Cottage, Inc. NGVC rose sharply during Friday’s session following quarterly results.
Natural Grocers reported quarterly earnings of 39 cents per share, representing a 50% increase over earnings of 26 cents per share from the same period last year. The company reported $322.66 million in sales this quarter.
Natural Grocers by Vitamin Cottage shares jumped 15.3% to $41.78 on Friday.
Here are some other big stocks recording gains in today’s session.
- Replimune Group, Inc. REPL shares jumped 41.5% to $15.64 after the company on Thursday announced it received breakthrough therapy designation status for RP1 and will submit an RP1 biologics license application to the FDA under an accelerated approval pathway.
- Omeros Corporation OMER shares surged 26.4% to $9.75.
- D-Wave Quantum Inc. QBTS jumped 20.6% to $2.3750 after the company issued expectations for quarter-over-quarter fourth-quarter revenue growth.
- Navitas Semiconductor Corporation NVTS gained 18.8% to $2.4000.
- Elastic N.V. ESTC gained 16.6% to $109.82 after the company reported better-than-expected second-quarter financial results and issued FY25 guidance above estimates.
- Matthews International Corporation MATW surged 16.6% to $29.74 following upbeat earnings.
- Wolfspeed, Inc. WOLF rose 16.2% to $7.48.
- Viasat, Inc. VSAT gained 14.3% to $9.52.
- Protagonist Therapeutics, Inc. PTGX jumped 12.3% to $46.81.
- Super Micro Computer, Inc. SMCI gained 10.7% to $32.90.
- SoundHound AI, Inc. SOUN shares rose 10.66% to $7.72.
- Polestar Automotive Holding UK PLC PSNY shares jumped 9.1% to $1.2000
- Atkore Inc. ATKR gained 8.6% to $92.44.
- The Gap, Inc. GAP jumped 6% to $23.35 following upbeat earnings.
- Carpenter Technology Corporation CRS gained 5.3% to $190.29 JP Morgan analyst Bennett Moore initiated coverage on Carpenter Tech with an Overweight rating and announced a price target of $220.
Now Read This:
Market News and Data brought to you by Benzinga APIs
© 2024 Benzinga.com. Benzinga does not provide investment advice. All rights reserved.
UPS to Pay $45 Million SEC Penalty Over Improper Valuation
(Bloomberg) — United Parcel Service Inc. will pay $45 million to settle claims by the US Securities and Exchange Commission that the courier misrepresented its financial results by improperly valuing its freight business.
Most Read from Bloomberg
The company failed to follow generally accepted accounting principles when it evaluated its less-than-truckload operations in 2019 and 2020, the SEC said Friday in a statement. “Had UPS properly valued Freight, its earnings and other reported items would have been materially lower,” the agency said.
UPS, which didn’t admit or deny the findings, agreed to avoid future violations, the SEC said.
The company said in an emailed statement that it recorded a non-cash goodwill impairment charge in 2020 relating to the investigation. “The settlement will not have a material effect on our business, financial condition, results of operation, or liquidity,” UPS said.
Goodwill is a non-cash asset companies record on their balance sheets when they buy another business and have to calculate how they came up with the purchase price. US accounting rules require companies to keep the asset as a line on their balance sheets, only marking it down when there’s a sign it has permanently lost value. Companies must test goodwill at least yearly for signs of it losing value.
The SEC’s order alleges that UPS used an outside consultant to value the freight business without providing certain information such as the company’s own internal analysis of the operations. UPS didn’t tell the consultant it had concluded that “a prospective buyer would expect Freight to generate significantly less profit after it was sold because it would no longer benefit from synergies and other cost savings it was getting as part of UPS,” according to the order.
UPS sold its freight business to TFI International in 2021 for $800 million.
Shares of UPS rose 1.9% as of 10:15 a.m. in New York.
–With assistance from Nicola M. White.
(Updates with company comment in fourth paragraph.)
Most Read from Bloomberg Businessweek
©2024 Bloomberg L.P.
Earnings Preview: Bath & Body Works
Bath & Body Works BBWI is gearing up to announce its quarterly earnings on Monday, 2024-11-25. Here’s a quick overview of what investors should know before the release.
Analysts are estimating that Bath & Body Works will report an earnings per share (EPS) of $0.47.
Anticipation surrounds Bath & Body Works’s announcement, with investors hoping to hear about both surpassing estimates and receiving positive guidance for the next quarter.
New investors should understand that while earnings performance is important, market reactions are often driven by guidance.
Past Earnings Performance
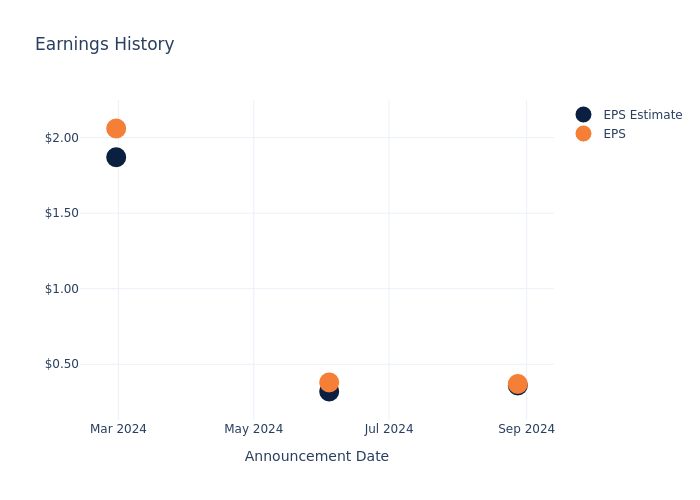
During the last quarter, the company reported an EPS beat by $0.01, leading to a 4.0% drop in the share price on the subsequent day.
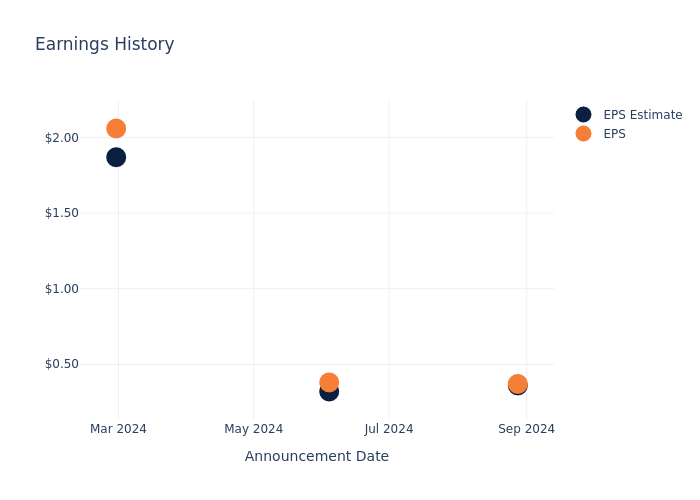
Here’s a look at Bath & Body Works’s past performance and the resulting price change:
| Quarter | Q2 2024 | Q1 2024 | Q4 2023 | Q3 2023 |
|---|---|---|---|---|
| EPS Estimate | 0.36 | 0.32 | 1.87 | 0.35 |
| EPS Actual | 0.37 | 0.38 | 2.06 | 0.48 |
| Price Change % | -4.0% | 5.0% | -0.0% | -2.0% |
Stock Performance
Shares of Bath & Body Works were trading at $30.55 as of November 21. Over the last 52-week period, shares are up 2.21%. Given that these returns are generally positive, long-term shareholders are likely bullish going into this earnings release.
To track all earnings releases for Bath & Body Works visit their earnings calendar on our site.
This article was generated by Benzinga’s automated content engine and reviewed by an editor.
Market News and Data brought to you by Benzinga APIs
© 2024 Benzinga.com. Benzinga does not provide investment advice. All rights reserved.
Price Over Earnings Overview: Dell Technologies
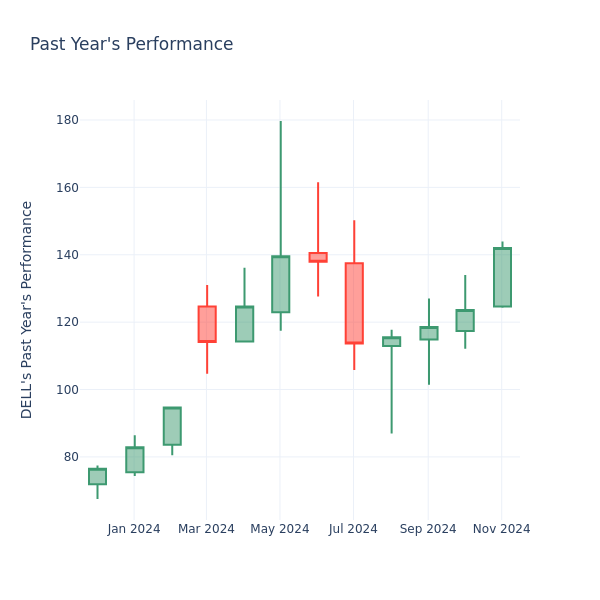
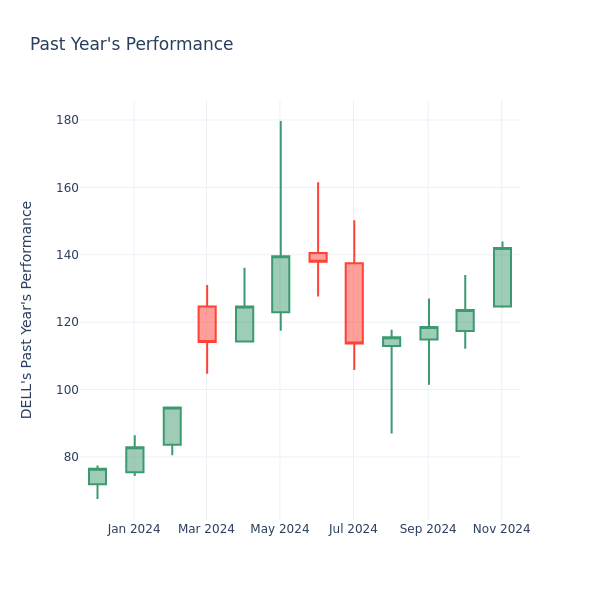
In the current session, the stock is trading at $142.32, after a 2.45% increase. Over the past month, Dell Technologies Inc. DELL stock increased by 15.96%, and in the past year, by 90.85%. With performance like this, long-term shareholders are optimistic but others are more likely to look into the price-to-earnings ratio to see if the stock might be overvalued.
A Look at Dell Technologies P/E Relative to Its Competitors
The P/E ratio is used by long-term shareholders to assess the company’s market performance against aggregate market data, historical earnings, and the industry at large. A lower P/E could indicate that shareholders do not expect the stock to perform better in the future or it could mean that the company is undervalued.
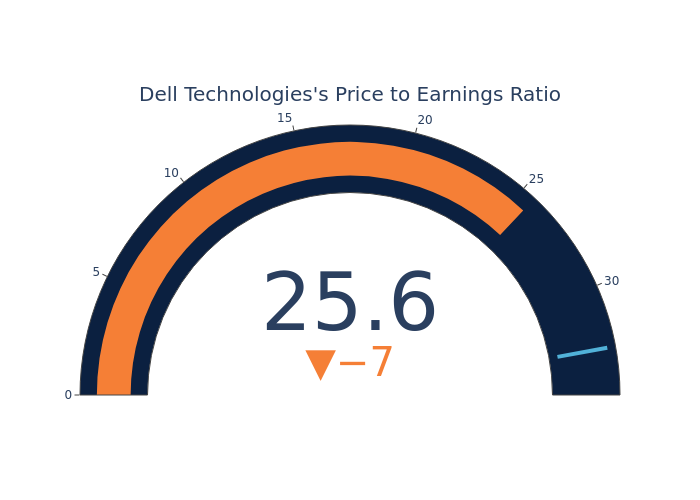
Compared to the aggregate P/E ratio of the 32.64 in the Technology Hardware, Storage & Peripherals industry, Dell Technologies Inc. has a lower P/E ratio of 25.58. Shareholders might be inclined to think that the stock might perform worse than it’s industry peers. It’s also possible that the stock is undervalued.
In summary, while the price-to-earnings ratio is a valuable tool for investors to evaluate a company’s market performance, it should be used with caution. A low P/E ratio can be an indication of undervaluation, but it can also suggest weak growth prospects or financial instability. Moreover, the P/E ratio is just one of many metrics that investors should consider when making investment decisions, and it should be evaluated alongside other financial ratios, industry trends, and qualitative factors. By taking a comprehensive approach to analyzing a company’s financial health, investors can make well-informed decisions that are more likely to lead to successful outcomes.
Market News and Data brought to you by Benzinga APIs
© 2024 Benzinga.com. Benzinga does not provide investment advice. All rights reserved.
S&P 500 Faces Volatile 2025 As 'Inflation Boom' Could Return: Bank Of America Strategist
The S&P 500 index is wrapping up a historic two-year run of consecutive over 20% gains, a feat achieved only four times in the past 150 years. Yet, Michael Hartnett, chief investment strategist at Bank of America, says the party may not last forever.
According to Hartnett’s latest Flow Show report, published Friday, the U.S. equity market is poised for another “double-digit move” in 2025 — though investors shouldn’t rule out the possibility of a second wave of inflation that could derail the bull market.
The Bank of America’s Investment Clock — a key barometer that shows the prevailing economic scenario in a given year — is transitioning from a “recovery” in 2024 to an “inflation boom” in 2025.
The S&P 500 — as tracked by the SPDR S&P 500 ETF Trust SPY — surged 24% in 2024, mirroring its 24% rally in 2023.
This back-to-back streak of 20%-plus returns happened just four times in the past century and a half: during 1927-’28, 1935-’36, 1954-’55, and 1995-’96.
However, history shows that the years following such rallies often see wild market swings, for better or worse.
- 1927-28: Followed by a -12% loss in 1929 and a catastrophic -28% drop in 1930.
- 1935-36: After two years of outsized returns, 1937 saw a brutal -39% decline.
- 1954-55: Markets cooled, with modest gains of +3% in 1956 and a -14% slide in 1957.
- 1995-96: Continued strength with a +31% gain in 1997 but slowed to +12% in 1998.
Will 2025 follow a similar script? Hartnett says a major move — up or down — should be expected.
Hartnett highlights three key drivers that can pave the way for the bull market to continue in 2025.
- A “boomy” economic backdrop: Companies are front-loading operations ahead of potential tariffs, labor hoarding remains rampant amid tighter immigration controls and unemployment claims have tumbled.
- Goldilocks bond yields: Despite $36 trillion in U.S. debt and a 7% GDP deficit, central banks are expected to cut rates in 2025 — Bank of America is forecasting 124 global rate cuts.
- Political incentives: The Trump administration is heavily invested in propping up risk assets like equities and cryptocurrencies to stimulate “animal spirits,” making a bear market unlikely heading into an election year.
With the S&P 500’s trailing price-to-earnings ratio now at 26.5x, it ranks as the fourth-highest valuation in 125 years, behind only December 1921, June 1999 and June 2021.
The U.S. stock market is sitting at 75-year highs relative to international equities, with just 10 companies accounting for a staggering 37% of market cap.
This concentration has been driven by the so-called “Magnificent Seven” tech giants — stocks whose collective market capitalization surged by $4 trillion in 2024.
But Hartnett indicates the narrative of U.S. exceptionalism, particularly in artificial intelligence, may be peaking cyclically.
Crunching the numbers, he highlighted that the S&P 500’s secular bull market, which began at 666 points in March 2009, could potentially climax at 6,666 in 2025.
Bank of America’s Investment Clock model indicates 2024 marked an equity-bullish “recovery” phase, driven by lower rates and higher corporate earnings.
But 2025 could transition into an “inflation boom” phase, where rising rates and price pressures become the dominant themes.
While Hartnett is bullish on commodities as a hedge against this scenario, he warns credit and equities may peak in early 2025.
Read Now:
Photo: Shutterstock
Market News and Data brought to you by Benzinga APIs
© 2024 Benzinga.com. Benzinga does not provide investment advice. All rights reserved.
Enanta Pharma's Earnings Outlook
Enanta Pharma ENTA is gearing up to announce its quarterly earnings on Monday, 2024-11-25. Here’s a quick overview of what investors should know before the release.
Analysts are estimating that Enanta Pharma will report an earnings per share (EPS) of $-1.16.
The announcement from Enanta Pharma is eagerly anticipated, with investors seeking news of surpassing estimates and favorable guidance for the next quarter.
It’s worth noting for new investors that guidance can be a key determinant of stock price movements.
Historical Earnings Performance
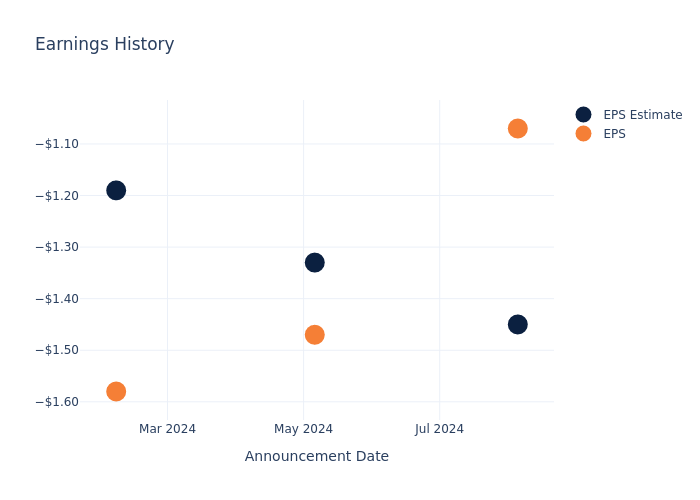
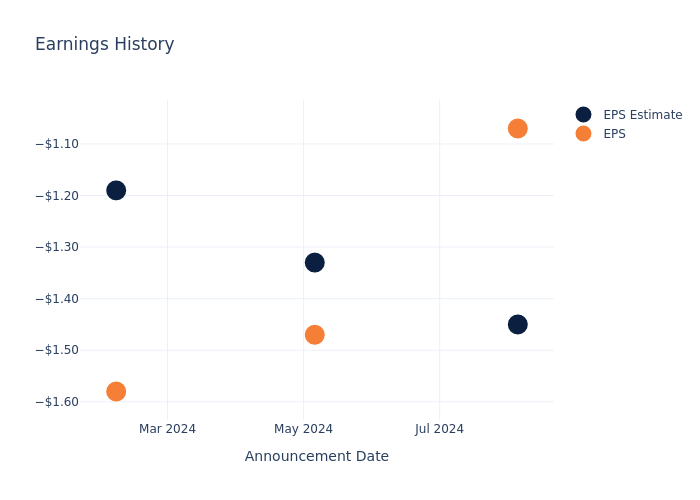
In the previous earnings release, the company beat EPS by $0.38, leading to a 1.17% increase in the share price the following trading session.
Here’s a look at Enanta Pharma’s past performance and the resulting price change:
| Quarter | Q3 2024 | Q2 2024 | Q1 2024 | Q4 2023 |
|---|---|---|---|---|
| EPS Estimate | -1.45 | -1.33 | -1.19 | -2 |
| EPS Actual | -1.07 | -1.47 | -1.58 | -1.33 |
| Price Change % | 1.0% | -10.0% | 1.0% | 12.0% |
Stock Performance
Shares of Enanta Pharma were trading at $9.31 as of November 21. Over the last 52-week period, shares are down 1.98%. Given that these returns are generally negative, long-term shareholders are likely upset going into this earnings release.
Analyst Views on Enanta Pharma
For investors, grasping market sentiments and expectations in the industry is vital. This analysis explores the latest insights regarding Enanta Pharma.
A total of 3 analyst ratings have been received for Enanta Pharma, with the consensus rating being Outperform. The average one-year price target stands at $23.67, suggesting a potential 154.24% upside.
Comparing Ratings with Peers
The analysis below examines the analyst ratings and average 1-year price targets of and Macrogenics, three significant industry players, providing valuable insights into their relative performance expectations and market positioning.
Overview of Peer Analysis
The peer analysis summary presents essential metrics for and Macrogenics, unveiling their respective standings within the industry and providing valuable insights into their market positions and comparative performance.
| Company | Consensus | Revenue Growth | Gross Profit | Return on Equity |
|---|---|---|---|---|
| Macrogenics | Neutral | 964.81% | $108.84M | 63.31% |
Key Takeaway:
Enanta Pharma ranks in the middle among its peers for Consensus rating. It is at the top for Revenue Growth, indicating strong performance in this area. Enanta Pharma also leads in Gross Profit, showcasing efficient cost management. However, it falls behind in Return on Equity compared to its peers.
Delving into Enanta Pharma’s Background
Enanta Pharmaceuticals Inc is an American biotechnology company focused on the research and development of molecule drugs to cure viral infections and liver diseases. The targeted diseases are hepatitis C, hepatitis B, nonalcoholic steatohepatitis, and the respiratory syncytial virus. The novelty of company research is a specific direct-acting antiviral inhibitor against the hepatitis C virus. The company’s inhibitors have been developed in collaboration with AbbVie. AbbVie markets the protease inhibitor, paritaprevir, while other inhibitors are in the pipeline.
Financial Milestones: Enanta Pharma’s Journey
Market Capitalization Highlights: Above the industry average, the company’s market capitalization signifies a significant scale, indicating strong confidence and market prominence.
Decline in Revenue: Over the 3 months period, Enanta Pharma faced challenges, resulting in a decline of approximately -4.88% in revenue growth as of 30 June, 2024. This signifies a reduction in the company’s top-line earnings. In comparison to its industry peers, the company trails behind with a growth rate lower than the average among peers in the Health Care sector.
Net Margin: Enanta Pharma’s net margin excels beyond industry benchmarks, reaching -126.08%. This signifies efficient cost management and strong financial health.
Return on Equity (ROE): Enanta Pharma’s ROE is below industry standards, pointing towards difficulties in efficiently utilizing equity capital. With an ROE of -14.38%, the company may encounter challenges in delivering satisfactory returns for shareholders.
Return on Assets (ROA): The company’s ROA is below industry benchmarks, signaling potential difficulties in efficiently utilizing assets. With an ROA of -5.58%, the company may need to address challenges in generating satisfactory returns from its assets.
Debt Management: Enanta Pharma’s debt-to-equity ratio surpasses industry norms, standing at 0.34. This suggests the company carries a substantial amount of debt, posing potential financial challenges.
To track all earnings releases for Enanta Pharma visit their earnings calendar on our site.
This article was generated by Benzinga’s automated content engine and reviewed by an editor.
© 2024 Benzinga.com. Benzinga does not provide investment advice. All rights reserved.
A Closer Look at Booking Holdings's Options Market Dynamics
Whales with a lot of money to spend have taken a noticeably bearish stance on Booking Holdings.
Looking at options history for Booking Holdings BKNG we detected 31 trades.
If we consider the specifics of each trade, it is accurate to state that 29% of the investors opened trades with bullish expectations and 64% with bearish.
From the overall spotted trades, 7 are puts, for a total amount of $285,901 and 24, calls, for a total amount of $2,263,422.
Expected Price Movements
After evaluating the trading volumes and Open Interest, it’s evident that the major market movers are focusing on a price band between $4000.0 and $5800.0 for Booking Holdings, spanning the last three months.
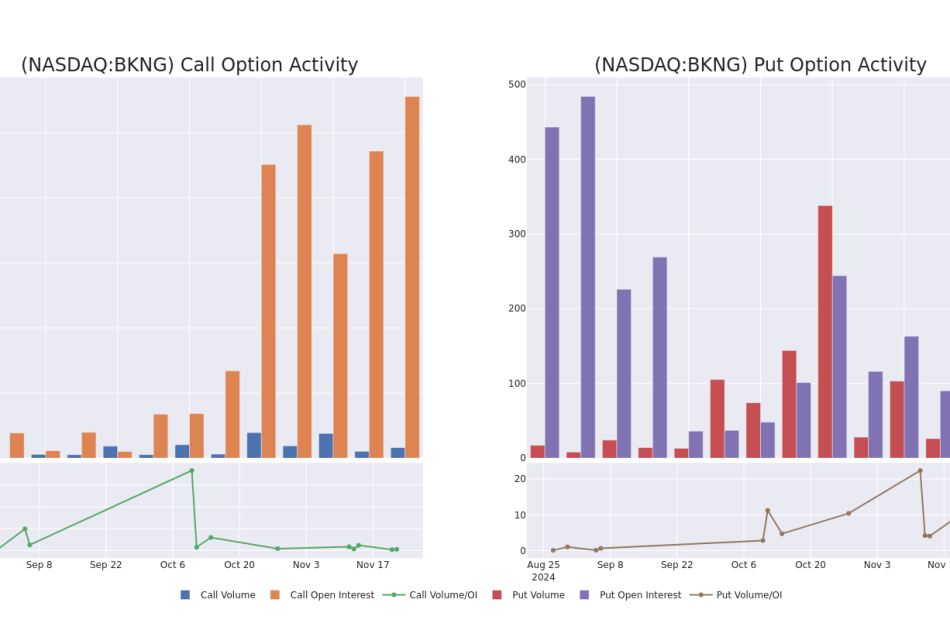
Volume & Open Interest Trends
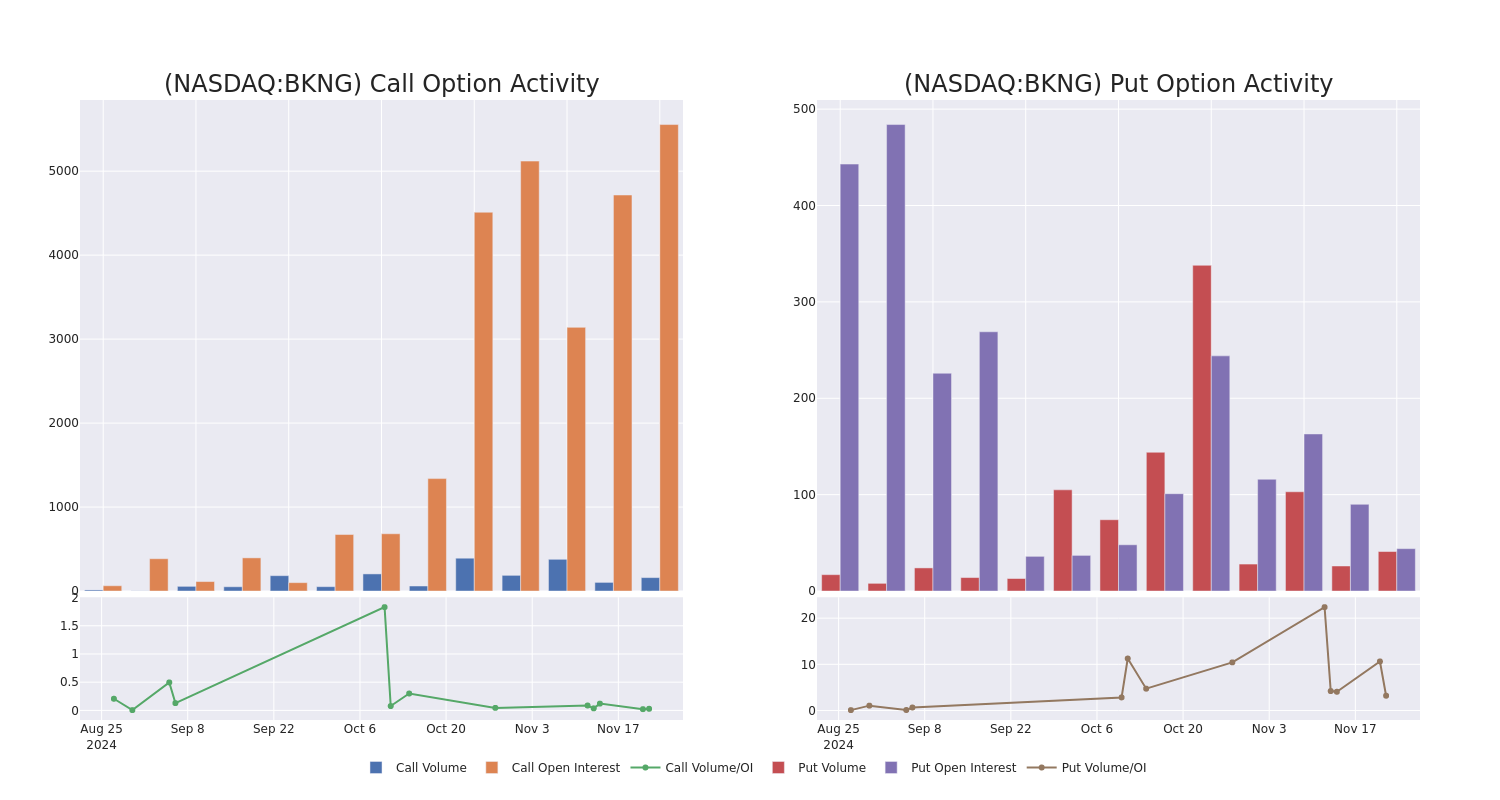
Examining the volume and open interest provides crucial insights into stock research. This information is key in gauging liquidity and interest levels for Booking Holdings’s options at certain strike prices. Below, we present a snapshot of the trends in volume and open interest for calls and puts across Booking Holdings’s significant trades, within a strike price range of $4000.0 to $5800.0, over the past month.
Booking Holdings Call and Put Volume: 30-Day Overview
Biggest Options Spotted:
| Symbol | PUT/CALL | Trade Type | Sentiment | Exp. Date | Ask | Bid | Price | Strike Price | Total Trade Price | Open Interest | Volume |
|---|---|---|---|---|---|---|---|---|---|---|---|
| BKNG | CALL | TRADE | BULLISH | 12/18/26 | $1618.6 | $1593.6 | $1615.0 | $4300.00 | $807.5K | 8 | 5 |
| BKNG | CALL | TRADE | BULLISH | 06/20/25 | $1143.9 | $1107.0 | $1129.16 | $4300.00 | $225.8K | 18 | 2 |
| BKNG | CALL | TRADE | BEARISH | 06/20/25 | $1394.7 | $1380.1 | $1380.1 | $4000.00 | $138.0K | 51 | 1 |
| BKNG | CALL | TRADE | NEUTRAL | 12/20/24 | $66.5 | $56.1 | $60.63 | $5350.00 | $121.2K | 363 | 94 |
| BKNG | CALL | SWEEP | BEARISH | 12/20/24 | $321.1 | $320.0 | $320.0 | $4950.00 | $96.0K | 38 | 3 |
About Booking Holdings
Booking is the world’s largest online travel agency by sales, offering booking and payment services for hotel and alternative accommodation rooms, airline tickets, rental cars, restaurant reservations, cruises, experiences, and other vacation packages. The company operates several branded travel booking sites, including Booking.com, Agoda, OpenTable, and Rentalcars.com, and has expanded into travel media with the acquisitions of Kayak and Momondo. Transaction fees for online bookings account for the bulk of revenue and profits.
After a thorough review of the options trading surrounding Booking Holdings, we move to examine the company in more detail. This includes an assessment of its current market status and performance.
Booking Holdings’s Current Market Status
- With a volume of 10,693, the price of BKNG is down -0.29% at $5196.0.
- RSI indicators hint that the underlying stock may be overbought.
- Next earnings are expected to be released in 90 days.
Professional Analyst Ratings for Booking Holdings
A total of 5 professional analysts have given their take on this stock in the last 30 days, setting an average price target of $5131.0.
Unusual Options Activity Detected: Smart Money on the Move
Benzinga Edge’s Unusual Options board spots potential market movers before they happen. See what positions big money is taking on your favorite stocks. Click here for access.
* An analyst from RBC Capital has decided to maintain their Outperform rating on Booking Holdings, which currently sits at a price target of $5250.
* Maintaining their stance, an analyst from Deutsche Bank continues to hold a Buy rating for Booking Holdings, targeting a price of $5200.
* Consistent in their evaluation, an analyst from DA Davidson keeps a Buy rating on Booking Holdings with a target price of $5005.
* An analyst from Citigroup persists with their Buy rating on Booking Holdings, maintaining a target price of $5500.
* An analyst from Truist Securities persists with their Hold rating on Booking Holdings, maintaining a target price of $4700.
Options are a riskier asset compared to just trading the stock, but they have higher profit potential. Serious options traders manage this risk by educating themselves daily, scaling in and out of trades, following more than one indicator, and following the markets closely.
If you want to stay updated on the latest options trades for Booking Holdings, Benzinga Pro gives you real-time options trades alerts.
Market News and Data brought to you by Benzinga APIs
© 2024 Benzinga.com. Benzinga does not provide investment advice. All rights reserved.
Preview: PennantPark Floating Rate's Earnings
PennantPark Floating Rate PFLT is gearing up to announce its quarterly earnings on Monday, 2024-11-25. Here’s a quick overview of what investors should know before the release.
Analysts are estimating that PennantPark Floating Rate will report an earnings per share (EPS) of $0.32.
The market awaits PennantPark Floating Rate’s announcement, with hopes high for news of surpassing estimates and providing upbeat guidance for the next quarter.
It’s important for new investors to understand that guidance can be a significant driver of stock prices.
Earnings Track Record
During the last quarter, the company reported an EPS missed by $0.01, leading to a 0.37% increase in the share price on the subsequent day.
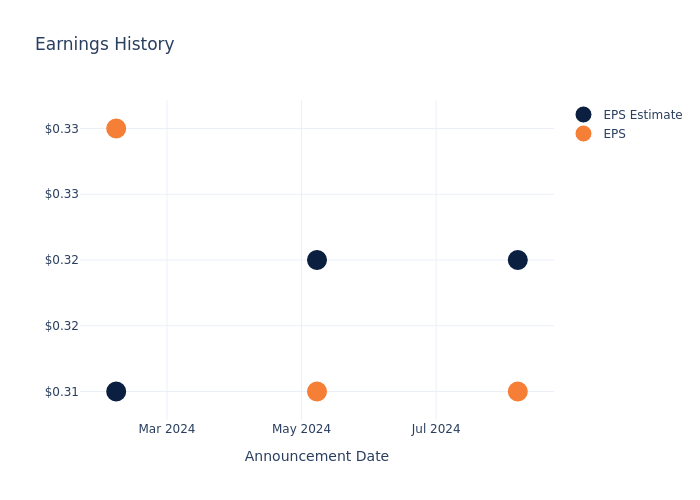
Here’s a look at PennantPark Floating Rate’s past performance and the resulting price change:
| Quarter | Q3 2024 | Q2 2024 | Q1 2024 | Q4 2023 |
|---|---|---|---|---|
| EPS Estimate | 0.32 | 0.32 | 0.31 | 0.31 |
| EPS Actual | 0.31 | 0.31 | 0.33 | 0.32 |
| Price Change % | 0.0% | -1.0% | 1.0% | 1.0% |
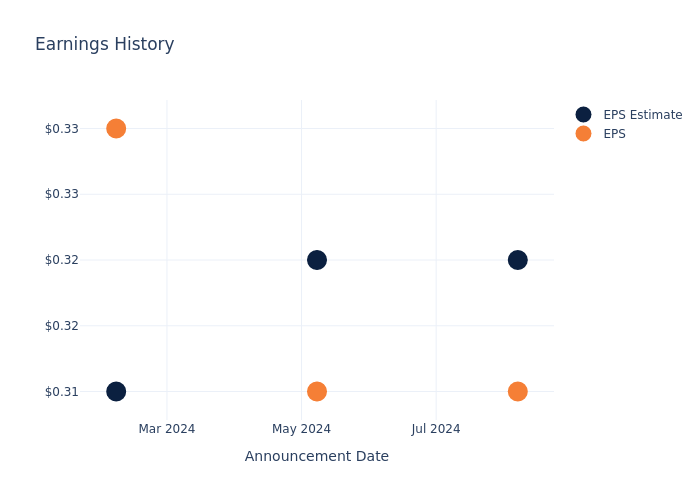
PennantPark Floating Rate Share Price Analysis
Shares of PennantPark Floating Rate were trading at $11.04 as of November 21. Over the last 52-week period, shares are up 0.05%. Given that these returns are generally positive, long-term shareholders are likely bullish going into this earnings release.
This article was generated by Benzinga’s automated content engine and reviewed by an editor.
Market News and Data brought to you by Benzinga APIs
© 2024 Benzinga.com. Benzinga does not provide investment advice. All rights reserved.
Dow Jumps 300 Points; Gap Posts Upbeat Earnings
U.S. stocks traded higher this morning, with the Dow Jones index gaining by more than 300 points on Friday.
Following the market opening Friday, the Dow traded up 0.72% to 44,184.62 while the NASDAQ rose 0.07% to 18,985.33. The S&P 500 also rose, gaining, 0.35% to 5,969.29.
Check This Out: Top 3 Materials Stocks That Could Blast Off In November
Leading and Lagging Sectors
Consumer staples shares rose by 1% on Friday.
In trading on Friday, communication services shares fell by 0.4%.
Top Headline
Gap, Inc. GAP reported better-than-expected earnings for its second quarter and raised its outlook for FY24 gross margin.
The company reported quarterly earnings of 54 cents per share, which beat the analyst consensus estimate of 40 cents per share.
Equities Trading UP
- SKK Holdings Limited SKK shares shot up 76% to $1.95 after declining around 75% on Wednesday.
- Shares of DevvStream Corp. DEVS got a boost, surging 77% to $0.8931.
- Replimune Group, Inc. REPL shares were also up, gaining 48% to $16.37 after the company on Thursday announced it received breakthrough therapy designation status for RP1 and will submit an RP1 biologics license application to the FDA under an accelerated approval pathway.
Equities Trading DOWN
- Autonomix Medical, Inc. AMIX shares dropped 52% to $6.53 after the company announced the pricing of a $9 million underwritten public offering.
- Shares of Aptose Biosciences Inc. APTO were down 44% to $0.1374 after the company announced the pricing of an $8 million public offering.
- Cemtrex, Inc. CETX was down, falling 42% to $0.1148 after the company announced its board approved a 1-for-35 reverse stock split.
Commodities
In commodity news, oil traded up 0.8% to $70.67 while gold traded up 0.9% at $2,697.70.
Silver traded up 1.2% to $31.33 on Thursday, while copper fell 0.8% to $4.0910.
Euro zone
European shares were higher today. The eurozone’s STOXX 600 rose 1.2%, Germany’s DAX gained 0.9% and France’s CAC 40 rose 0.7%. Spain’s IBEX 35 Index rose 0.2%, while London’s FTSE 100 gained 1.4%.
The S&P Global UK composite PMI declined to 49.9 in November versus 51.8 in the previous month, while Eurozone composite PMI dipped to 48.1 in November from 50 in the prior month.
Asia Pacific Markets
Asian markets closed mixed on Friday, with Japan’s Nikkei 225 gaining 0.68%, Hong Kong’s Hang Seng Index falling 1.89%, China’s Shanghai Composite Index dipping 3.06% and India’s BSE Sensex gaining 2.54%.
Economics
- The S&P Global US Services PMI climbed to 57 in November versus 55 in the previous month, while manufacturing PMI increased to 48.8 in November from 48.5 in the previous month.
- The University of Michigan consumer sentiment for the US fell to 71.8 in November versus a preliminary reading of 73.
- The year-ahead inflation expectations in the U.S fell to 2.6% in November from 2.7% in October.
Now Read This:
Market News and Data brought to you by Benzinga APIs
© 2024 Benzinga.com. Benzinga does not provide investment advice. All rights reserved.
Pennant Park Investment's Earnings: A Preview
Pennant Park Investment PNNT is gearing up to announce its quarterly earnings on Monday, 2024-11-25. Here’s a quick overview of what investors should know before the release.
Analysts are estimating that Pennant Park Investment will report an earnings per share (EPS) of $0.22.
The market awaits Pennant Park Investment’s announcement, with hopes high for news of surpassing estimates and providing upbeat guidance for the next quarter.
It’s important for new investors to understand that guidance can be a significant driver of stock prices.
Past Earnings Performance
Last quarter the company beat EPS by $0.01, which was followed by a 1.03% increase in the share price the next day.
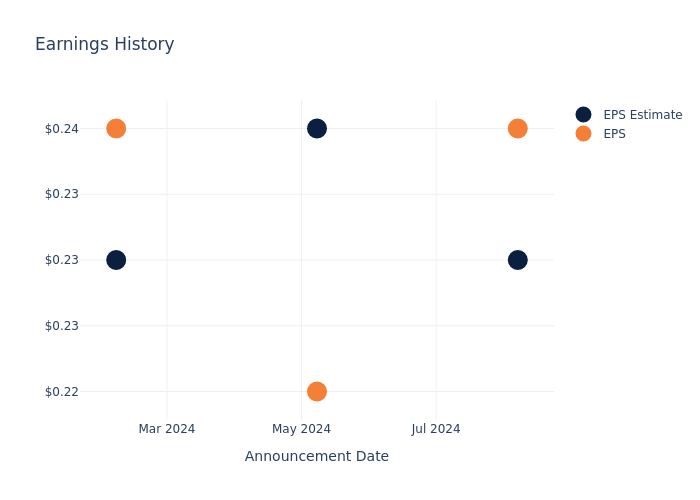
Here’s a look at Pennant Park Investment’s past performance and the resulting price change:
| Quarter | Q3 2024 | Q2 2024 | Q1 2024 | Q4 2023 |
|---|---|---|---|---|
| EPS Estimate | 0.23 | 0.24 | 0.23 | 0.22 |
| EPS Actual | 0.24 | 0.22 | 0.24 | 0.24 |
| Price Change % | 1.0% | 2.0% | -1.0% | -0.0% |
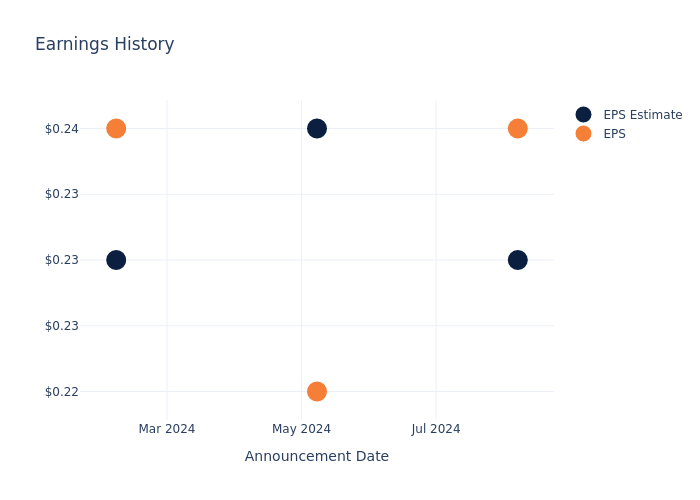
Pennant Park Investment Share Price Analysis
Shares of Pennant Park Investment were trading at $6.94 as of November 21. Over the last 52-week period, shares are up 7.73%. Given that these returns are generally positive, long-term shareholders should be satisfied going into this earnings release.
Analysts’ Take on Pennant Park Investment
For investors, grasping market sentiments and expectations in the industry is vital. This analysis explores the latest insights regarding Pennant Park Investment.
The consensus rating for Pennant Park Investment is Neutral, based on 1 analyst ratings. With an average one-year price target of $6.0, there’s a potential 13.54% downside.
Peer Ratings Comparison
In this analysis, we delve into the analyst ratings and average 1-year price targets of and Bridge Investment Group, three key industry players, offering insights into their relative performance expectations and market positioning.
Summary of Peers Analysis
The peer analysis summary offers a detailed examination of key metrics for and Bridge Investment Group, providing valuable insights into their respective standings within the industry and their market positions and comparative performance.
| Company | Consensus | Revenue Growth | Gross Profit | Return on Equity |
|---|---|---|---|---|
| Bridge Investment Group | Outperform | -4.48% | $41.07M | 5.58% |
Key Takeaway:
Pennant Park Investment ranks in the middle for Consensus rating among its peers. It is at the bottom for Revenue Growth. It is at the top for Gross Profit. It is at the bottom for Return on Equity.
Discovering Pennant Park Investment: A Closer Look
Pennant Park Investment Corp is a closed-end, non-diversified investment company. Its investment objective is to generate current income and capital appreciation also seeking to preserve capital through debt and equity investments. The company focuses on investing in United States middle-market companies that offer attractive risk-reward to investors and to create a diversified portfolio that includes senior secured debt, mezzanine debt, and equity investments. It generates majority of its revenue from interest and dividends received from investments made.
Financial Milestones: Pennant Park Investment’s Journey
Market Capitalization Perspectives: The company’s market capitalization falls below industry averages, signaling a relatively smaller size compared to peers. This positioning may be influenced by factors such as perceived growth potential or operational scale.
Decline in Revenue: Over the 3 months period, Pennant Park Investment faced challenges, resulting in a decline of approximately -76.81% in revenue growth as of 30 June, 2024. This signifies a reduction in the company’s top-line earnings. As compared to competitors, the company encountered difficulties, with a growth rate lower than the average among peers in the Financials sector.
Net Margin: Pennant Park Investment’s net margin excels beyond industry benchmarks, reaching 62.84%. This signifies efficient cost management and strong financial health.
Return on Equity (ROE): Pennant Park Investment’s ROE is below industry averages, indicating potential challenges in efficiently utilizing equity capital. With an ROE of 0.75%, the company may face hurdles in achieving optimal financial returns.
Return on Assets (ROA): Pennant Park Investment’s ROA falls below industry averages, indicating challenges in efficiently utilizing assets. With an ROA of 0.29%, the company may face hurdles in generating optimal returns from its assets.
Debt Management: Pennant Park Investment’s debt-to-equity ratio stands notably higher than the industry average, reaching 1.54. This indicates a heavier reliance on borrowed funds, raising concerns about financial leverage.
This article was generated by Benzinga’s automated content engine and reviewed by an editor.
Market News and Data brought to you by Benzinga APIs
© 2024 Benzinga.com. Benzinga does not provide investment advice. All rights reserved.


