Bitcoin 'On Brink Of Breaking $100,000,' Dogecoin Up, Ethereum Down: Crypto Community Holds Its Breath As BTC Guns For Milestone
Cryptocurrency markets are trading higher, with Bitcoin hovering around $100,000 and Jim Cramer suggesting it is “a winner.”
| Cryptocurrency | Price | Gains +/- |
| Bitcoin BTC/USD | $99,254.71 | +0.88% |
| Ethereum ETH/USD | $3,281.28 | -2.1% |
| Solana SOL/USD | $253.09 | -0.8% |
| Dogecoin DOGE/USD | $0.3987 | +3.7% |
| Shiba Inu SHIB/USD | $0.00002463 | +0.3% |
Notable Statistics:
- IntoTheBlock data shows large transaction volume increasing by 47.5% and daily active addresses growing by 27.2%. Transactions greater than $100,000 are up from 13,321 to 18,859 in a single day. Exchanges netflows are down by 4.5%.
- Coinglass data reports 113,608 traders were liquidated in the past 24 hours for $340.73 million. Open interest continues to stand at peak levels, $64 billion.
- Polymarket data shows there is a 60% chance of Bitcoin touching $100,000 today and an 89% probability of it happening this month.
Notable Developments:
Top Gainers:
| Cryptocurrency | Price | Gains +/- |
| Stellar XLM/USD | $0.3194 | +28.2% |
| XRP XRP/USD | $1.42 | +20.6% |
| Cardano ADA/USD | $0.9647 | +19.9% |
Trader Notes: Bitcoin nearing $100,000 sparked mixed sentiments among traders.
Altcoin Sherpa quipped “See you guys at $60,000” when Bitcoin failed to break through the psychological barrier.
Crypto trader Seth highlights a “thick and sticky sell wall” as the obstacle.
Dogecoin founder Billy Markus stated, “maybe bitcoin will become a $99,000 stablecoin.”
Quinten Francois remains optimistic, stating the Bitcoin bull market has “just started.”
Daan Crypto Trades explained that traders are preemptively shifting from altcoins to Bitcoin as it edges closer to the $100,000 milestone.
He predicts a breakout, followed by consolidation could lead to altcoin rebounds. Until then, Bitcoin is expected to continue absorbing liquidity.
Read Next:
Image: Shutterstock
Market News and Data brought to you by Benzinga APIs
© 2024 Benzinga.com. Benzinga does not provide investment advice. All rights reserved.
NIO Unusual Options Activity For November 22
Whales with a lot of money to spend have taken a noticeably bearish stance on NIO.
Looking at options history for NIO NIO we detected 22 trades.
If we consider the specifics of each trade, it is accurate to state that 4% of the investors opened trades with bullish expectations and 90% with bearish.
From the overall spotted trades, 17 are puts, for a total amount of $1,002,691 and 5, calls, for a total amount of $164,560.
Predicted Price Range
After evaluating the trading volumes and Open Interest, it’s evident that the major market movers are focusing on a price band between $4.0 and $20.0 for NIO, spanning the last three months.
Insights into Volume & Open Interest
Looking at the volume and open interest is an insightful way to conduct due diligence on a stock.
This data can help you track the liquidity and interest for NIO’s options for a given strike price.
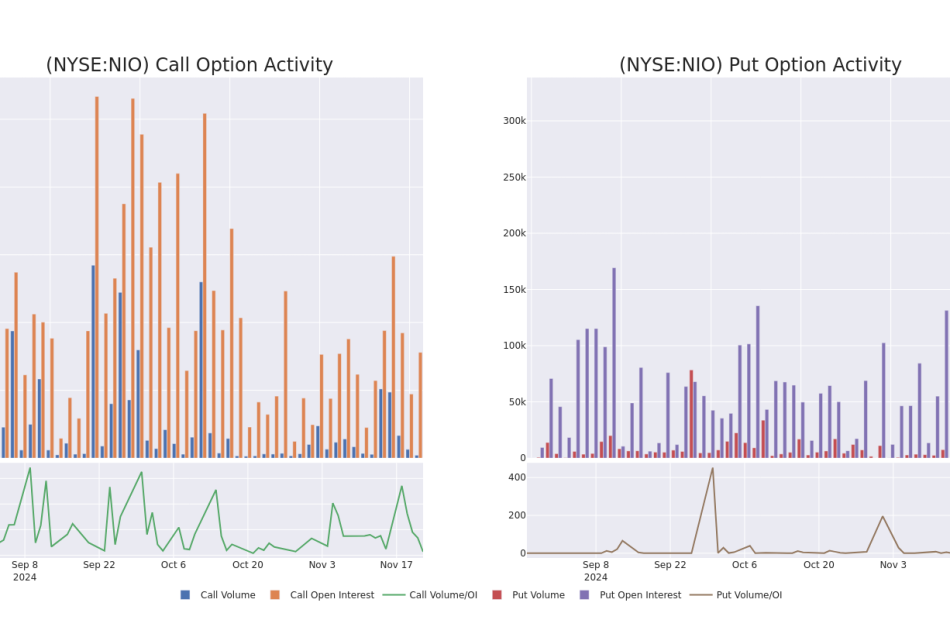
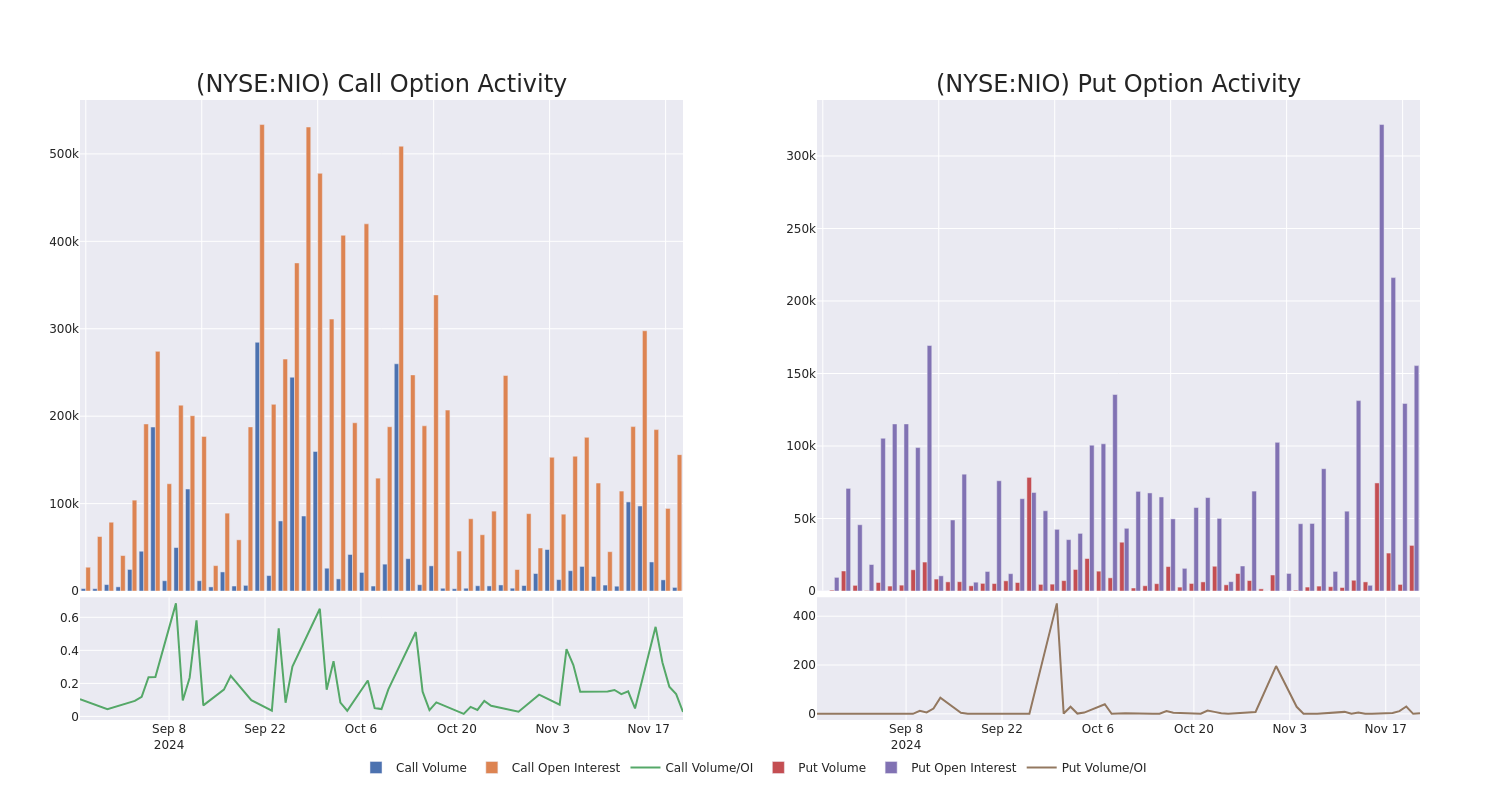
Below, we can observe the evolution of the volume and open interest of calls and puts, respectively, for all of NIO’s whale activity within a strike price range from $4.0 to $20.0 in the last 30 days.
NIO Call and Put Volume: 30-Day Overview
Biggest Options Spotted:
| Symbol | PUT/CALL | Trade Type | Sentiment | Exp. Date | Ask | Bid | Price | Strike Price | Total Trade Price | Open Interest | Volume |
|---|---|---|---|---|---|---|---|---|---|---|---|
| NIO | PUT | SWEEP | BEARISH | 01/16/26 | $4.0 | $3.9 | $3.95 | $8.00 | $129.1K | 17.6K | 881 |
| NIO | PUT | SWEEP | BEARISH | 01/16/26 | $3.95 | $3.85 | $3.95 | $8.00 | $83.6K | 17.6K | 3.9K |
| NIO | PUT | SWEEP | BEARISH | 01/16/26 | $3.95 | $3.9 | $3.95 | $8.00 | $78.9K | 17.6K | 1.8K |
| NIO | PUT | SWEEP | BEARISH | 01/16/26 | $3.95 | $3.9 | $3.92 | $8.00 | $68.8K | 17.6K | 1.5K |
| NIO | PUT | SWEEP | BEARISH | 01/17/25 | $0.67 | $0.65 | $0.67 | $5.00 | $67.0K | 63.0K | 1.0K |
About NIO
Nio is a leading electric vehicle maker, targeting the premium segment. Founded in November 2014, Nio designs, develops, jointly manufactures, and sells premium smart electric vehicles. The company differentiates itself through continuous technological breakthroughs and innovations such as battery swapping and autonomous driving technologies. Nio launched its first model, its ES8 seven-seater electric SUV, in December 2017, and began deliveries in June 2018. Its current model portfolio includes midsize to large sedans and SUVs. It sold over 160,000 EVs in 2023, accounting for about 2% of the China passenger new energy vehicle market.
In light of the recent options history for NIO, it’s now appropriate to focus on the company itself. We aim to explore its current performance.
Where Is NIO Standing Right Now?
- With a volume of 45,538,092, the price of NIO is up 3.4% at $4.86.
- RSI indicators hint that the underlying stock is currently neutral between overbought and oversold.
- Next earnings are expected to be released in 102 days.
What The Experts Say On NIO
Over the past month, 2 industry analysts have shared their insights on this stock, proposing an average target price of $5.699999999999999.
Unusual Options Activity Detected: Smart Money on the Move
Benzinga Edge’s Unusual Options board spots potential market movers before they happen. See what positions big money is taking on your favorite stocks. Click here for access.
* An analyst from Macquarie has revised its rating downward to Neutral, adjusting the price target to $4.
* An analyst from Macquarie has elevated its stance to Outperform, setting a new price target at $6.
Options trading presents higher risks and potential rewards. Astute traders manage these risks by continually educating themselves, adapting their strategies, monitoring multiple indicators, and keeping a close eye on market movements. Stay informed about the latest NIO options trades with real-time alerts from Benzinga Pro.
Market News and Data brought to you by Benzinga APIs
© 2024 Benzinga.com. Benzinga does not provide investment advice. All rights reserved.
Toll Brothers Announces Final Opportunity at Verona Estates Community in Chatsworth, California
CHATSWORTH, Calif., Nov. 22, 2024 (GLOBE NEWSWIRE) — Toll Brothers, Inc. TOL, the nation’s leading builder of luxury homes, today announced the final opportunity to own a new home at Verona Estates, an exclusive gated community in Chatsworth, California. Only a few homes remain available for sale in this prestigious community, including the professionally decorated Siena Modern Farmhouse model home.
The intimate gated enclave of Verona Estates is a rare find showcasing award-winning architecture and innovative home designs. Nestled in an established Chatsworth neighborhood south of the Santa Susana Mountains and adjacent to the Vineyards at Porter Ranch, this exceptional community offers a serene and relaxed atmosphere with the convenience of nearby shopping and easy access to freeways, entertainment, and recreation.
Toll Brothers residents in Verona Estates will enjoy distinctive architecture, quality craftsmanship, luxurious home designs with open floor plans, expansive home sites, and proximity to the future 50-acre Porter Ranch community park. Verona Estates offers generous two-story home designs ranging from 4,700 to 6,000+ square feet, with 5 to 6 bedrooms, 4.5 to 6.5 bathrooms, and 3-car garages. The homes also feature popular floor plan options including prep kitchens, guest suites, floating staircases, indoor and outdoor fireplaces, and more. Move-in ready homes in the community are priced from $1,979,995.

“We are thrilled to offer the final opportunity to own a home in the exclusive Verona Estates community,” said Nick Norvilas, Division President of Toll Brothers in Los Angeles. “The Siena model home is a showcase of luxury and design, and we encourage interested home buyers to visit and experience this exceptional home along with the final few quick move-in homes remaining in the community firsthand.”
The Siena Modern Farmhouse model home features designer upgrades throughout, including fully landscaped and furnished interiors, offering an unparalleled living experience. The professionally decorated model home is priced at $2,999,995.
For more information, call 844-700-8655 or visit TollBrothers.com/LA. The Sales Center for Verona Estates is located at 20508 Edgewood Court in Chatsworth and is open by appointment only.
About Toll Brothers
Toll Brothers, Inc., a Fortune 500 Company, is the nation’s leading builder of luxury homes. The Company was founded 57 years ago in 1967 and became a public company in 1986. Its common stock is listed on the New York Stock Exchange under the symbol “TOL.” The Company serves first-time, move-up, empty-nester, active-adult, and second-home buyers, as well as urban and suburban renters. Toll Brothers builds in over 60 markets in 24 states: Arizona, California, Colorado, Connecticut, Delaware, Florida, Georgia, Idaho, Indiana, Maryland, Massachusetts, Michigan, Nevada, New Jersey, New York, North Carolina, Oregon, Pennsylvania, South Carolina, Tennessee, Texas, Utah, Virginia, and Washington, as well as in the District of Columbia. The Company operates its own architectural, engineering, mortgage, title, land development, smart home technology, and landscape subsidiaries. The Company also develops master-planned and golf course communities as well as operates its own lumber distribution, house component assembly, and manufacturing operations.
In 2024, Toll Brothers marked 10 years in a row being named to the Fortune World’s Most Admired Companies™ list and the Company’s Chairman and CEO Douglas C. Yearley, Jr. was named one of 25 Top CEOs by Barron’s magazine. Toll Brothers has also been named Builder of the Year by Builder magazine and is the first two-time recipient of Builder of the Year from Professional Builder magazine. For more information visit TollBrothers.com.
From Fortune, ©2024 Fortune Media IP Limited. All rights reserved. Used under license.
Contact: Andrea Meck | Toll Brothers, Director, Public Relations & Social Media | 215-938-8169 | ameck@tollbrothers.com
A photo accompanying this announcement is available at https://www.globenewswire.com/NewsRoom/AttachmentNg/cbb8cf4a-a018-4df0-955e-3cf4ab63edeb
Sent by Toll Brothers via Regional Globe Newswire (TOLL-REG)

© 2024 Benzinga.com. Benzinga does not provide investment advice. All rights reserved.
Noteworthy Insider Activity: CARL ICAHN Invests $1.37M In CVR Partners Stock
On November 21, a substantial insider purchase was made by CARL ICAHN, 10% Owner at CVR Partners UAN, as per the latest SEC filing.
What Happened: A Form 4 filing from the U.S. Securities and Exchange Commission on Thursday showed that ICAHN purchased 19,174 shares of CVR Partners. The total transaction amounted to $1,374,040.
In the Friday’s morning session, CVR Partners‘s shares are currently trading at $72.0, experiencing a up of 0.53%.
Get to Know CVR Partners Better
CVR Partners LP is a manufacturer and supplier of nitrogen fertilizer products. Its principal products include Urea Ammonium Nitrate (UAN) and ammonia. The company market ammonia products to industrial and agricultural customers and UAN products to agricultural customers. The primary geographic markets for its fertilizer products are Kansas, Missouri, Nebraska, Iowa, Illinois, Colorado, and Texas. The company’s product sales are heavily weighted toward UAN.
A Deep Dive into CVR Partners’s Financials
Negative Revenue Trend: Examining CVR Partners’s financials over 3 months reveals challenges. As of 30 September, 2024, the company experienced a decline of approximately -4.13% in revenue growth, reflecting a decrease in top-line earnings. When compared to others in the Materials sector, the company excelled with a growth rate higher than the average among peers.
Navigating Financial Profits:
-
Gross Margin: With a low gross margin of 14.73%, the company exhibits below-average profitability, signaling potential struggles in cost efficiency compared to its industry peers.
-
Earnings per Share (EPS): CVR Partners’s EPS is significantly higher than the industry average. The company demonstrates a robust bottom-line performance with a current EPS of 0.36.
Debt Management: With a high debt-to-equity ratio of 1.92, CVR Partners faces challenges in effectively managing its debt levels, indicating potential financial strain.
Navigating Market Valuation:
-
Price to Earnings (P/E) Ratio: The current P/E ratio of 14.41 is below industry norms, indicating potential undervaluation and presenting an investment opportunity.
-
Price to Sales (P/S) Ratio: The current P/S ratio of 1.44 is below industry norms, suggesting potential undervaluation and presenting an investment opportunity for those considering sales performance.
-
EV/EBITDA Analysis (Enterprise Value to its Earnings Before Interest, Taxes, Depreciation & Amortization): The company’s EV/EBITDA ratio of 7.18 trails industry averages, indicating a potential disparity in market valuation that could be advantageous for investors.
Market Capitalization Perspectives: The company’s market capitalization falls below industry averages, signaling a relatively smaller size compared to peers. This positioning may be influenced by factors such as perceived growth potential or operational scale.
Now trade stocks online commission free with Charles Schwab, a trusted and complete investment firm.
Why Insider Activity Matters in Finance
Emphasizing the importance of a comprehensive approach, considering insider transactions is valuable, but it’s crucial to evaluate them in conjunction with other investment factors.
Exploring the legal landscape, an “insider” is defined as any officer, director, or beneficial owner holding more than ten percent of a company’s equity securities, as stipulated by Section 12 of the Securities Exchange Act of 1934. This encompasses executives in the c-suite and major hedge funds. These insiders are required to report their transactions through a Form 4 filing, which must be submitted within two business days of the transaction.
Highlighted by a company insider’s new purchase, there’s a positive anticipation for the stock to rise.
But, insider sells may not necessarily indicate a bearish view and can be motivated by various factors.
Cracking Transaction Codes
For investors, a primary focus lies on transactions occurring in the open market, as indicated in Table I of the Form 4 filing. A P in Box 3 denotes a purchase, while S signifies a sale. Transaction code C signals the conversion of an option, and transaction code A denotes a grant, award, or other acquisition of securities from the company.
Check Out The Full List Of CVR Partners’s Insider Trades.
Insider Buying Alert: Profit from C-Suite Moves
Benzinga Edge reveals every insider trade in real-time. Don’t miss the next big stock move driven by insider confidence. Unlock this ultimate sentiment indicator now. Click here for access.
This article was generated by Benzinga’s automated content engine and reviewed by an editor.
Market News and Data brought to you by Benzinga APIs
© 2024 Benzinga.com. Benzinga does not provide investment advice. All rights reserved.
A Preview Of Diana Shipping's Earnings
Diana Shipping DSX is preparing to release its quarterly earnings on Monday, 2024-11-25. Here’s a brief overview of what investors should keep in mind before the announcement.
Analysts expect Diana Shipping to report an earnings per share (EPS) of $0.09.
The announcement from Diana Shipping is eagerly anticipated, with investors seeking news of surpassing estimates and favorable guidance for the next quarter.
It’s worth noting for new investors that guidance can be a key determinant of stock price movements.
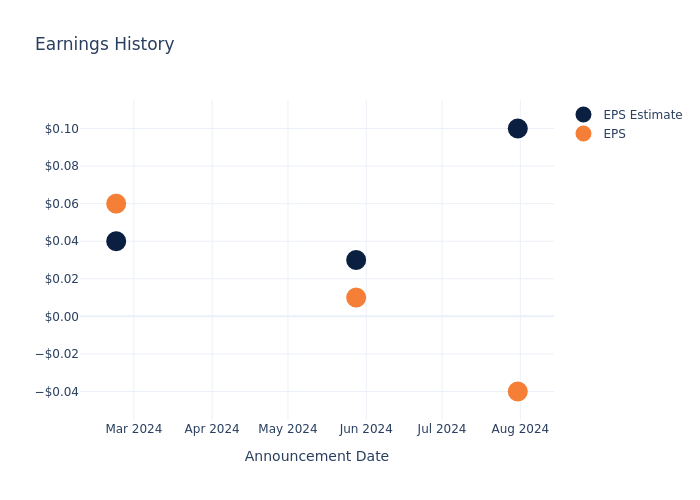
Earnings History Snapshot
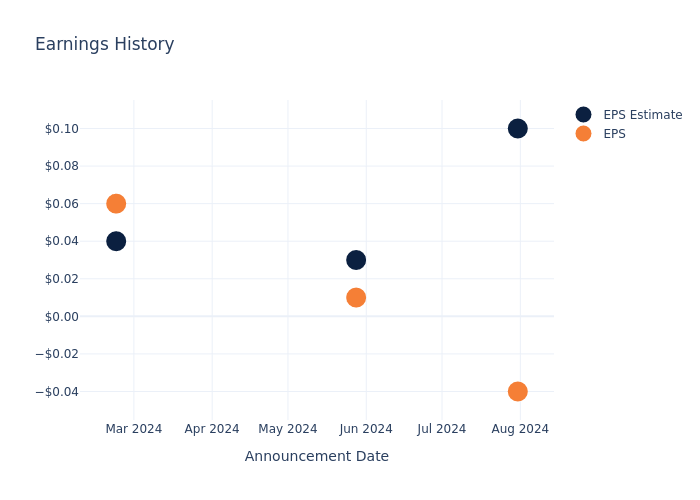
During the last quarter, the company reported an EPS missed by $0.14, leading to a 0.79% drop in the share price on the subsequent day.
Here’s a look at Diana Shipping’s past performance and the resulting price change:
| Quarter | Q2 2024 | Q1 2024 | Q4 2023 | Q3 2023 |
|---|---|---|---|---|
| EPS Estimate | 0.10 | 0.03 | 0.04 | 0.07 |
| EPS Actual | -0.04 | 0.01 | 0.06 | 0.06 |
| Price Change % | -1.0% | -1.0% | 1.0% | 3.0% |
Stock Performance
Shares of Diana Shipping were trading at $2.1 as of November 21. Over the last 52-week period, shares are down 35.5%. Given that these returns are generally negative, long-term shareholders are likely a little upset going into this earnings release.
To track all earnings releases for Diana Shipping visit their earnings calendar on our site.
This article was generated by Benzinga’s automated content engine and reviewed by an editor.
Market News and Data brought to you by Benzinga APIs
© 2024 Benzinga.com. Benzinga does not provide investment advice. All rights reserved.
Why Volatility Is The New Normal: From Great Moderation To 'Temperamental Era'
For over 30 years before the COVID-19 pandemic, investors thrived during what is often referred to as the Great Moderation. Despite a painful episode with the Great Recession, this period saw relatively stable economic conditions, with fewer recessions, lower inflation, and diminished volatility.
The rise of globalization and free trade during this era provided corporations access to cheaper labor and production resources, bolstering profits and encouraging growth. However, according to Liz Ann Sonders, chief investment strategist at Charles Schwab, this stability era has ended. Sonders has coined the current phase the ‘Temperamental Era,’ a period she likens to the volatile economic landscape of the mid-1960s through the early 1990s.
Sonders sees this era as one with increased volatility in economic performance and inflation. Since 2020, dramatic swings in GDP growth have become commonplace, with sharp contractions followed by rapid rebounds—similar to the patterns seen in the latter half of the 20th century.
Inflation has also become more volatile, reminding economists of the 1970s. Back then, the Federal Reserve declared victory over inflation prematurely, leading to policy missteps and back-to-back recessions in the early 1980s. Sonders notes that the current environment is similarly characterized by uncertainty in inflation trends, accompanied by ongoing supply chain reconfigurations and geopolitical tensions.
As companies move toward nearshoring or regional diversification, they drive a shift in supply chain management. Although this strategy enhances resilience, it also raises production costs due to limited regional capacities. Meanwhile, the re-emergence of geopolitical rivalries, particularly between the U.S. and China, and NATO and Russia, causes tensions, increasing the likelihood of trade restrictions, tariffs, and supply risks, further fueling inflationary pressures.
Also Read: ‘Staggering’ Google Breakup Proposal From DOJ A ‘Kitchen Sink Moment’: Alphabet Analyst
ING‘s research last year found that while a repeat of the 1970s inflationary crisis is not inevitable, the risks of higher and more volatile inflation and central bank rates over the next decade are significant.
Shortages of key materials, partly driven by the green energy transition and geopolitical conflicts, could exert upward pressure on prices. Additionally, worker power gradually increases due to labor shortages, pushing wages upward. Accompanied by tighter fiscal and monetary policies designed to curb inflation, the environment limits the flexibility of governments and central banks to respond to future crises.
For investors, this new era demands a shift in strategy. The low-interest-rate environment of the Great Moderation enabled even weak companies to survive on cheap borrowing, but that era is over. Instead, Charles Schwab sees the importance of focusing on fundamentals when selecting stocks.
They note price-to-cash flow, price momentum, and return volatility as metrics of interest. Price-to-cash flow helps investors gauge a company’s ability to sustain operations and meet financial obligations. Price momentum identifies stocks with favorable trends, as past performance often predicts short-term direction. Lastly, return volatility (Beta) measures the stability of a stock’s price movements, with lower volatility typically signaling a less risky investment.
Read Next:
Image created using artificial intelligence via Midjourney.
Market News and Data brought to you by Benzinga APIs
© 2024 Benzinga.com. Benzinga does not provide investment advice. All rights reserved.
A Closer Look at Monday.Com's Options Market Dynamics
High-rolling investors have positioned themselves bullish on Monday.Com MNDY, and it’s important for retail traders to take note.
This activity came to our attention today through Benzinga’s tracking of publicly available options data. The identities of these investors are uncertain, but such a significant move in MNDY often signals that someone has privileged information.
Today, Benzinga’s options scanner spotted 10 options trades for Monday.Com. This is not a typical pattern.
The sentiment among these major traders is split, with 50% bullish and 30% bearish. Among all the options we identified, there was one put, amounting to $28,350, and 9 calls, totaling $611,070.
What’s The Price Target?
Based on the trading activity, it appears that the significant investors are aiming for a price territory stretching from $230.0 to $350.0 for Monday.Com over the recent three months.
Volume & Open Interest Trends
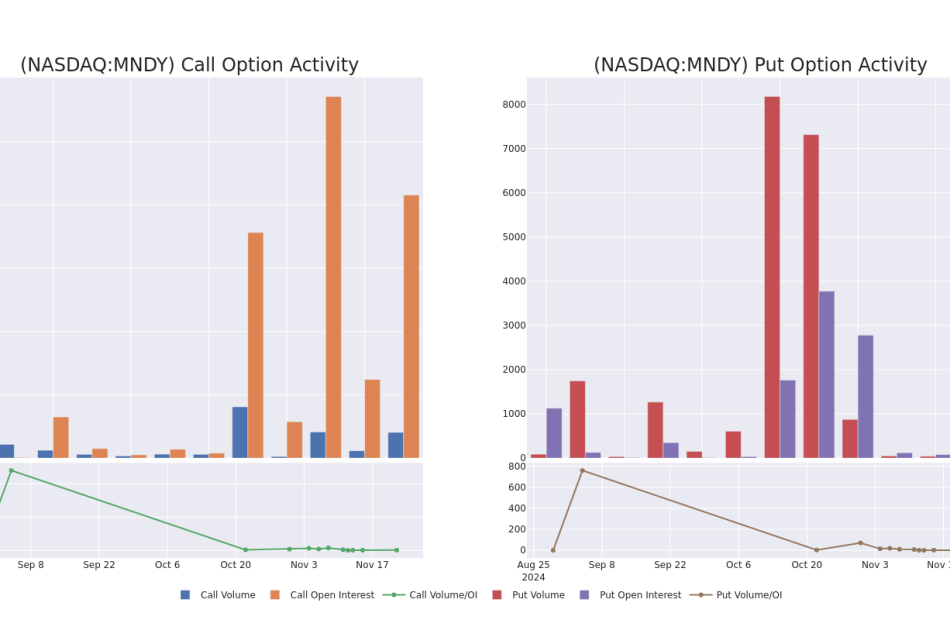
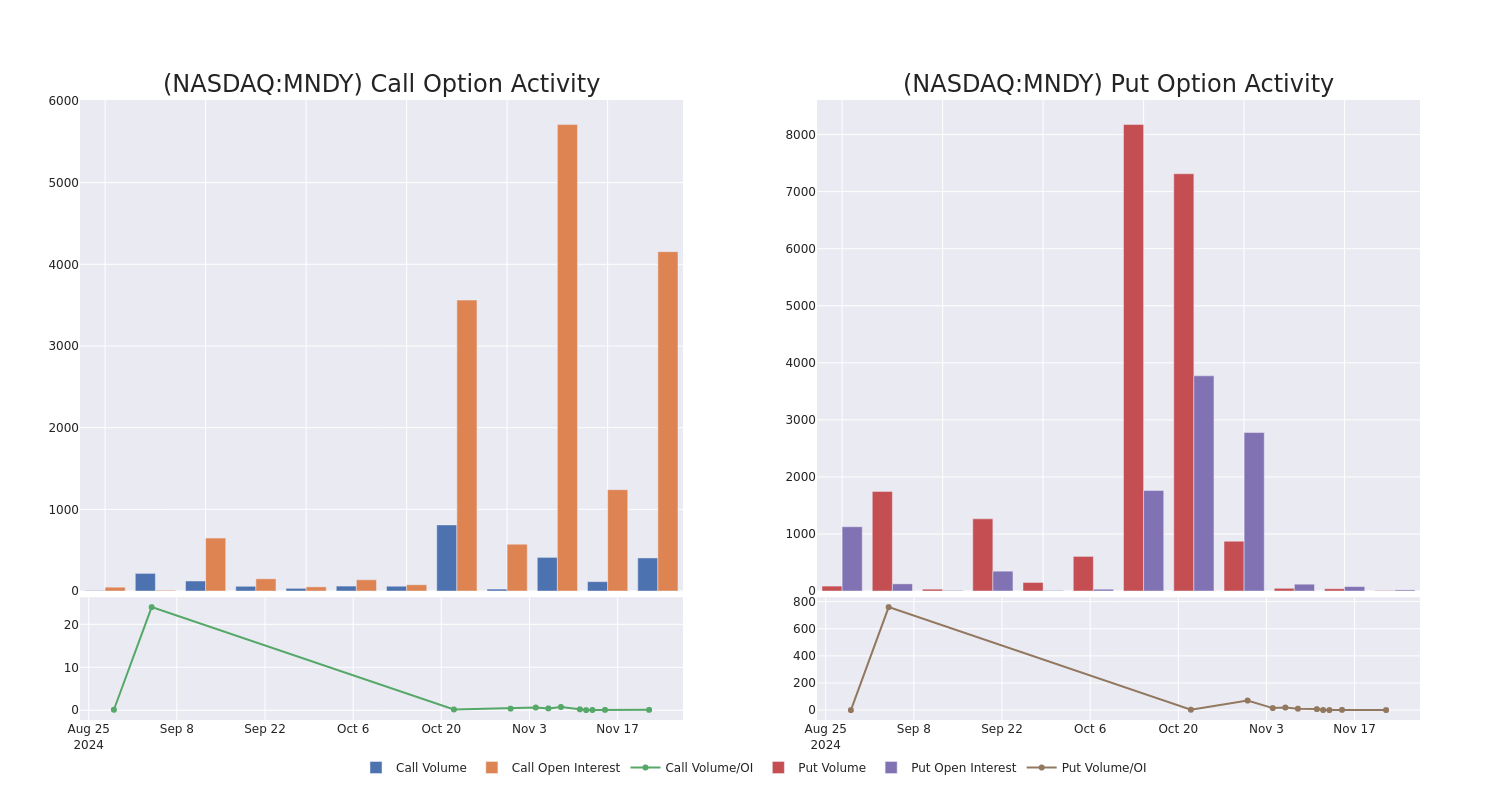
In today’s trading context, the average open interest for options of Monday.Com stands at 463.89, with a total volume reaching 414.00. The accompanying chart delineates the progression of both call and put option volume and open interest for high-value trades in Monday.Com, situated within the strike price corridor from $230.0 to $350.0, throughout the last 30 days.
Monday.Com 30-Day Option Volume & Interest Snapshot
Noteworthy Options Activity:
| Symbol | PUT/CALL | Trade Type | Sentiment | Exp. Date | Ask | Bid | Price | Strike Price | Total Trade Price | Open Interest | Volume |
|---|---|---|---|---|---|---|---|---|---|---|---|
| MNDY | CALL | TRADE | BULLISH | 11/29/24 | $9.0 | $5.1 | $9.0 | $275.00 | $270.0K | 1.3K | 0 |
| MNDY | CALL | TRADE | BEARISH | 01/17/25 | $36.9 | $34.6 | $35.3 | $260.00 | $70.6K | 589 | 23 |
| MNDY | CALL | TRADE | BULLISH | 01/17/25 | $12.7 | $12.0 | $12.5 | $300.00 | $58.7K | 360 | 29 |
| MNDY | CALL | TRADE | NEUTRAL | 01/17/25 | $60.7 | $57.4 | $59.0 | $230.00 | $47.2K | 154 | 8 |
| MNDY | CALL | TRADE | BULLISH | 01/17/25 | $41.2 | $39.4 | $41.2 | $250.00 | $41.2K | 1.3K | 10 |
About Monday.Com
Monday.com is a provider of work management software delivered via a cloud-based software-as-a-service, or SaaS model. The firm’s solutions offer flexible and highly customizable tools to digitize business processes across countless use cases. Monday’s offering supports workflow management across departments, real-time visibility and accountability, and automation capabilities. Monday also offers prepackaged CRM and DevOps management solutions, in addition to standalone survey and digital whiteboard tools. As of 2023, Monday served over 225,000 customers in more than 200 countries.
Following our analysis of the options activities associated with Monday.Com, we pivot to a closer look at the company’s own performance.
Current Position of Monday.Com
- With a volume of 607,390, the price of MNDY is up 0.82% at $278.52.
- RSI indicators hint that the underlying stock may be approaching overbought.
- Next earnings are expected to be released in 80 days.
Expert Opinions on Monday.Com
A total of 5 professional analysts have given their take on this stock in the last 30 days, setting an average price target of $320.0.
Unusual Options Activity Detected: Smart Money on the Move
Benzinga Edge’s Unusual Options board spots potential market movers before they happen. See what positions big money is taking on your favorite stocks. Click here for access.
* Maintaining their stance, an analyst from Wells Fargo continues to hold a Overweight rating for Monday.Com, targeting a price of $330.
* Reflecting concerns, an analyst from DA Davidson lowers its rating to Neutral with a new price target of $300.
* An analyst from Needham persists with their Buy rating on Monday.Com, maintaining a target price of $350.
* An analyst from Piper Sandler has decided to maintain their Overweight rating on Monday.Com, which currently sits at a price target of $350.
* Maintaining their stance, an analyst from Baird continues to hold a Neutral rating for Monday.Com, targeting a price of $270.
Options are a riskier asset compared to just trading the stock, but they have higher profit potential. Serious options traders manage this risk by educating themselves daily, scaling in and out of trades, following more than one indicator, and following the markets closely.
If you want to stay updated on the latest options trades for Monday.Com, Benzinga Pro gives you real-time options trades alerts.
Market News and Data brought to you by Benzinga APIs
© 2024 Benzinga.com. Benzinga does not provide investment advice. All rights reserved.
These Analysts Slash Their Forecasts On PDD Holdings Following Q3 Results
PDD Holdings Inc PDD reported downbeat earnings for its fiscal third quarter 2024 on Thursday.
The company posted revenue growth of 44% year-on-year to $14.16 billion (68.84 billion Chinese yuan), missing the analyst consensus estimate of $14.47 billion. The Chinese online retailer’s adjusted earnings per ADS of $2.65 (18.59 Chinese yuan) increased from 11.61 Chinese yuan Y/Y, missing the analyst consensus estimate of $2.82. The stock plunged after the print.
Revenues from online marketing services and others rose 24% Y/Y to $7.03 billion. Revenues from transaction services jumped 72% Y/Y to $7.13 billion.
Adjusted operating profit grew by 48% Y/Y to $3.81 billion. PDD Holdings held $44.0 billion in cash and equivalents as of September 30, 2024. The company generated $3.92 billion in operating cash flow.
“Over the past quarter, our focus remained on driving the high-quality development of the platforms,” said Mr. Lei Chen, Chairman and Co-Chief Executive Officer of PDD Holdings. “We are committed to investing consistently and patiently in our platform ecosystem to deliver impactful results over the long run.”
PDD shares fell 4.8% to trade at $99.06 on Friday.
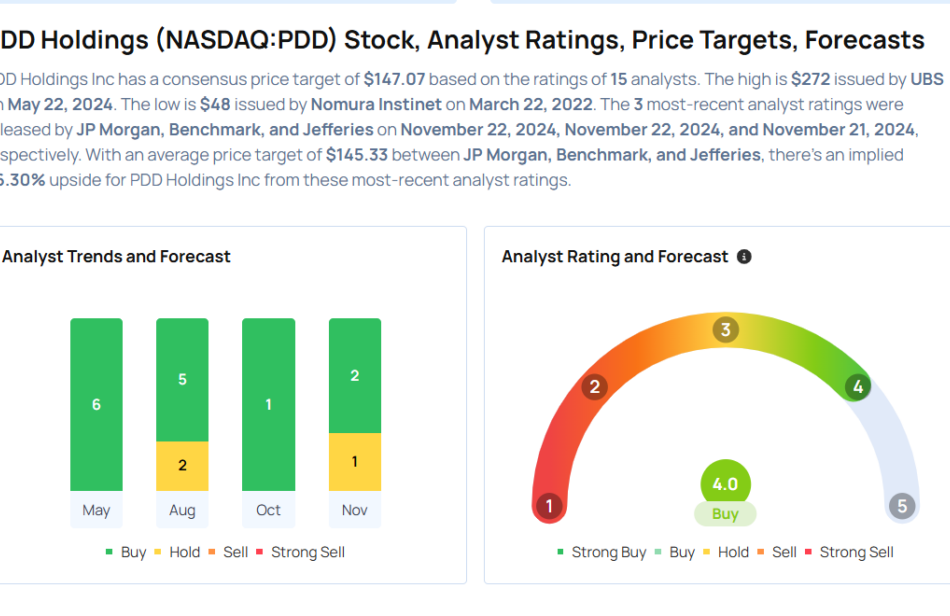
These analysts made changes to their price targets on PDD following earnings announcement.
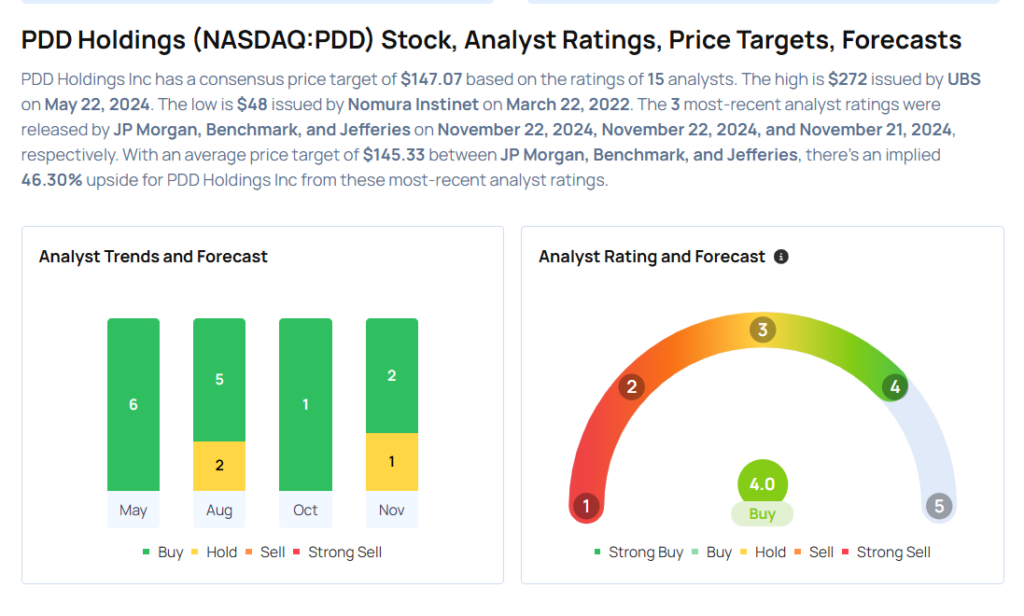
- JP Morgan analyst Andre Chang downgraded PDD Holdings from Overweight to Neutral and lowered the price target from $170 to $105.
- Benchmark analyst Fawne Jiang maintained PDD Holdings with a Buy and cut the price target from $185 to $160.
- Jefferies analyst Thomas Chong, on Thursday, maintained PDD with a Buy and lowered the price target from $181 to $171.
Considering buying PDD stock? Here’s what analysts think:
Read This Next:
Market News and Data brought to you by Benzinga APIs
© 2024 Benzinga.com. Benzinga does not provide investment advice. All rights reserved.
ExlService Holdings Board Member Trades $160K In Company Stock
JAYNIE STUDENMUND, Board Member at ExlService Holdings EXLS, executed a substantial insider sell on November 21, according to an SEC filing.
What Happened: A Form 4 filing from the U.S. Securities and Exchange Commission on Thursday showed that STUDENMUND sold 3,645 shares of ExlService Holdings. The total transaction amounted to $160,562.
Tracking the Friday’s morning session, ExlService Holdings shares are trading at $46.0, showing a up of 0.74%.
Unveiling the Story Behind ExlService Holdings
ExlService Holdings Inc. is a business process management company that provides digital operations and analytical services to clients driving enterprise-scale business transformation initiatives that leverage company’s deep expertise in analytics, AI, ML and cloud. The company offers business process outsourcing and automation services, and data-driven insights to customers across multiple industries. The company operates through four segments based on the products and services offered and markets served: Insurance, Healthcare, Emerging, Analytics. The vast majority of the company’s revenue is earned in the United States, and more than half of its revenue comes from Analytics segment.
A Deep Dive into ExlService Holdings’s Financials
Revenue Growth: ExlService Holdings’s revenue growth over a period of 3 months has been noteworthy. As of 30 September, 2024, the company achieved a revenue growth rate of approximately 14.87%. This indicates a substantial increase in the company’s top-line earnings. When compared to others in the Industrials sector, the company excelled with a growth rate higher than the average among peers.
Profitability Metrics: Unlocking Value
-
Gross Margin: The company shows a low gross margin of 37.76%, suggesting potential challenges in cost control and profitability compared to its peers.
-
Earnings per Share (EPS): With an EPS below industry norms, ExlService Holdings exhibits below-average bottom-line performance with a current EPS of 0.33.
Debt Management: With a below-average debt-to-equity ratio of 0.47, ExlService Holdings adopts a prudent financial strategy, indicating a balanced approach to debt management.
Evaluating Valuation:
-
Price to Earnings (P/E) Ratio: With a higher-than-average P/E ratio of 40.05, ExlService Holdings’s stock is perceived as being overvalued in the market.
-
Price to Sales (P/S) Ratio: With a relatively high Price to Sales ratio of 4.26 as compared to the industry average, the stock might be considered overvalued based on sales performance.
-
EV/EBITDA Analysis (Enterprise Value to its Earnings Before Interest, Taxes, Depreciation & Amortization): The company’s EV/EBITDA ratio 22.1 is above the industry average, suggesting that the market values the company more highly for each unit of EBITDA. This could be attributed to factors such as strong growth prospects or superior operational efficiency.
Market Capitalization Highlights: Above the industry average, the company’s market capitalization signifies a significant scale, indicating strong confidence and market prominence.
Now trade stocks online commission free with Charles Schwab, a trusted and complete investment firm.
The Impact of Insider Transactions on Investments
Insider transactions should be considered alongside other factors when making investment decisions, as they can offer important insights.
Considering the legal perspective, an “insider” is defined as any officer, director, or beneficial owner holding more than ten percent of a company’s equity securities, according to Section 12 of the Securities Exchange Act of 1934. This includes executives in the c-suite and major hedge funds. These insiders are mandated to disclose their transactions through a Form 4 filing, to be submitted within two business days of the transaction.
Pointing towards optimism, a company insider’s new purchase signals their positive anticipation for the stock to rise.
Nevertheless, insider sells may not necessarily indicate a bearish view and can be influenced by various factors.
Cracking Transaction Codes
Digging into the details of stock transactions, investors frequently turn their attention to those taking place in the open market, as outlined in Table I of the Form 4 filing. A P in Box 3 indicates a purchase, while S signifies a sale. Transaction code C signals the conversion of an option, and transaction code A denotes a grant, award, or other acquisition of securities from the company.
Check Out The Full List Of ExlService Holdings’s Insider Trades.
Insider Buying Alert: Profit from C-Suite Moves
Benzinga Edge reveals every insider trade in real-time. Don’t miss the next big stock move driven by insider confidence. Unlock this ultimate sentiment indicator now. Click here for access.
This article was generated by Benzinga’s automated content engine and reviewed by an editor.
Market News and Data brought to you by Benzinga APIs
© 2024 Benzinga.com. Benzinga does not provide investment advice. All rights reserved.
S&P 500 Moves Higher; Intuit Shares Fall Following Q1 Results
U.S. stocks traded higher toward the end of trading, with the Dow Jones index gaining by more than 350 points on Friday.
The Dow traded up 0.82% to 44,228.50 while the NASDAQ rose 0.14% to 18,998.27. The S&P 500 also rose, gaining, 0.31% to 5,966.91.
Check This Out: Top 3 Materials Stocks That Could Blast Off In November
Leading and Lagging Sectors
Consumer staples shares rose by 1.5% on Friday.
In trading on Friday, communication services shares fell by 0.6%.
Top Headline
Shares of Intuit Inc INTU fell over 5% on Friday after the company reported upbeat results for its first-quarter results, but issued weak forecast for the current quarter.
The company reported quarterly earnings of $2.50 per share, which beat the analyst consensus estimate of $2.35 per share. Quarterly revenue came in at $3.28 billion which beat the consensus estimate of $3.14 billion
Equities Trading UP
- Elastic N.V. ESTC shares shot up 16% to $109.17 after the company reported better-than-expected second-quarter financial results and issued FY25 guidance above estimates.
- Shares of Matthews International Corporation MATW got a boost, surging 19% to $30.26 following upbeat earnings.
- Replimune Group, Inc. REPL shares were also up, gaining 45% to $16.00 after the company on Thursday announced it received breakthrough therapy designation status for RP1 and will submit an RP1 biologics license application to the FDA under an accelerated approval pathway.
Equities Trading DOWN
- Autonomix Medical, Inc. AMIX shares dropped 55% to $6.11 after the company announced the pricing of a $9 million underwritten public offering.
- Shares of Aptose Biosciences Inc. APTO were down 43% to $0.1390 after the company announced the pricing of an $8 million public offering.
- Cemtrex, Inc. CETX was down, falling 41% to $0.1164 after the company announced its board approved a 1-for-35 reverse stock split.
Commodities
In commodity news, oil traded up 1.5% to $71.16 while gold traded up 1.1% at $2,704.00.
Silver traded up 1.1% to $31.275 on Friday, while copper fell 0.8% to $4.0940.
Euro zone
European shares were higher today. The eurozone’s STOXX 600 rose 1.12%, Germany’s DAX gained 0.77% and France’s CAC 40 rose 0.46%. Spain’s IBEX 35 Index rose 0.16%, while London’s FTSE 100 gained 1.35%.
The S&P Global UK composite PMI declined to 49.9 in November versus 51.8 in the previous month, while Eurozone composite PMI dipped to 48.1 in November from 50 in the prior month.
Asia Pacific Markets
Asian markets closed mixed on Friday, with Japan’s Nikkei 225 gaining 0.68%, Hong Kong’s Hang Seng Index falling 1.89%, China’s Shanghai Composite Index dipping 3.06% and India’s BSE Sensex gaining 2.54%.
Economics
- The S&P Global US Services PMI climbed to 57 in November versus 55 in the previous month, while manufacturing PMI increased to 48.8 in November from 48.5 in the previous month.
- The University of Michigan consumer sentiment for the US fell to 71.8 in November versus a preliminary reading of 73.
- The year-ahead inflation expectations in the U.S fell to 2.6% in November from 2.7% in October.
Now Read This: Wall Street’s Most Accurate Analysts Give Their Take On 3 Industrials Stocks With Over 3% Dividend Yields
Market News and Data brought to you by Benzinga APIs
© 2024 Benzinga.com. Benzinga does not provide investment advice. All rights reserved.


