Super Micro stock set to notch nearly 80% weekly gain as company hires new auditor
Super Micro Computer (SMCI) stock continued its rebound Friday, with shares on track to record a weekly gain of 78%.
Shares of Super Micro — the AI server maker that uses Nvidia’s (NVDA) chips and has a major deal with Elon Musk’s xAI — rose over 11% in Friday trading to roughly $33. Even with that gain, shares are still far below highs above $120 in March following SMCI’s addition to the S&P 500.
The stock’s rally kicked off Monday in anticipation of Super Micro’s submission of a compliance plan to the Nasdaq (^IXIC) as it looks to avoid delisting. Shares skyrocketed when the company officially announced it had submitted the plan and hired a new auditor, BDO. Super Micro’s prior accountant, Ernst & Young, resigned in late October.
Super Micro has been grappling with the fallout from an August report by short seller firm Hindenburg Research, which pointed to alleged accounting malpractices, violations of export controls, and shady relationships between top executives and Super Micro partners. Following the Hindenburg report, Super Micro delayed filing its annual 10-K and most recent quarterly 10-Q reports to the Securities and Exchange Commission, which put the company at risk of being delisted from the Nasdaq. Super Micro is also reportedly being investigated by the Department of Justice.
The deluge of bad news has sent shares tumbling over the last few months. EY’s resignation, in particular, pushed Super Micro stock down more than 30% in a single day in late October. The accountant wrote in its resignation letter that it was “unwilling to be associated with the financial statements prepared by [Super Micro] management.”
Adding to its woes, Super Micro’s fiscal first quarter earnings report on Nov. 5 missed Wall Street’s expectations. As Wedbush analyst Matthew Bryson wrote in a note to investors at the time, the company blamed lighter sales on delays of Nvidia’s Blackwell AI chips and issues with its SEC filings. Bryson maintains a Neutral rating on the stock and recently lowered his price target for shares to $24 from $32.
Other firms such as Barclays (BCS), Wells Fargo (WFC), and KeyBanc have suspended coverage of the stock.
Super Micro said Monday that it is on track to submit delayed filings to the SEC “and become current with its periodic reports within the discretionary period available to the Nasdaq staff to grant.”
Wedbush’s Bryson wrote in a separate note on Nov. 19 in response to Monday’s news, “We see retaining a new auditor is a significant positive step for SMCI as it resolves perhaps the most substantial concern regarding SMCI’s ability to remain listed … and creates a potential path for SMCI to file its financials and restore NASDAQ compliance.”
Spotlight on Alphabet: Analyzing the Surge in Options Activity
Financial giants have made a conspicuous bullish move on Alphabet. Our analysis of options history for Alphabet GOOGL revealed 45 unusual trades.
Delving into the details, we found 55% of traders were bullish, while 33% showed bearish tendencies. Out of all the trades we spotted, 15 were puts, with a value of $1,256,958, and 30 were calls, valued at $1,436,733.
Expected Price Movements
After evaluating the trading volumes and Open Interest, it’s evident that the major market movers are focusing on a price band between $110.0 and $300.0 for Alphabet, spanning the last three months.
Volume & Open Interest Development
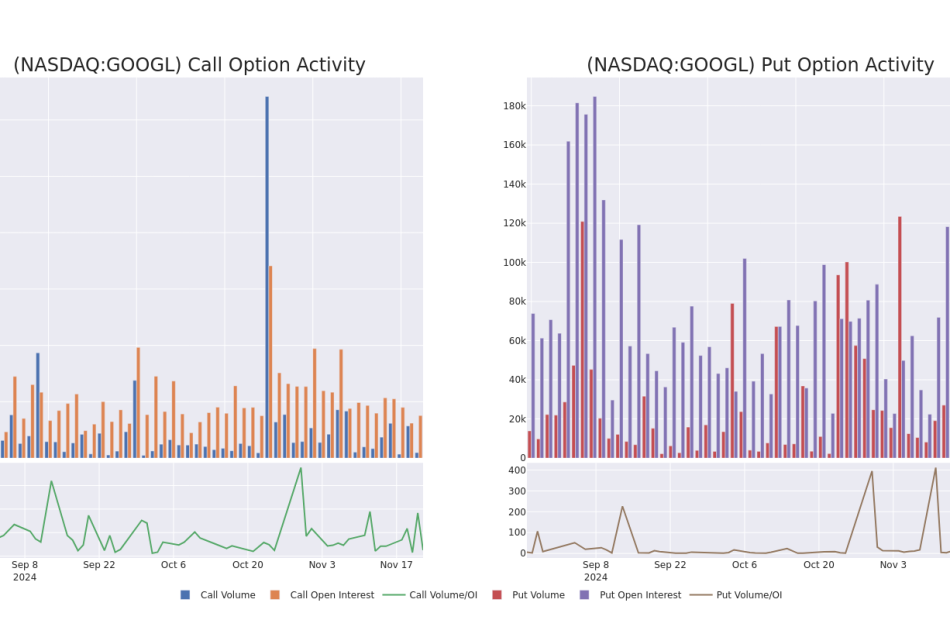
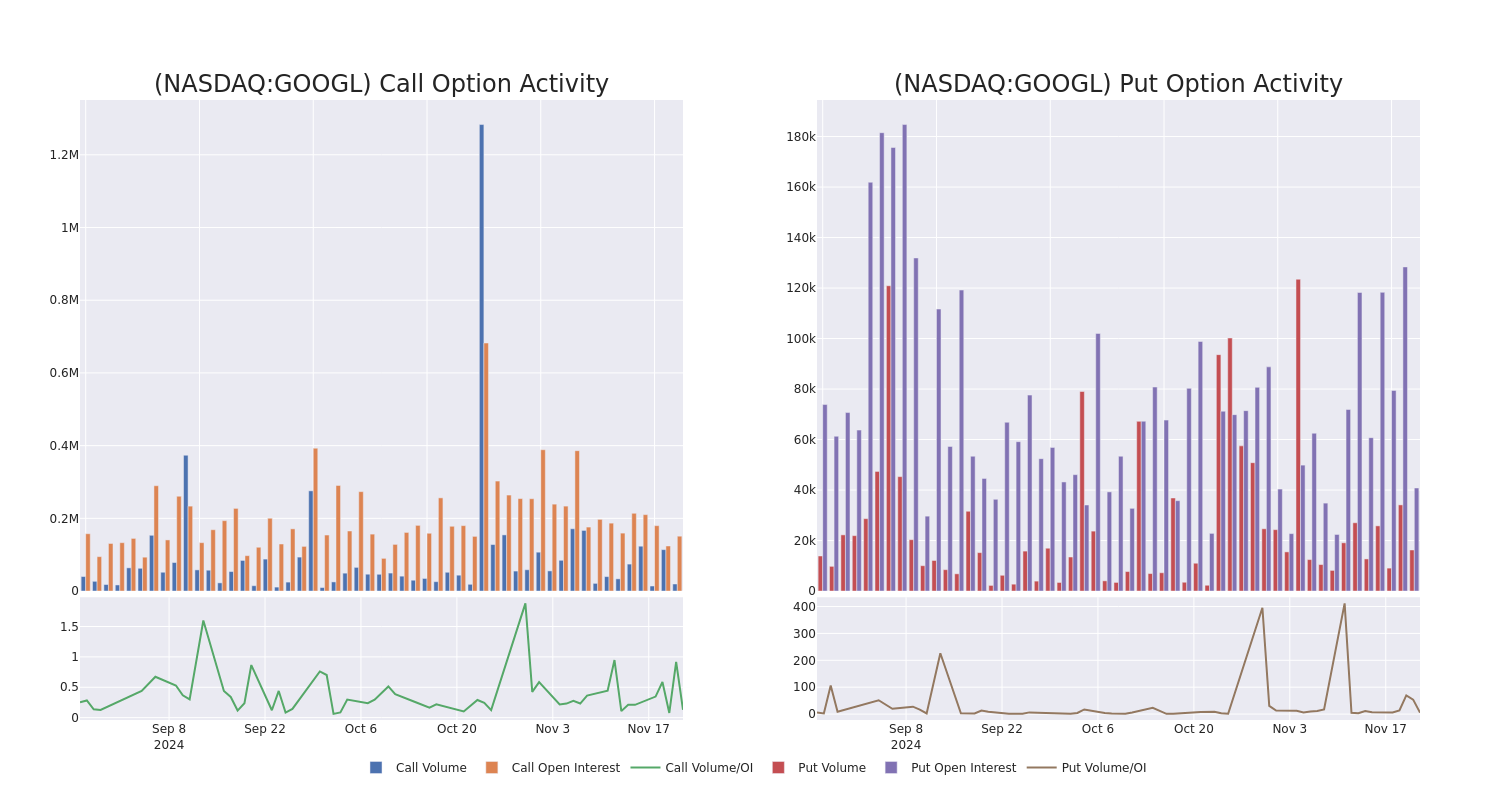
Assessing the volume and open interest is a strategic step in options trading. These metrics shed light on the liquidity and investor interest in Alphabet’s options at specified strike prices. The forthcoming data visualizes the fluctuation in volume and open interest for both calls and puts, linked to Alphabet’s substantial trades, within a strike price spectrum from $110.0 to $300.0 over the preceding 30 days.
Alphabet Call and Put Volume: 30-Day Overview
Noteworthy Options Activity:
| Symbol | PUT/CALL | Trade Type | Sentiment | Exp. Date | Ask | Bid | Price | Strike Price | Total Trade Price | Open Interest | Volume |
|---|---|---|---|---|---|---|---|---|---|---|---|
| GOOGL | PUT | TRADE | BULLISH | 12/19/25 | $4.85 | $4.7 | $4.7 | $130.00 | $305.5K | 591 | 662 |
| GOOGL | PUT | TRADE | BEARISH | 06/20/25 | $24.0 | $23.95 | $24.0 | $185.00 | $144.0K | 1.0K | 60 |
| GOOGL | CALL | TRADE | BEARISH | 06/20/25 | $41.9 | $41.85 | $41.85 | $130.00 | $125.5K | 1.1K | 30 |
| GOOGL | PUT | SWEEP | BULLISH | 04/17/25 | $8.0 | $7.9 | $7.9 | $160.00 | $115.3K | 3.3K | 318 |
| GOOGL | CALL | TRADE | BULLISH | 01/16/26 | $10.85 | $10.85 | $10.85 | $200.00 | $108.5K | 4.3K | 431 |
About Alphabet
Alphabet is a holding company that wholly owns internet giant Google. The California-based company derives slightly less than 90% of its revenue from Google services, the vast majority of which is advertising sales. Alongside online ads, Google services houses sales stemming from Google’s subscription services (YouTube TV, YouTube Music among others), platforms (sales and in-app purchases on Play Store), and devices (Chromebooks, Pixel smartphones, and smart home products such as Chromecast). Google’s cloud computing platform, or GCP, accounts for roughly 10% of Alphabet’s revenue with the firm’s investments in up-and-coming technologies such as self-driving cars (Waymo), health (Verily), and internet access (Google Fiber) making up the rest.
After a thorough review of the options trading surrounding Alphabet, we move to examine the company in more detail. This includes an assessment of its current market status and performance.
Present Market Standing of Alphabet
- With a volume of 23,824,736, the price of GOOGL is down -1.64% at $164.88.
- RSI indicators hint that the underlying stock is currently neutral between overbought and oversold.
- Next earnings are expected to be released in 67 days.
What The Experts Say On Alphabet
Over the past month, 5 industry analysts have shared their insights on this stock, proposing an average target price of $202.8.
Turn $1000 into $1270 in just 20 days?
20-year pro options trader reveals his one-line chart technique that shows when to buy and sell. Copy his trades, which have had averaged a 27% profit every 20 days. Click here for access.
* Consistent in their evaluation, an analyst from Loop Capital keeps a Hold rating on Alphabet with a target price of $185.
* An analyst from Wells Fargo persists with their Equal-Weight rating on Alphabet, maintaining a target price of $187.
* Maintaining their stance, an analyst from Keybanc continues to hold a Overweight rating for Alphabet, targeting a price of $215.
* An analyst from B of A Securities has decided to maintain their Buy rating on Alphabet, which currently sits at a price target of $210.
* Reflecting concerns, an analyst from BMO Capital lowers its rating to Outperform with a new price target of $217.
Options are a riskier asset compared to just trading the stock, but they have higher profit potential. Serious options traders manage this risk by educating themselves daily, scaling in and out of trades, following more than one indicator, and following the markets closely.
If you want to stay updated on the latest options trades for Alphabet, Benzinga Pro gives you real-time options trades alerts.
Market News and Data brought to you by Benzinga APIs
© 2024 Benzinga.com. Benzinga does not provide investment advice. All rights reserved.
Small Caps Rally, Gold Poised For Best Week Since March 2023, Bitcoin Tops $99,000: What's Driving Markets Friday?
Risk appetite remained robust in the final trading session of the week, with all major U.S. indices poised to close the week in positive territory. Small-cap stocks outperformed their large-cap counterparts, continuing their recent streak of dominance.
Fresh business surveys highlighted a notable health in the U.S. economy, with private sector activity recording its strongest expansion in over two and a half years. The services sector, in particular, showed remarkable growth, maintaining its rapid pace of expansion.
The Russell 2000, a benchmark for small-cap equities, surged 1.7% on Friday, building on a 1.5% gain from the previous session. The S&P 500 edged higher, heading for a five-day winning streak, and the Dow Jones Industrial Average climbed past the 44,000 mark, moving tantalizingly close to record highs. Technology stocks posted more modest gains.
The U.S. Dollar Index, tracked via the Invesco DB USD Index Bullish Fund ETF UUP, extended its rally for an eighth consecutive week—the longest streak in 14 months—surpassing the 107 level to hit a two-year high. The dollar’s strength was fueled by a mix of robust U.S. economic data and economic malaise in Europe.
In commodities, gold climbed for a fifth straight session, advancing 5.6% for the week, its best weekly performance since March 2023.
Bitcoin BTC/USD also maintained its bullish momentum, soaring past $99,000 and edging closer to the highly anticipated $100,000 milestone.
Friday’s Performance In Major US Indices, ETFs
| Major Indices | Price | 1-day %chg |
| Russell 2000 | 2,401.00 | 1.7% |
| Dow Jones | 44,211.20 | 0.8% |
| S&P 500 | 5,969.01 | 0.4% |
| Nasdaq 100 | 20,768.99 | 0.1% |
According to Benzinga Pro data:
- The SPDR S&P 500 ETF Trust SPY rose 0.4% to $595.75.
- The SPDR Dow Jones Industrial Average DIA rose 0.8% to $442.49.
- The tech-heavy Invesco QQQ Trust Series QQQ inched 0.2% up to $506.20.
- The iShares Russell 2000 ETF IWM rallied 1.8% to $238.61.
- The Consumer Discretionary Sector Select Sector SPDR Fund XLY outperformed, rising 1.6%. The Utilities Select Sector SPDR Fund XLU lagged, down 0.1%.
Friday’s Stock Movers
- Intuit Inc. INTU fell 4.4% in reaction to quarterly earnings.
- Other stocks reacting to earnings reports were Copart Inc. CPRT, up 9.8%, Ross Stores Inc. ROSS, up 3.1%, and NetApp Inc. NTAP, down 2.7%.
Read Next:
Image created using artificial intelligence via Midjourney.
Market News and Data brought to you by Benzinga APIs
© 2024 Benzinga.com. Benzinga does not provide investment advice. All rights reserved.
These Analysts Increase Their Forecasts On Gap Following Better-Than-Expected Earnings
The Gap, Inc. GAP reported better-than-expected earnings for its second quarter and raised its outlook for FY24 gross margin.
Gap reported quarterly earnings of 72 cents per share, which beat the analyst consensus estimate of 57 cents. Quarterly revenue came in at $3.82 billion, which beat the consensus estimate of $3.81 billion and is an increase over sales of $3.76 billion from the same period last year.
“I’m proud that Gap Inc. delivered another successful quarter, growing net sales for the fourth consecutive quarter and gaining market share across all brands while meaningfully expanding operating margin,” said Gap CEO Richard Dickson.
Gap raised its full-year outlook for net sales, gross margin and operating income growth compared to prior expectations. The company now sees net sales up 1.5% to 2%, gross margin growth of 220 basis points and operating income margin of mid-to-high 60%.
Gap shares gained 10.7% to trade at $24.41 on Friday.
These analysts made changes to their price targets on Gap following earnings announcement.
- B of A Securities maintained Gap with a Neutral and raised the price target from $25 to $28.
- Morgan Stanley analyst Alex Straton maintained Gap with an Overweight and raised the price target from $29 to $30.
- Barclays analyst Adrienne Yih maintained the stock with an Overweight and raised the price target from $31 to $32.
- Wells Fargo analyst Ike Boruchow maintained Gap with an Overweight and raised the price target from $28 to $30.
- Evercore ISI Group analyst Michael Binetti maintained the stock with an Outperform and increased the price target from $32 to $33.
- JP Morgan analyst Matthew Boss maintained Gap with a Neutral and boosted the price target from $26 to $28.
- BMO Capital analyst Simeon Siegel maintained Gap with a Market Perform and raised the price target from $23 to $25.
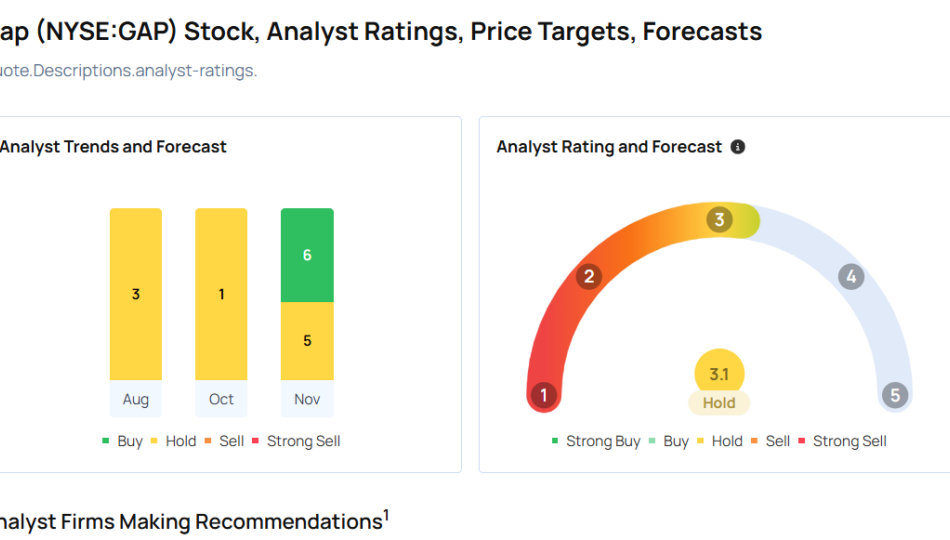
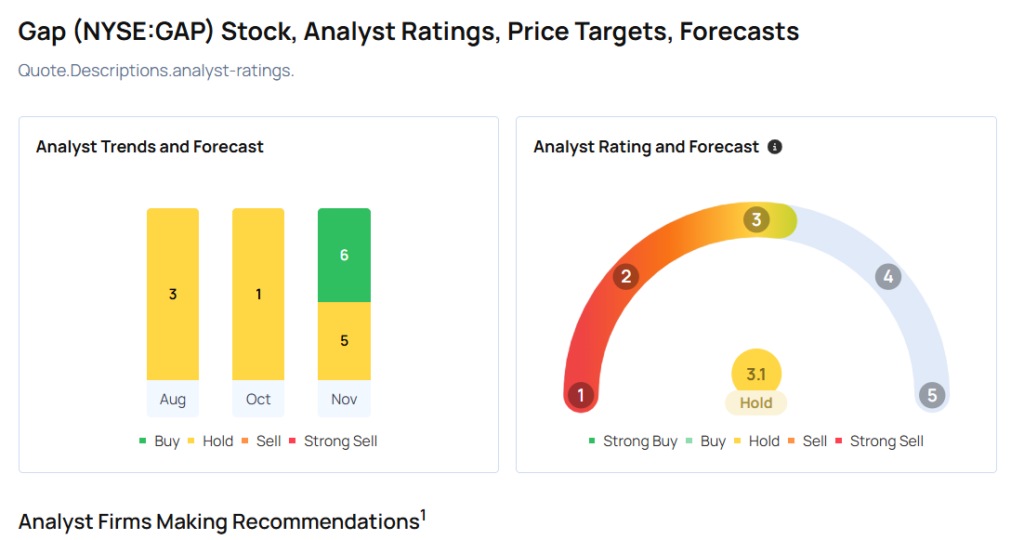
- Considering buying GAP stock? Here’s what analysts think:
Read This Next:
Market News and Data brought to you by Benzinga APIs
© 2024 Benzinga.com. Benzinga does not provide investment advice. All rights reserved.
Price Over Earnings Overview: Automatic Data Processing
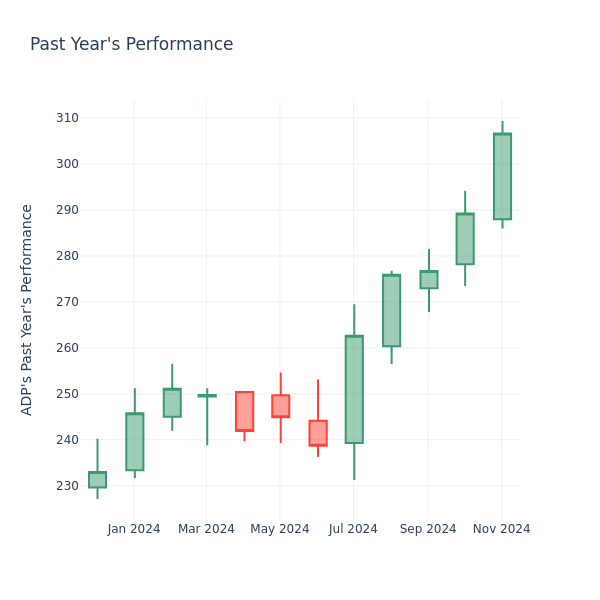
In the current market session, Automatic Data Processing Inc. ADP stock price is at $304.09, after a 0.16% drop. However, over the past month, the company’s stock went up by 6.49%, and in the past year, by 33.82%. Shareholders might be interested in knowing whether the stock is overvalued, even if the company is not performing up to par in the current session.
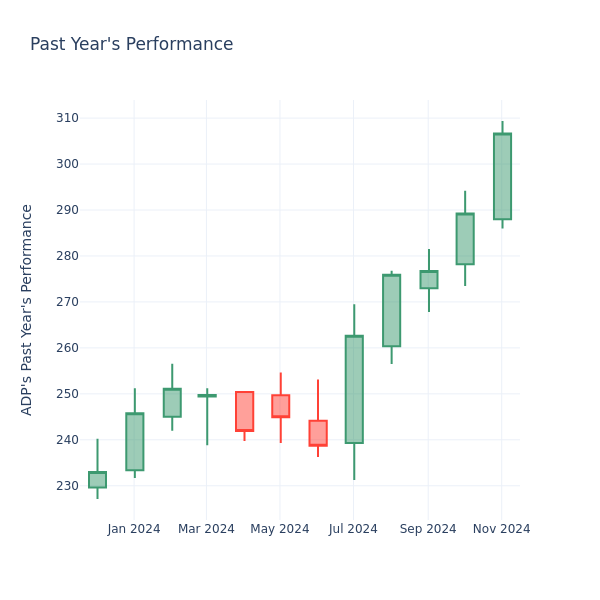
A Look at Automatic Data Processing P/E Relative to Its Competitors
The P/E ratio measures the current share price to the company’s EPS. It is used by long-term investors to analyze the company’s current performance against it’s past earnings, historical data and aggregate market data for the industry or the indices, such as S&P 500. A higher P/E indicates that investors expect the company to perform better in the future, and the stock is probably overvalued, but not necessarily. It also could indicate that investors are willing to pay a higher share price currently, because they expect the company to perform better in the upcoming quarters. This leads investors to also remain optimistic about rising dividends in the future.
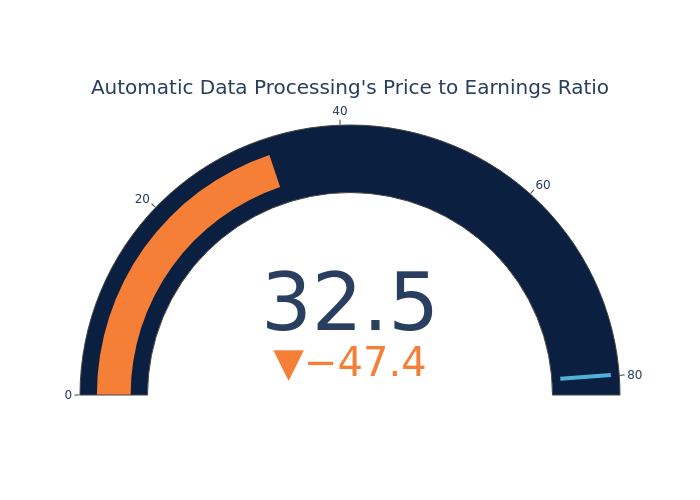
Compared to the aggregate P/E ratio of the 79.91 in the Professional Services industry, Automatic Data Processing Inc. has a lower P/E ratio of 32.54. Shareholders might be inclined to think that the stock might perform worse than it’s industry peers. It’s also possible that the stock is undervalued.
In summary, while the price-to-earnings ratio is a valuable tool for investors to evaluate a company’s market performance, it should be used with caution. A low P/E ratio can be an indication of undervaluation, but it can also suggest weak growth prospects or financial instability. Moreover, the P/E ratio is just one of many metrics that investors should consider when making investment decisions, and it should be evaluated alongside other financial ratios, industry trends, and qualitative factors. By taking a comprehensive approach to analyzing a company’s financial health, investors can make well-informed decisions that are more likely to lead to successful outcomes.
Market News and Data brought to you by Benzinga APIs
© 2024 Benzinga.com. Benzinga does not provide investment advice. All rights reserved.
Sell Alert: Keith Smith Cashes Out $2.15M In Boyd Gaming Stock
A substantial insider sell was reported on November 21, by Keith Smith, President and CEO at Boyd Gaming BYD, based on the recent SEC filing.
What Happened: Smith’s recent move involves selling 30,000 shares of Boyd Gaming. This information is documented in a Form 4 filing with the U.S. Securities and Exchange Commission on Thursday. The total value is $2,153,100.
During Friday’s morning session, Boyd Gaming shares down by 2.29%, currently priced at $69.88.
About Boyd Gaming
Boyd Gaming Corp is a multi-jurisdictional gaming company. The company operates wholly-owned gaming entertainment properties (casino space, slot machines, table games, and hotel rooms) in Nevada, Illinois, Indiana, Iowa, Kansas, Louisiana, Mississippi, Missouri, Ohio, and Pennsylvania. Geographical regions separate its business segments: Las Vegas Locals, Downtown Las Vegas, Midwest and South, and Online. Midwest and South hold the key number of entertainment properties, and it generate the majority of sales for the company.
Boyd Gaming: Delving into Financials
Revenue Growth: Boyd Gaming displayed positive results in 3 months. As of 30 September, 2024, the company achieved a solid revenue growth rate of approximately 6.43%. This indicates a notable increase in the company’s top-line earnings. As compared to competitors, the company surpassed expectations with a growth rate higher than the average among peers in the Consumer Discretionary sector.
Navigating Financial Profits:
-
Gross Margin: The company sets a benchmark with a high gross margin of 51.95%, reflecting superior cost management and profitability compared to its peers.
-
Earnings per Share (EPS): Boyd Gaming’s EPS outshines the industry average, indicating a strong bottom-line trend with a current EPS of 1.43.
Debt Management: With a below-average debt-to-equity ratio of 2.35, Boyd Gaming adopts a prudent financial strategy, indicating a balanced approach to debt management.
Valuation Overview:
-
Price to Earnings (P/E) Ratio: The current P/E ratio of 13.6 is below industry norms, indicating potential undervaluation and presenting an investment opportunity.
-
Price to Sales (P/S) Ratio: The current P/S ratio of 1.78 is below industry norms, suggesting potential undervaluation and presenting an investment opportunity for those considering sales performance.
-
EV/EBITDA Analysis (Enterprise Value to its Earnings Before Interest, Taxes, Depreciation & Amortization): Indicated by a lower-than-industry-average EV/EBITDA ratio of 9.05, the company suggests a potential undervaluation, which might be advantageous for value-focused investors.
Market Capitalization Analysis: The company exhibits a lower market capitalization profile, positioning itself below industry averages. This suggests a smaller scale relative to peers.
Now trade stocks online commission free with Charles Schwab, a trusted and complete investment firm.
Understanding the Significance of Insider Transactions
Considering insider transactions is valuable, but it’s crucial to evaluate them in conjunction with other investment factors.
In the context of legal matters, the term “insider” refers to any officer, director, or beneficial owner holding more than ten percent of a company’s equity securities, as outlined by Section 12 of the Securities Exchange Act of 1934. This includes executives in the c-suite and significant hedge funds. Such insiders are obligated to report their transactions through a Form 4 filing, which must be completed within two business days of the transaction.
Pointing towards optimism, a company insider’s new purchase signals their positive anticipation for the stock to rise.
Despite insider sells not always signaling a bearish sentiment, they can be driven by various factors.
Exploring Key Transaction Codes
Navigating through the landscape of transactions, investors often prioritize those unfolding in the open market, precisely detailed in Table I of the Form 4 filing. A P in Box 3 denotes a purchase, while S signifies a sale. Transaction code C signals the conversion of an option, and transaction code A denotes a grant, award, or other acquisition of securities from the company.
Check Out The Full List Of Boyd Gaming’s Insider Trades.
Insider Buying Alert: Profit from C-Suite Moves
Benzinga Edge reveals every insider trade in real-time. Don’t miss the next big stock move driven by insider confidence. Unlock this ultimate sentiment indicator now. Click here for access.
This article was generated by Benzinga’s automated content engine and reviewed by an editor.
Market News and Data brought to you by Benzinga APIs
© 2024 Benzinga.com. Benzinga does not provide investment advice. All rights reserved.
A Preview Of Freightos's Earnings
Freightos CRGO is set to give its latest quarterly earnings report on Monday, 2024-11-25. Here’s what investors need to know before the announcement.
Analysts estimate that Freightos will report an earnings per share (EPS) of $-0.16.
The announcement from Freightos is eagerly anticipated, with investors seeking news of surpassing estimates and favorable guidance for the next quarter.
It’s worth noting for new investors that guidance can be a key determinant of stock price movements.
Freightos Share Price Analysis
Shares of Freightos were trading at $2.4 as of November 21. Over the last 52-week period, shares are down 17.17%. Given that these returns are generally negative, long-term shareholders are likely upset going into this earnings release.
To track all earnings releases for Freightos visit their earnings calendar on our site.
This article was generated by Benzinga’s automated content engine and reviewed by an editor.
Market News and Data brought to you by Benzinga APIs
© 2024 Benzinga.com. Benzinga does not provide investment advice. All rights reserved.
Looking At YPF's Recent Unusual Options Activity
Investors with a lot of money to spend have taken a bullish stance on YPF YPF.
And retail traders should know.
We noticed this today when the positions showed up on publicly available options history that we track here at Benzinga.
Whether these are institutions or just wealthy individuals, we don’t know. But when something this big happens with YPF, it often means somebody knows something is about to happen.
Today, Benzinga’s options scanner spotted 10 options trades for YPF.
This isn’t normal.
The overall sentiment of these big-money traders is split between 70% bullish and 20%, bearish.
Out of all of the options we uncovered, there was 1 put, for a total amount of $132,750, and 9, calls, for a total amount of $350,675.
Expected Price Movements
Taking into account the Volume and Open Interest on these contracts, it appears that whales have been targeting a price range from $15.0 to $43.0 for YPF over the last 3 months.
Insights into Volume & Open Interest
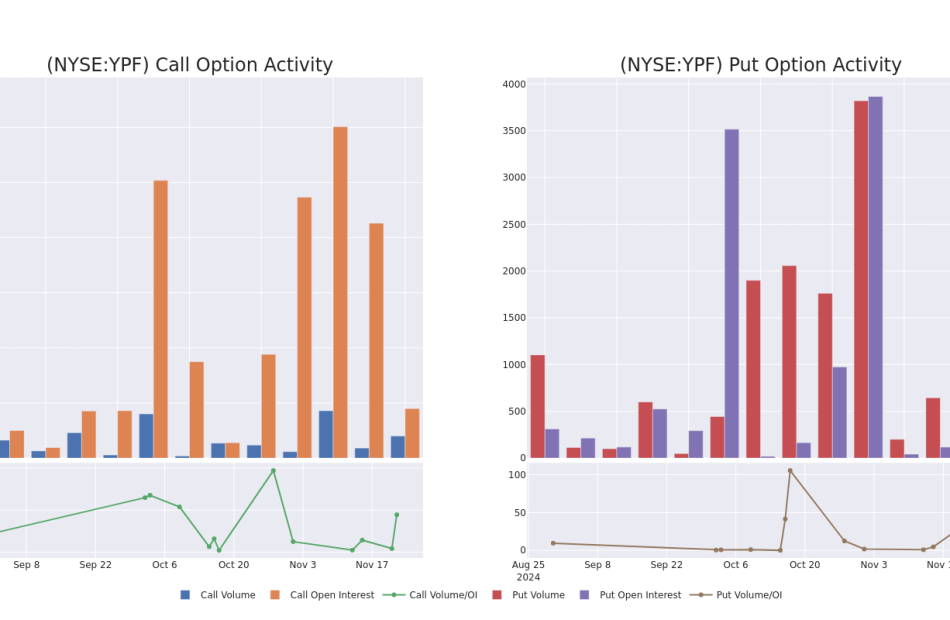
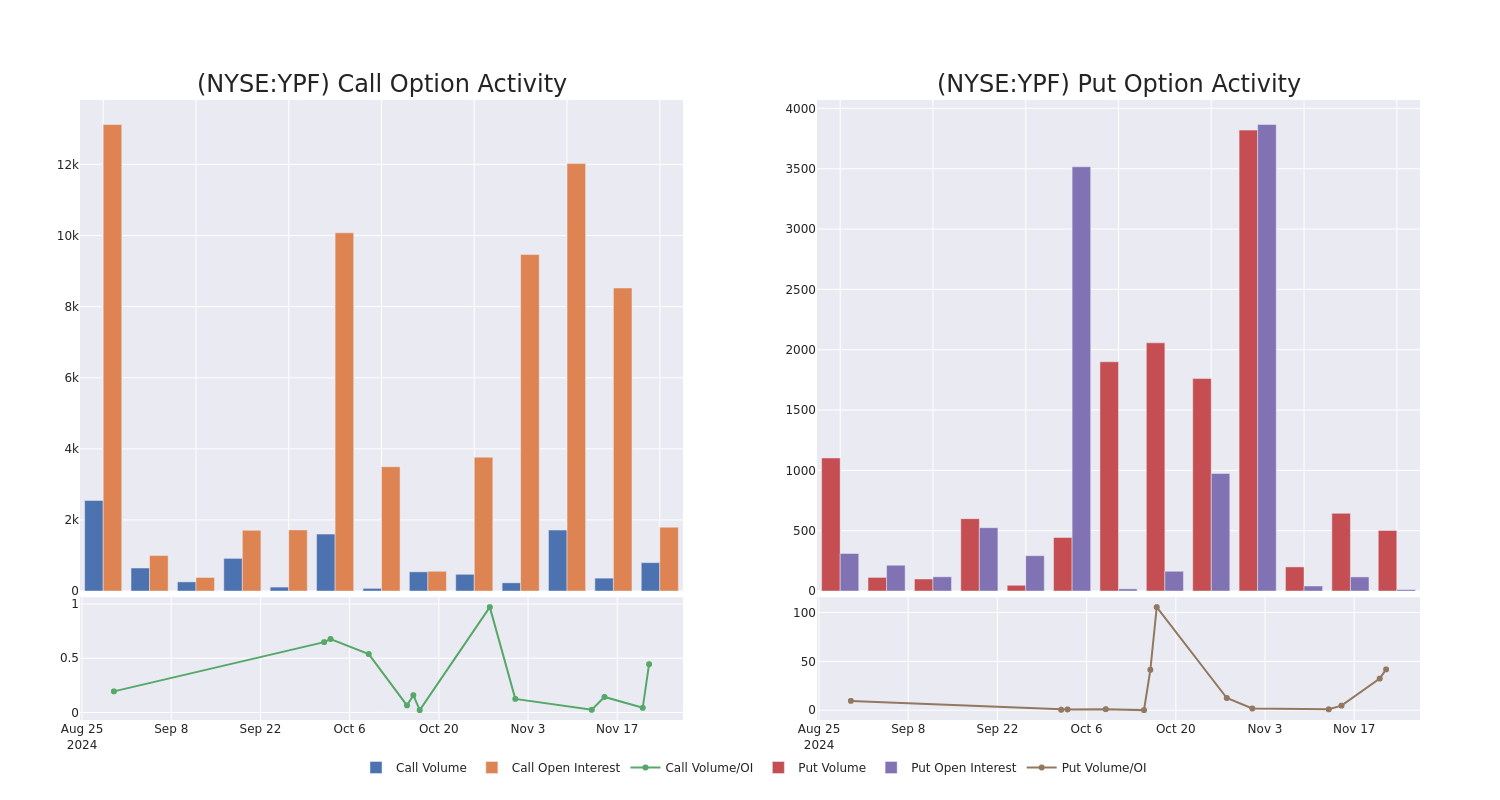
Assessing the volume and open interest is a strategic step in options trading. These metrics shed light on the liquidity and investor interest in YPF’s options at specified strike prices. The forthcoming data visualizes the fluctuation in volume and open interest for both calls and puts, linked to YPF’s substantial trades, within a strike price spectrum from $15.0 to $43.0 over the preceding 30 days.
YPF Option Activity Analysis: Last 30 Days
Noteworthy Options Activity:
| Symbol | PUT/CALL | Trade Type | Sentiment | Exp. Date | Ask | Bid | Price | Strike Price | Total Trade Price | Open Interest | Volume |
|---|---|---|---|---|---|---|---|---|---|---|---|
| YPF | PUT | SWEEP | BULLISH | 04/17/25 | $4.5 | $4.4 | $4.5 | $40.00 | $132.7K | 12 | 502 |
| YPF | CALL | TRADE | BEARISH | 01/16/26 | $27.1 | $25.0 | $25.0 | $15.00 | $75.0K | 358 | 30 |
| YPF | CALL | SWEEP | BULLISH | 07/18/25 | $4.9 | $4.7 | $4.8 | $42.00 | $60.4K | 134 | 181 |
| YPF | CALL | TRADE | BEARISH | 01/16/26 | $20.5 | $18.7 | $18.7 | $22.00 | $37.4K | 464 | 30 |
| YPF | CALL | SWEEP | BULLISH | 01/17/25 | $1.25 | $1.15 | $1.25 | $43.00 | $33.7K | 0 | 270 |
About YPF
YPF SA is an Argentina-based integrated oil and gas company. It is engaged in operating a fully integrated oil and gas chain across the domestic upstream, downstream, and gas and power segments. The company’s upstream operations consist of the exploration, development, and production of crude oil, natural gas, and LPG. Its downstream operations include the refining, marketing, transportation, and distribution of oil and a wide range of petroleum products, petroleum derivatives, petrochemicals, LPG, and bio-fuels. The company generates maximum revenue from the downstream segment.
In light of the recent options history for YPF, it’s now appropriate to focus on the company itself. We aim to explore its current performance.
Where Is YPF Standing Right Now?
- Currently trading with a volume of 3,532,859, the YPF’s price is up by 7.77%, now at $40.38.
- RSI readings suggest the stock is currently may be overbought.
- Anticipated earnings release is in 11 days.
What Analysts Are Saying About YPF
1 market experts have recently issued ratings for this stock, with a consensus target price of $25.0.
Unusual Options Activity Detected: Smart Money on the Move
Benzinga Edge’s Unusual Options board spots potential market movers before they happen. See what positions big money is taking on your favorite stocks. Click here for access.
* Consistent in their evaluation, an analyst from JP Morgan keeps a Neutral rating on YPF with a target price of $25.
Options trading presents higher risks and potential rewards. Astute traders manage these risks by continually educating themselves, adapting their strategies, monitoring multiple indicators, and keeping a close eye on market movements. Stay informed about the latest YPF options trades with real-time alerts from Benzinga Pro.
Market News and Data brought to you by Benzinga APIs
© 2024 Benzinga.com. Benzinga does not provide investment advice. All rights reserved.
These Analysts Cut Their Forecasts On Warner Music Following Q4 Earnings
Warner Music Group Corp WMG reported downbeat fiscal fourth-quarter 2024 earnings on Thursday.
GAAP EPS of 8 cents missed the analyst consensus estimate of 27 cents. Revenue grew 2.8% year-on-year to $1.63 billion, beating the analyst consensus estimate of $1.59 billion.
Recorded Music revenue grew by 4.0% Y/Y at $1.34 billion in the quarter. Music Publishing revenue decreased by 1.0% Y/Y to $295 million. Digital revenue remained flat Y/Y at $1.07 billion.
Adjusted OIBDA increased by 11.4% compared to the previous year, reaching $353 million, and the margin improved by 170 basis points to 21.7%, driven by strong operating performance and savings from the company’s restructuring plans.
“Our performance this quarter and this year demonstrated our strength and adaptability in a thriving, fast-moving market,” said Robert Kyncl, CEO, Warner Music Group. “We continue to evolve WMG, based on the principle that simplicity and focus drive higher intensity and global impact. This is enhancing our ability to attract original artists and songwriters at all stages of their careers, helping them realize their musical visions, and grow passionate, loyal fanbases.”
Warner Music shares gained 2.7% to trade at $32.01 on Friday.
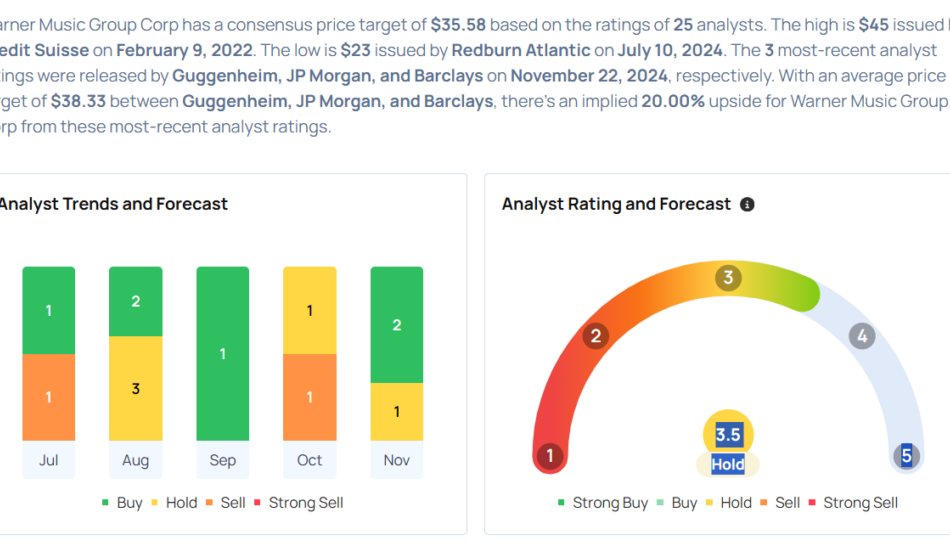
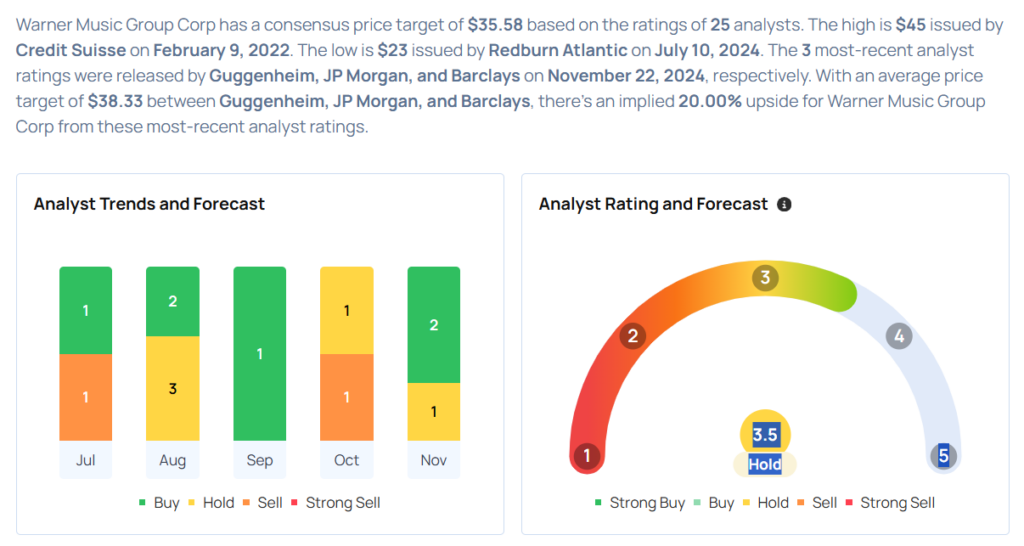
These analysts made changes to their price targets on Warner Music following earnings announcement.
- Barclays analyst Kannan Venkateshwar maintained Warner Music with an Equal-Weight rating and lowered the price target from $32 to $31.
- JP Morgan analyst David Karnovsky maintained the stock with an Overweight and lowered the price target from $41 to $40.
- Guggenheim analyst Michael Morris reiterated Warner Music with a Buy and maintained a $44 price target.
Considering buying WMG stock? Here’s what analysts think:
Read This Next:
Market News and Data brought to you by Benzinga APIs
© 2024 Benzinga.com. Benzinga does not provide investment advice. All rights reserved.
Crude Oil Gains Over 1%; Ross Stores Earnings Top Views
U.S. stocks traded mostly higher midway through trading, with the Dow Jones index gaining by more than 250 points on Friday.
The Dow traded up 0.59% to 44,128.84 while the NASDAQ rose 0.08% to 18,986.80. The S&P 500 also rose, gaining, 0.28% to 5,965.15.
Check This Out: Top 3 Materials Stocks That Could Blast Off In November
Leading and Lagging Sectors
Consumer staples shares rose by 1.5% on Friday.
In trading on Friday, communication services shares fell by 0.6%.
Top Headline
Ross Stores ROST reported better-than-expected third-quarter EPS results.
The company said it sees FY25 earnings of $6.10 to $6.17 per share
Equities Trading UP
- Elastic N.V. ESTC shares shot up 16% to $109.17 after the company reported better-than-expected second-quarter financial results and issued FY25 guidance above estimates.
- Shares of Matthews International Corporation MATW got a boost, surging 19% to $30.26 following upbeat earnings.
- Replimune Group, Inc. REPL shares were also up, gaining 45% to $16.00 after the company on Thursday announced it received breakthrough therapy designation status for RP1 and will submit an RP1 biologics license application to the FDA under an accelerated approval pathway.
Equities Trading DOWN
- Autonomix Medical, Inc. AMIX shares dropped 55% to $6.11 after the company announced the pricing of a $9 million underwritten public offering.
- Shares of Aptose Biosciences Inc. APTO were down 43% to $0.1390 after the company announced the pricing of an $8 million public offering.
- Cemtrex, Inc. CETX was down, falling 41% to $0.1164 after the company announced its board approved a 1-for-35 reverse stock split.
Commodities
In commodity news, oil traded up 1.5% to $71.16 while gold traded up 1.1% at $2,704.00.
Silver traded up 1.1% to $31.275 on Friday, while copper fell 0.8% to $4.0940.
Euro zone
European shares were higher today. The eurozone’s STOXX 600 rose 1.12%, Germany’s DAX gained 0.77% and France’s CAC 40 rose 0.46%. Spain’s IBEX 35 Index rose 0.16%, while London’s FTSE 100 gained 1.35%.
The S&P Global UK composite PMI declined to 49.9 in November versus 51.8 in the previous month, while Eurozone composite PMI dipped to 48.1 in November from 50 in the prior month.
Asia Pacific Markets
Asian markets closed mixed on Friday, with Japan’s Nikkei 225 gaining 0.68%, Hong Kong’s Hang Seng Index falling 1.89%, China’s Shanghai Composite Index dipping 3.06% and India’s BSE Sensex gaining 2.54%.
Economics
- The S&P Global US Services PMI climbed to 57 in November versus 55 in the previous month, while manufacturing PMI increased to 48.8 in November from 48.5 in the previous month.
- The University of Michigan consumer sentiment for the US fell to 71.8 in November versus a preliminary reading of 73.
- The year-ahead inflation expectations in the U.S fell to 2.6% in November from 2.7% in October.
Now Read This:
Market News and Data brought to you by Benzinga APIs
© 2024 Benzinga.com. Benzinga does not provide investment advice. All rights reserved.

