ROSEN, LEADING INVESTOR COUNSEL, Encourages Rentokil Initial plc Investors to Secure Counsel Before Important Deadline in Securities Class Action – RTO
NEW YORK, Nov. 28, 2024 (GLOBE NEWSWIRE) —
WHY: Rosen Law Firm, a global investor rights law firm, announces the filing of a class action lawsuit on behalf of purchasers of American Depositary Shares (“ADS”) of Rentokil Initial plc RTO between December 1, 2023 and September 10, 2024, both dates inclusive (the “Class Period”). A class action lawsuit has already been filed. If you wish to serve as lead plaintiff, you must move the Court no later than January 27, 2025.
SO WHAT: If you purchased Rentokil American Depositary Shares during the Class Period you may be entitled to compensation without payment of any out of pocket fees or costs through a contingency fee arrangement.
WHAT TO DO NEXT: To join the Rentokil class action, go to https://rosenlegal.com/submit-form/?case_id=31778 or call Phillip Kim, Esq. toll-free at 866-767-3653 or email case@rosenlegal.com for information on the class action. A class action lawsuit has already been filed. If you wish to serve as lead plaintiff, you must move the Court no later than January 27, 2025. A lead plaintiff is a representative party acting on behalf of other class members in directing the litigation.
WHY ROSEN LAW: We encourage investors to select qualified counsel with a track record of success in leadership roles. Often, firms issuing notices do not have comparable experience, resources, or any meaningful peer recognition. Be wise in selecting counsel. The Rosen Law Firm represents investors throughout the globe, concentrating its practice in securities class actions and shareholder derivative litigation. Rosen Law Firm achieved the largest ever securities class action settlement against a Chinese Company at the time. Rosen Law Firm was Ranked No. 1 by ISS Securities Class Action Services for number of securities class action settlements in 2017. The firm has been ranked in the top 4 each year since 2013 and has recovered hundreds of millions of dollars for investors. In 2019 alone the firm secured over $438 million for investors. In 2020, founding partner Laurence Rosen was named by law360 as a Titan of Plaintiffs’ Bar. Many of the firm’s attorneys have been recognized by Lawdragon and Super Lawyers.
DETAILS OF THE CASE: According to the lawsuit, defendants made false and/or misleading statements and/or failed to disclose that: (1) Rentokil experienced levels of disruption in the early pilots of the Terminix integration; (2) Rentokil experienced significant, ongoing, self-inflicted execution challenges integrating Terminix; (3) the disruption and execution challenges imperiled Rentokil’s integration plan for Terminix; (4) Rentokil and Terminix were still two separate businesses that were not yet integrated; (5) Rentokil’s failure to integrate Terminix negatively impacted the Rentokil’s business and operations, particularly organic revenue growth in North America; and (6) as a result of the above, defendants’ positive statements about the Rentokil’s business, operations, and prospects were materially false and misleading and/or lacked a reasonable basis at all relevant times. When the true details entered the market, the lawsuit claims that investors suffered damages.
To join the Rentokil class action, go to https://rosenlegal.com/submit-form/?case_id=31778 or call Phillip Kim, Esq. toll-free at 866-767-3653 or email case@rosenlegal.com for information on the class action.
No Class Has Been Certified. Until a class is certified, you are not represented by counsel unless you retain one. You may select counsel of your choice. You may also remain an absent class member and do nothing at this point. An investor’s ability to share in any potential future recovery is not dependent upon serving as lead plaintiff.
Follow us for updates on LinkedIn: https://www.linkedin.com/company/the-rosen-law-firm or on Twitter: https://twitter.com/rosen_firm or on Facebook: https://www.facebook.com/rosenlawfirm.
Attorney Advertising. Prior results do not guarantee a similar outcome.
Contact Information:
Laurence Rosen, Esq.
Phillip Kim, Esq.
The Rosen Law Firm, P.A.
275 Madison Avenue, 40th Floor
New York, NY 10016
Tel: (212) 686-1060
Toll Free: (866) 767-3653
Fax: (212) 202-3827
case@rosenlegal.com
www.rosenlegal.com

Market News and Data brought to you by Benzinga APIs
© 2024 Benzinga.com. Benzinga does not provide investment advice. All rights reserved.
$8 Billion Deal, Luxe Apartments and A Central Park Condo: The Property Portfolio Of Jersey Mike's Founder
Jersey Mike’s founder, Peter Cancro, who just secured an $8 billion deal with private equity giant Blackstone, has built an impressive real estate portfolio alongside his sandwich empire.
The transaction, which maintains Cancro’s leadership role while selling a majority stake to Blackstone, has catapulted him to 388th place on Bloomberg’s Billionaire Index with an estimated net worth of $7.55 billion.
Don’t Miss:
Cancro’s property holdings show his transition from a Jersey Shore entrepreneur to a Manhattan power player. According to Realtor.com, in 2014, he and his wife Tatiana purchased a four-unit condominium in Manhattan’s Lenox Hill neighborhood for $15.68 million. The residence, located in the landmark Marquand building steps from Central Park, has a private elevator, wood-burning fireplace and sprawling primary suite within its Beaux-Arts Revival architecture.
While maintaining deep ties to his New Jersey roots, Cancro has established a presence in Florida’s luxury real estate market. Property records show multiple units in a prestigious Bal Harbour building, including two two-bedroom apartments and a larger three-bedroom residence spanning 3,128 square feet.
See Also: Are you rich? Here’s what Americans think you need to be considered wealthy.
The beachfront properties offer access to St. Regis Hotel amenities, including 24-hour room service, housekeeping and private pool facilities, Realtor said.
At age 14, Cancro began working at Mike’s Subs in Point Pleasant, New Jersey. Three years later, with a $125,000 loan from his football coach, he purchased the store – despite being too young to legally operate the meat slicer.
That original location, which Cancro still personally owns along with another Point Pleasant store, grew into a franchise empire of approximately 3,000 locations, generating over $3 billion in annual revenue, according to a report issued by Business Insider. The Blackstone deal includes provisions for further expansion to 4,000 stores, with an earnout agreement tied to this growth target.
Trending: Inspired by Uber and Airbnb – Deloitte’s fastest-growing software company is transforming 7 billion smartphones into income-generating assets – with $1,000 you can invest at just $0.26/share!
Now ranking ahead of Netflix’s Reed Hastings on the Bloomberg Billionaire Index and approaching Mark Cuban’s $7.9 billion net worth, Cancro’s real estate investments mirror the explosive growth of his sandwich business.
According to company statements, the deal promises to accelerate Jersey Mike’s expansion “across and beyond the U.S. market” while investing in technology and digital transformation.
“We believe we are still in the early innings of Jersey Mike’s growth story,” Cancro said following the Blackstone announcement, suggesting his property portfolio might continue expanding alongside his sandwich empire.
Read Next:
Market News and Data brought to you by Benzinga APIs
© 2024 Benzinga.com. Benzinga does not provide investment advice. All rights reserved.
A Peek at MINISO Group Holding's Future Earnings
MINISO Group Holding MNSO will release its quarterly earnings report on Friday, 2024-11-29. Here’s a brief overview for investors ahead of the announcement.
Analysts anticipate MINISO Group Holding to report an earnings per share (EPS) of $0.33.
MINISO Group Holding bulls will hope to hear the company announce they’ve not only beaten that estimate, but also to provide positive guidance, or forecasted growth, for the next quarter.
New investors should note that it is sometimes not an earnings beat or miss that most affects the price of a stock, but the guidance (or forecast).
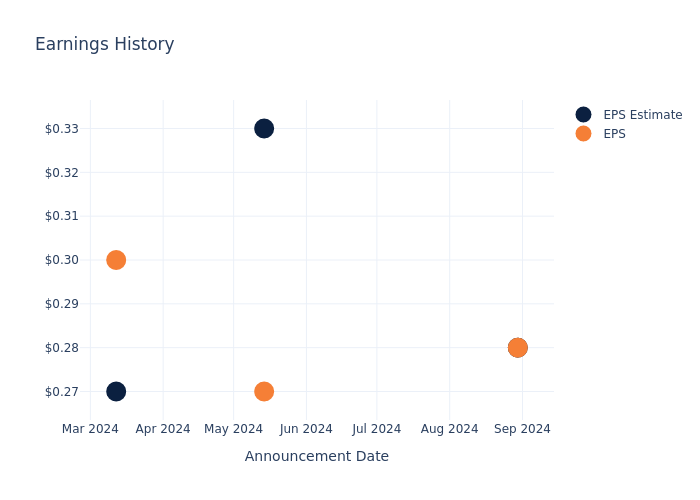
Earnings History Snapshot
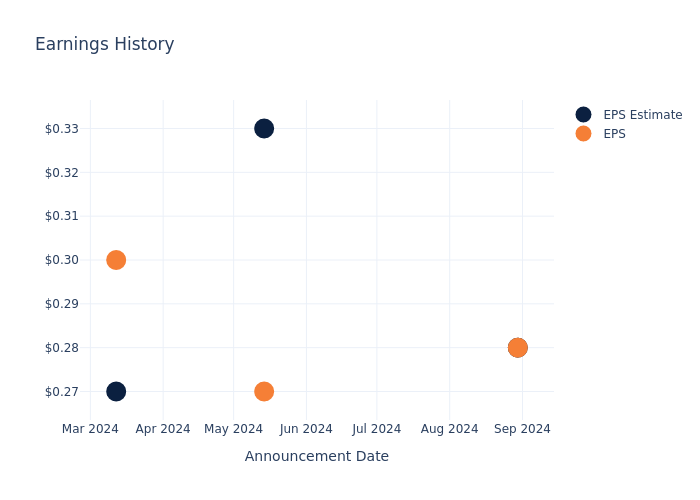
The company’s EPS missed by $0.00 in the last quarter, leading to a 0.0% drop in the share price on the following day.
Here’s a look at MINISO Group Holding’s past performance and the resulting price change:
| Quarter | Q4 2024 | Q3 2024 | Q2 2024 | Q1 2024 |
|---|---|---|---|---|
| EPS Estimate | 0.28 | 0.33 | 0.27 | 0.25 |
| EPS Actual | 0.28 | 0.27 | 0.30 | 0.28 |
| Price Change % | 1.0% | 2.0% | 8.0% | -10.0% |
Market Performance of MINISO Group Holding’s Stock
Shares of MINISO Group Holding were trading at $17.4 as of November 26. Over the last 52-week period, shares are down 23.72%. Given that these returns are generally negative, long-term shareholders are likely bearish going into this earnings release.
Analyst Observations about MINISO Group Holding
Understanding market sentiments and expectations within the industry is crucial for investors. This analysis delves into the latest insights on MINISO Group Holding.
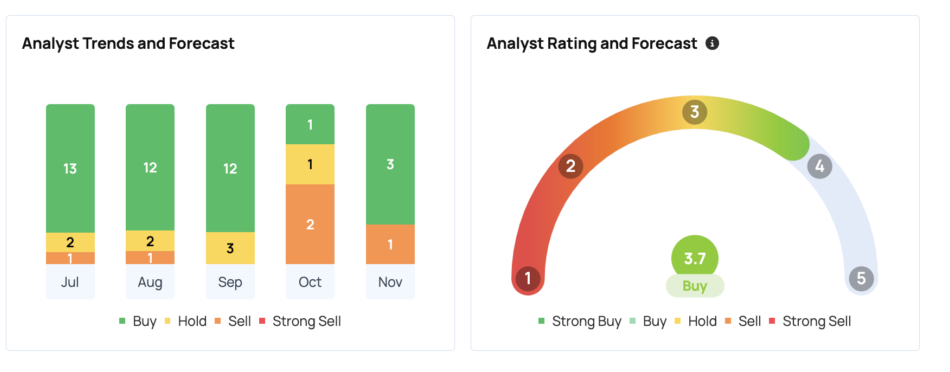
With 3 analyst ratings, MINISO Group Holding has a consensus rating of Buy. The average one-year price target is $22.93, indicating a potential 31.78% upside.
Analyzing Analyst Ratings Among Peers
The below comparison of the analyst ratings and average 1-year price targets of and Ollie’s Bargain Outlet, three prominent players in the industry, gives insights for their relative performance expectations and market positioning.
Peer Metrics Summary
The peer analysis summary offers a detailed examination of key metrics for and Ollie’s Bargain Outlet, providing valuable insights into their respective standings within the industry and their market positions and comparative performance.
| Company | Consensus | Revenue Growth | Gross Profit | Return on Equity |
|---|---|---|---|---|
| Ollie’s Bargain Outlet | Outperform | 12.41% | $219.03M | 3.14% |
Key Takeaway:
MINISO Group Holding ranks at the bottom for Revenue Growth among its peers, with a growth rate of 12.41%. The company also lags behind in Gross Profit, standing at $219.03M. Additionally, its Return on Equity is at 3.14%, indicating a lower performance compared to its peers.
Get to Know MINISO Group Holding Better
MINISO Group Holding Ltd is a retailer offering a variety of design-led lifestyle products. The principal activity of the Company is investment holding. The company’s product categories include home decor, small electronics, textiles, accessories, beauty tools, toys, cosmetics, personal care, snacks, fragrance and perfumes, and stationery and gifts. Its segment includes the MINISO brand, which is engaged in the Design, buying and sale of lifestyle products, and the TOP TOY brand, which is engaged in the Design, buying and sale of pop toys. The company generates maximum revenue from the MINISO brand segment. Geographically, it derives a majority of its revenue from China.
Financial Insights: MINISO Group Holding
Market Capitalization Analysis: Positioned below industry benchmarks, the company’s market capitalization faces constraints in size. This could be influenced by factors such as growth expectations or operational capacity.
Positive Revenue Trend: Examining MINISO Group Holding’s financials over 3 months reveals a positive narrative. The company achieved a noteworthy revenue growth rate of 24.08% as of 30 June, 2024, showcasing a substantial increase in top-line earnings. When compared to others in the Consumer Discretionary sector, the company excelled with a growth rate higher than the average among peers.
Net Margin: MINISO Group Holding’s net margin excels beyond industry benchmarks, reaching 14.56%. This signifies efficient cost management and strong financial health.
Return on Equity (ROE): The company’s ROE is a standout performer, exceeding industry averages. With an impressive ROE of 6.26%, the company showcases effective utilization of equity capital.
Return on Assets (ROA): The company’s ROA is a standout performer, exceeding industry averages. With an impressive ROA of 3.84%, the company showcases effective utilization of assets.
Debt Management: MINISO Group Holding’s debt-to-equity ratio is below the industry average at 0.2, reflecting a lower dependency on debt financing and a more conservative financial approach.
To track all earnings releases for MINISO Group Holding visit their earnings calendar on our site.
This article was generated by Benzinga’s automated content engine and reviewed by an editor.
© 2024 Benzinga.com. Benzinga does not provide investment advice. All rights reserved.
NFL Star Rob Gronkowski Shares How 'Listening To The Guy That Built My House' Turned $69K Into A $740K Apple Stock Jackpot
Former NFL player Rob Gronkowski stated that his most successful investment to date was buying shares of Apple Inc. AAPL a decade ago.
What Happened: Gronkowski shared in an interview with Fortune that his home builder advised him to invest in Apple back in 2014.
“The guy actually who built my house in Foxborough, he told me, ‘Hey buy Apple stock. I’m telling you that’s where it’s at,” Gronkowski recalled.
Following this advice, Gronkowski directed his financial advisor to buy $69,000 worth of Apple shares.
At the time of Gronkowski’s investment, Apple was gearing up to launch the iPhone 6, which eventually became a massive success. The tech giant also debuted its first Apple Watch the following year. Since the iPhone 6’s launch on Sept. 9, 2014, Apple’s stock has skyrocketed by over 900%. Consequently, a $69,000 investment on that day would be worth around $740,000 today.
Gronkowski confessed that he had overlooked his Apple shares for about two-and-a-half years, only to find out they were valued at approximately $250,000. He sold a portion of the shares and kept the rest.
“So I sell off the portion of the $69,000 I bought in and I have, now to this date, I have over $600,000 in Apple stock all because of the investment I made in 2014, having no idea what I was doing, but just listening to the guy that built my house here in New England so I appreciate that,” Gronkowski stated.
Gronkowski, a four-time Super Bowl champion, played for the New England Patriots and the Tampa Bay Buccaneers during his 11-season NFL career. He accumulated about $70 million during his tenure in the league.
Why It Matters: Apple is now facing modest growth as the smartphone market rebounds, with global shipments expected to rise by 6.2% year-over-year in 2024. However, this growth is anticipated to slow down to low single-digit figures from 2025 onwards.
Tim Cook-led tech giant is facing new competition from Huawei’s advances in domestic chip technology, despite ongoing U.S. sanctions. The Chinese tech giant’s increasing market share in China, where consumer demand is rising, poses a potential threat to Apple’s position in the global smartphone market.
According to data from Benzinga Pro, Apple has a consensus price target of $242.26, based on ratings from 31 analysts. The latest ratings were issued by Morgan Stanley, Maxim Group, and Barclays on Nov.25 and Nov. 1 (for both Maxim and Barclays). These three analysts have an average price target of $224, indicating a potential downside of -4.76% for the company based on their projections.

Price Action: Apple stock closed flat on Wednesday at $234.93 apiece. Banks, post offices, shipping services, stock markets and all the other over-the-counter markets like bond markets will be closed on Thursday for Thanksgiving.
Read Next:
Image via Shutterstock
Market News and Data brought to you by Benzinga APIs
© 2024 Benzinga.com. Benzinga does not provide investment advice. All rights reserved.
Banxa Reports Strong September Quarter
TORONTO, Nov. 28, 2024 /CNW/ – Banxa Holdings Inc. BNXA BNXAF AC (“Banxa” or the “Company“) is pleased to report the unaudited financial results for the first quarter of fiscal year 2025, being the period ended September 30th, 2024 (“Q1“). The full results including Management Discussion & Analysis (“MD&A“) are available on SEDAR.
Q1 FINANCIAL HIGHLIGHTS
(Figures are in AUD and all comparisons are relative to the three-month period ended September 30th, 2023, unless otherwise stated)
- 25% increase in Total Transaction Volume (“TTV“) to $252 million (USD $164 million), up from $202 million (USD $131 million), driven by product innovation, organic growth with partners and addition of new partners
- 10% increase in Gross Profit to $7.3 million (USD $4.7 million), up from $6.6 million (USD $4.3 million), due to growth in TTV and Net Take Rate
- 16% increase in Gross Profit on TTV, excludes integration revenue*, to $7.0 million (USD $4.5 million), up from $6.1 million (USD $3.9 million)
- Net Take Rate (“NTR“) was down to 2.8% from 3.0% due to a softer market
- 67% improvement in Adjusted EBITDA to ($0.3 million) (USD ($0.2 million)), up from ($0.8 million) (USD ($0.5 million)), due to improved TTV, reduced operating expenses, specifically legal & compliance costs
- 62% increase in Adjusted EBITDA on TTV, excludes integration revenue*, to ($0.5 million) (USD ($0.3 million), up from ($1.4 million) (USD ($0.9 million))
- Net loss per share on a basic and diluted basis to $0.00 (USD $0.00), compared to ($0.05) (USD ($0.03))
- Cash, Trade Receivables** and Crypto Inventories at $11.1 million (USD $7.2 million), down from $11.5 million (USD $7.5 million) as of June 30th, 2024 due to expunging of short term debt and legacy tax liabilities
|
*Integration revenue consists of coin and chain listings and does not have any costs attributed to it |
|
**Trade Receivables primarily consists of funds with large payment service providers (e.g., Worldpay), from credit card |
Zafer Qureshi, Executive Director and Co-CEO, commented: “Despite a softer market, we achieved strong top-line growth while strategically optimizing the business. Our team enhanced pricing strategies to capture a greater share of wallet, launched new features for partners, reduced high-cost debt facilities, and maintained disciplined cost management—all contributing to robust bottom-line performance.”
Zafer continued: “As we close out the year, we are solidifying our infrastructure in key markets: completed the license application for the Markets in Crypto Asset Regulations in Europe, preparing to go live with our Money Transmission Licenses in the US in the coming weeks, and launching operations in the UK under the FCA registration. With a stronger-than-ever foundation, we are now focused on driving sustainable growth by expanding into new segments and enhancing our product offerings to deliver greater value to our partners. We remain steadfast in realizing our vision of embedded crypto solutions that will transform traditional finance. With improving market sentiment, Holger and I are more energized than ever as we look ahead to an exciting 2025.”
Q1 UNAUDITED FINANCIAL RESULTS EARNINGS CALL
Banxa will host a conference call on November 28, 2024 at 8am EST to discuss the September Quarter results and all shareholders and investors are encouraged to register for the call here: https://tinyurl.com/BanxaQ1FY25Results
ADJUSTED EBITDA DEFINITION
Adjusted EBITDA is a non-IFRS financial measure that we calculate as net profit before tax excluding depreciation and amortization expense, share based compensation expense, unrealized loss on inventory, finance expense, realized/unrealized gain on fair value of deposits & derivative liability, (gain)/loss on fair value of derivative, unrealised exchange (gain)/loss, (gain)/loss on sale of capital asset and listing expenses. Adjusted EBITDA is used by management to understand and evaluate the performance and trends of the Company’s operations.
ABOUT BANXA HOLDINGS INC.
Banxa is the leading infrastructure provider for enabling embedded crypto – empowering businesses to embed crypto seamlessly into their existing platforms and unlocking new opportunities in the rapidly evolving crypto economy. Through an extensive and growing network of global and local payment solutions and regulatory licenses, Banxa helps businesses provide seamless integration of crypto and fiat for global audiences with lower fees and higher conversion rates. Headquartered in the USA, Europe, and Asia-Pacific, the Banxa team is building for a world where global commerce is run on digital assets. For further information visit www.banxa.com.
Neither the TSX Venture Exchange nor its Regulation Services Provider (as that term is defined in policies of the TSX Venture Exchange) accepts responsibility for the adequacy or accuracy of this release.
ON BEHALF OF THE BOARD OF DIRECTORS
Per: “Zafer Qureshi”
Zafer Qureshi = Executive Director and Head, Corporate Affairs, +1-888-332-2692
Forward-Looking Information
This release includes certain statements and information that may constitute forward-looking information within the meaning of applicable Canadian securities laws. Forward-looking statements relate to future events or future performance and reflect the expectations or beliefs of management of the Company regarding future events. Generally, forward-looking statements and information can be identified by the use of forward-looking terminology such as “intends” or “anticipates”, or variations of such words and phrases or statements that certain actions, events or results “may”, “could”, “should”, “would” or “occur”. This information and these statements, referred to herein as “forward‐looking statements”, are not historical facts, are made as of the date of this news release and include without limitation, statements regarding discussions of future plans, estimates and forecasts and statements as to management’s expectations and intentions.
These forward‐looking statements involve numerous risks and uncertainties and actual results might differ materially from results suggested in any forward-looking statements. Although management of the Company has attempted to identify important factors that could cause actual results to differ materially from those contained in forward-looking statements or forward-looking information, there may be other factors that cause results not to be as anticipated, estimated or intended. There can be no assurance that such statements will prove to be accurate, as actual results and future events could differ materially from those anticipated in such statements. Accordingly, readers should not place undue reliance on forward-looking statements and forward-looking information. Readers are cautioned that reliance on such information may not be appropriate for other purposes. The Company does not undertake to update any forward-looking statement, forward-looking information or financial out-look that are incorporated by reference herein, except in accordance with applicable securities laws. We seek safe harbor.
SOURCE Banxa Holdings Inc.

![]() View original content to download multimedia: http://www.newswire.ca/en/releases/archive/November2024/28/c4339.html
View original content to download multimedia: http://www.newswire.ca/en/releases/archive/November2024/28/c4339.html
© 2024 Benzinga.com. Benzinga does not provide investment advice. All rights reserved.
Palantir's YTD Returns Surge 298%: Here's How ETFs With Exposure To Alex Karp's Company Have Performed
Palantir Technologies Inc. PLTR has experienced a remarkable rise, achieving a 298.37% year-to-date return as of Thursday morning. This surge has sparked interest in ETFs with significant exposure to Palantir.
According to Benzinga Pro, the Global X Defense Tech ETF SHLD holds 7.82% of its portfolio in Palantir stock, amounting to $51.85 million across 1.24 million shares. SHLD, which combines Palantir’s defense and intelligence sector presence with other aerospace and defense players, has seen a 40.86% YTD return.
Meanwhile, ARK Innovation ETF ARKK has allocated nearly 5% of its portfolio to Palantir, with over $273 million invested in 6.53 million shares. Known for backing high-growth companies, ARKK boasts over $6 billion in assets under management and has achieved a 13.17% YTD return.
On the other hand, the REX AI Equity Premium Income ETF AIPI holds 9.46% exposure to Palantir, translating to a $9.24 million position. However, its YTD returns have declined by 0.61%. AIPI’s strategy involves selling out-of-the-money covered call options, which can generate income but may limit capital appreciation.
At the time of writing, Palantir’s stock was up by 0.23%. The three most recent analyst ratings for Palantir. were issued by BofA Securities, Wedbush, and Goldman Sachs on Nov. 25 and Nov, 7, with an average price target of $63.67 from these firms.

Read Next:
Disclaimer: This content was partially produced with the help of Benzinga Neuro and was reviewed and published by Benzinga editors.
Image via Flickr
Market News and Data brought to you by Benzinga APIs
© 2024 Benzinga.com. Benzinga does not provide investment advice. All rights reserved.
Dye & Durham Forecasts Record Setting Quarter & Announces Upcoming Investor Briefing
- $120-125 million Q2 FY2025 guidance range for revenue versus $110 million in Q2 FY2024
- 6-10% expected Organic Revenue Growth1,3 rate in Q2 FY2025 versus 2.8% in Q2 FY2024
- Results are trending for the Company’s best quarterly revenue1 performance ever – clear proof that management’s value creation plan is working
TORONTO, Nov. 28, 2024 /CNW/ – Dye & Durham Limited (“Dye & Durham” or the “Company“) DND today provided second quarter fiscal 2025 (“Q2 FY2025“) guidance, forecasting its best quarter to date.
Based on the continued success of the Company’s organic growth initiatives, management is pleased to provide Q2 FY2025 revenue guidance of $120-125 million. Management also expects to report an Organic Revenue Growth Rate3 of 6-10% for Q2 FY2025.
“Dye & Durham is delivering on its commitment to investors and generating impressive and record-setting results. The management team’s strategy has worked to transition our revenue model to a more predictable contracted revenue, and to capitalize on organic growth opportunities such as cross-selling,” said Matthew Proud, CEO of Dye & Durham.
|
1) Excludes TM Group |
|
2) Represents mid point of guidance |
“While the events of the past few quarters have imposed an unnecessary distraction on our business, our team has remained focused on executing against our Value Creation Plan, which can be seen in the $50 million annual revenue growth we have delivered on. Our financial profile underscores the strength of our strategy and the quality of our board of directors and management team,” continued Mr. Proud.
Investor Briefing Event
The Company will also host an Investor Briefing event (the “Briefing“) on the afternoon of December 10, 2024, to provide shareholders with an update on the Company’s progress and strategic execution of its recently published ‘Value Creation Plan’. The Briefing will also include a question and answer session. Investors are invited to attend in person or access the Briefing from the Events section on the Investors page of its website.
Details on the Value Creation Plan, which is focused on continuing to drive driving sustainable long-term value for all stakeholders, can be found in the Investors section of the Company’s website and on SEDAR+ under the Company’s profile at www.sedarplus.ca.
|
3) |
Represents a non-IFRS measure. This measure is not a recognized measure under IFRS, does not have a standardized meaning prescribed by IFRS and is therefore unlikely to be comparable to similar measures presented by other companies. For the relevant definition, see the “Non-IFRS Financial Measures” section of this press release. Management believes non-IFRS measures, including Organic Revenue Growth Rate, provide supplementary information to IFRS measures used in assessing the performance of the business by providing further understanding of the Company’s results of operations from management’s perspective. Please see “Cautionary Note Regarding Non-IFRS Measures”, and “Select Information and Reconciliation of Non-IFRS Measures in the Company’s most recent Management’s Discussion and Analysis, which is available on the Company’s profile on SEDAR+ at www.sedarplus.ca, for further details on certain non-IFRS measures. Please see the “Non-IFRS Financial Measures” section of this press release for a reconciliation of Organic Revenue to Revenue. |
About Dye & Durham Limited
Dye & Durham Limited provides premier practice management solutions empowering legal professionals every day, delivers vital data insights to support critical corporate transactions and enables the essential payments infrastructure trusted by government and financial institutions. The company has operations in Canada, the United Kingdom, Ireland, and Australia.
Additional information can be found at www.dyedurham.com.
Non-IFRS Measures
This press release makes reference to Organic Revenue Growth Rate, which is a non-IFRS measure. This is not a recognized measure under IFRS, does not have a standardized meaning prescribed by IFRS and is therefore unlikely to be comparable to similar measures presented by other companies.
Rather, this measure is provided as additional information to complement those IFRS measures by providing further understanding of the Company’s results of operations from management’s perspective and to discuss Dye & Durham’s financial outlook. The Company’s definitions of non-IFRS measures may not be the same as the definitions for such measures used by other companies in their reporting. Non-IFRS measures have limitations as analytical tools. Accordingly, these measures should not be considered in isolation nor as a substitute for analysis of Dye & Durham’s financial information reported under IFRS. The Company uses non-IFRS measures, including “Organic Revenue Growth Rate” (as defined below), to provide investors with supplemental measures of its operating performance and to eliminate items that have less bearing on operating performance or operating conditions and thus highlight trends in its core business that may not otherwise be apparent when relying solely on IFRS financial measures. The Company’s management also uses non-IFRS financial measures in order to facilitate operating performance comparisons from period to period. The Company believes that securities analysts, investors, and other interested parties frequently use non-IFRS financial measures in the evaluation of issues.
Please see “Cautionary Note Regarding Non-IFRS Measures” and “Select Information and Reconciliation of Non-IFRS Measures” in the Company’s most recent Management’s Discussion and Analysis, which is available on the Company’s profile on SEDAR+ at www.sedarplus.ca, for further details on certain non-IFRS measures.
Organic Revenue Growth Rate
“Organic Revenue Growth Rate” means total revenue in the current quarter period (excluding the pre-acquisition quarterly revenue of those acquisitions executed in the last twelve month period and discontinued businesses) (“Organic Revenue“) divided by the total revenue in the prior quarter period (excluding TM Group, pre-acquisition quarterly revenue and discontinued businesses). Organic Revenue, which is a non-IFRS measure, is used as a component in Organic Revenue Growth Rate. Below is a reconciliation of the Company’s Q2 FY2025 Organic Growth Rate.
|
$ million |
|
|
Q2 FY2025 Revenue |
120 – 125 |
|
Pre-Acquisition Reporting Results |
3.5 |
|
Organic Revenue |
116.5-121.5 |
|
Q2 FY2024 Revenue |
110 |
|
Organic Revenue Growth Rate (%) |
6% – 10% |
Forward-looking Statements
This press release may contain forward-looking information and forward-looking statements within the meaning of applicable securities laws, which reflects the Company’s current expectations regarding future events, including with respect to the Company’s financial outlook and expected Q2 FY2025 revenue and Organic Revenue Growth Rate. In some cases, but not necessarily in all cases, forward-looking statements can be identified by the use of forward looking terminology such as “plans”, “targets”, “expects” or “does not expect”, “is expected”, “an opportunity exists”, “is positioned”, “estimates”, “intends”, “assumes”, “anticipates” or “does not anticipate” or “believes”, or variations of such words and phrases or state that certain actions, events or results “may”, “could”, “would”, “might”, “will” or “will be taken”, “occur” or “be achieved”. In addition, any statements that refer to guidance, expectations, projections or other characterizations of future events or circumstances contain forward-looking statements. Forward-looking statements are not historical facts, nor guarantees or assurances of future performance but instead represent management’s current beliefs, expectations, estimates and projections regarding future events and operating performance.
Specifically, statements regarding Dye & Durham’s expectations of future results, including its expected Q2 FY2025 revenue and Organic Revenue Growth Rate, performance, prospects, the markets in which we operate, or about any future intention with regard to its business, acquisition strategies and debt reduction strategy are forward-looking information. The foregoing demonstrates Dye & Durham’s objectives, which are not forecasts or estimates of its financial position, but are based on the implementation of its strategic goals, growth prospectus, and growth initiatives. The forward-looking information is based on management’s opinions, estimates and assumptions, including, but not limited to: (i) the Company’s results of operations will continue as expected, (ii) the Company will continue to effectively execute against its key strategic growth priorities, (iii) the Company will continue to retain and grow its existing customer base and market share, (iv) the Company will be able to take advantage of future prospects and opportunities, and realize on synergies, including with respect of acquisitions, (v) there will be no changes in legislative or regulatory matters that negatively impact the Company’s business, (vi) current tax laws will remain in effect and will not be materially changed, (vii) economic conditions will remain relatively stable throughout the period, (viii) the industries the Company operates in will continue to grow consistent with past experience, (ix) exchange rates being approximately consistent with current levels, * the seasonal trends in real estate transaction volume will continue as expected, (xi) the Company’s expectations for increases to the average rate per user on its platforms, contractual revenues, and incremental earnings from its latest asset-based acquisition will be met, (xii) the Company being able to effectively upsell and cross-sell between practice management and data insights & due diligence customers, (xiii) the Company’s expectations regarding its debt reduction strategy will be met, and (xiv) those assumptions described under the heading “Caution Regarding Forward-Looking Information” in the Company’s most recent Management’s Discussion and Analysis.
While these opinions, estimates and assumptions are considered by Dye & Durham to be appropriate and reasonable in the circumstances as of the date of this press release, they are subject to known and unknown risks, uncertainties, assumptions and other factors that may cause the actual results, levels of activity, performance, or achievements to be materially different from those expressed or implied by such forward-looking information. Such risks and uncertainties include, but are not limited to: the Company will be unable to effectively execute against its key strategic growth priorities, including in respect of acquisitions; the Company will be unable to continue to retain and grow its existing customer base and market share; risks related to the Company’s business and financial position; the Company may not be able to accurately predict its rate of growth and profitability; risks related to economic and political uncertainty; income tax related risks; and the factors discussed under “Risk Factors” in the Company’s most recent Annual Information Form and under the heading “Risks and Uncertainties” in the Company’s most recent Management’s Discussion and Analysis, which are available on the Company’s profile on SEDAR+ at www.sedarplus.ca.
If any of these risks or uncertainties materialize, or if the opinions, estimates or assumptions underlying the forward-looking information prove incorrect, actual results or future events might vary materially from those anticipated in the forward-looking information. Although the Company has attempted to identify important risk factors that could cause actual results to differ materially from those contained in forward-looking information, there may be other risk factors not presently known to the Company or that the Company presently believes are not material that could also cause actual results or future events to differ materially from those expressed in such forward-looking information.
Although the Company bases these forward-looking statements on assumptions that it believes are reasonable when made, the Company cautions investors that forward-looking statements are not guarantees of future performance and that its actual results of operations, financial condition and liquidity and the development of the industry in which it operates may differ materially from those made in or suggested by the forward-looking statements contained in this press release. In addition, even if the Company’s results of operations, financial condition and liquidity and the development of the industry in which it operates are consistent with the forward-looking statements contained in this press release, those results of developments may not be indicative of results or developments in subsequent periods.
There can be no assurance that such information will prove to be accurate, as actual results and future events could differ materially from those anticipated in such information. No forward-looking statement is a guarantee of future results. Accordingly, you should not place undue reliance on forward-looking information, which speaks only as of the date made. The forward-looking information contained in this press release represents Dye & Durham’s expectations as of the date specified herein, and are subject to change after such date. However, the Company disclaims any intention or obligation or undertaking to update or revise any forward-looking information or to publicly announce the results of any revisions to any of those statements, whether as a result of new information, future events or otherwise, except as required under applicable securities laws. Comparisons of results for current and any prior periods are not intended to express any future trends or indications of future performance, unless specifically expressed as such, and should only be viewed as historical data.
All of the forward-looking information contained in this press release is expressly qualified by the foregoing cautionary statements.
SOURCE Dye & Durham Limited

![]() View original content to download multimedia: http://www.newswire.ca/en/releases/archive/November2024/28/c0406.html
View original content to download multimedia: http://www.newswire.ca/en/releases/archive/November2024/28/c0406.html
© 2024 Benzinga.com. Benzinga does not provide investment advice. All rights reserved.
Price Over Earnings Overview: Greenbrier Companies
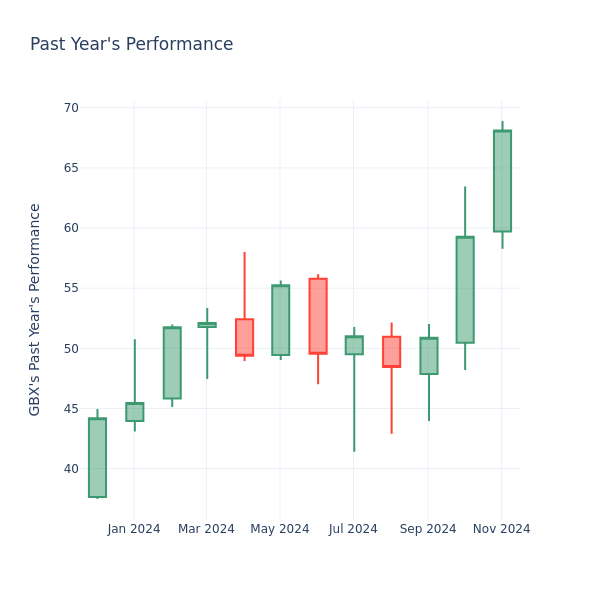
In the current market session, Greenbrier Companies Inc. GBX stock price is at $68.10, after a 0.09% decrease. However, over the past month, the company’s stock increased by 14.90%, and in the past year, by 74.17%. Shareholders might be interested in knowing whether the stock is overvalued, even if the company is not performing up to par in the current session.
Evaluating Greenbrier Companies P/E in Comparison to Its Peers
The P/E ratio measures the current share price to the company’s EPS. It is used by long-term investors to analyze the company’s current performance against it’s past earnings, historical data and aggregate market data for the industry or the indices, such as S&P 500. A higher P/E indicates that investors expect the company to perform better in the future, and the stock is probably overvalued, but not necessarily. It also could indicate that investors are willing to pay a higher share price currently, because they expect the company to perform better in the upcoming quarters. This leads investors to also remain optimistic about rising dividends in the future.
Greenbrier Companies has a lower P/E than the aggregate P/E of 15.97 of the Machinery industry. Ideally, one might believe that the stock might perform worse than its peers, but it’s also probable that the stock is undervalued.
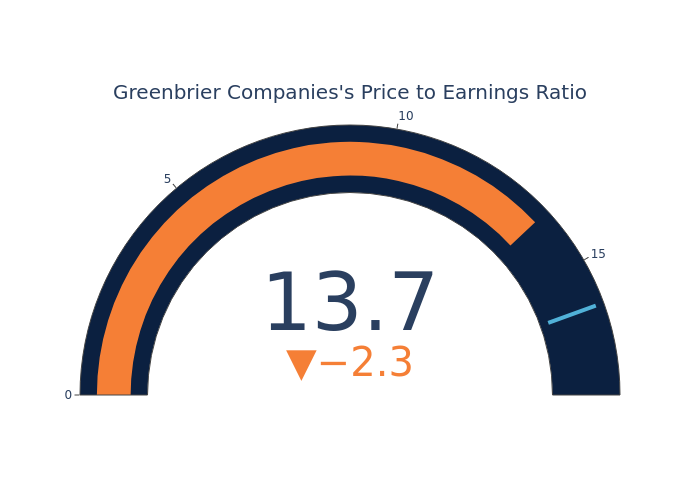
In summary, while the price-to-earnings ratio is a valuable tool for investors to evaluate a company’s market performance, it should be used with caution. A low P/E ratio can be an indication of undervaluation, but it can also suggest weak growth prospects or financial instability. Moreover, the P/E ratio is just one of many metrics that investors should consider when making investment decisions, and it should be evaluated alongside other financial ratios, industry trends, and qualitative factors. By taking a comprehensive approach to analyzing a company’s financial health, investors can make well-informed decisions that are more likely to lead to successful outcomes.
Market News and Data brought to you by Benzinga APIs
© 2024 Benzinga.com. Benzinga does not provide investment advice. All rights reserved.
Synchrophasors Market: Driving the Future of Smarter, Resilient Energy Grids, set to Reach USD 2.0 Billion by 2034 | Transparency Market Research
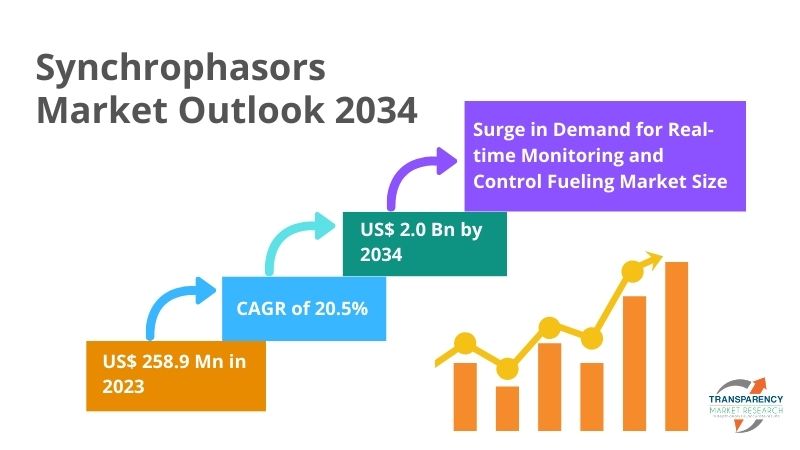
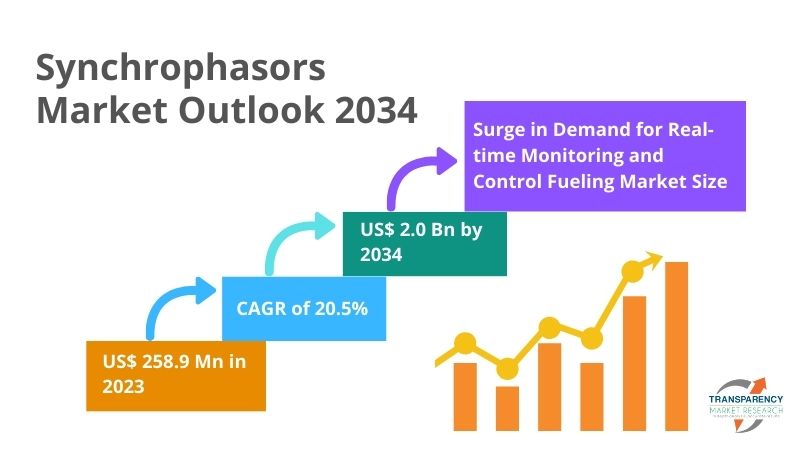
Wilmington, Delaware, Transparency Market Research Inc., Nov. 28, 2024 (GLOBE NEWSWIRE) — The global synchrophasors market (世界のシンクロファーザー市場), valued at US$ 258.9 Mn in 2023, is poised for unprecedented growth. With an anticipated CAGR of 20.5% from 2024 to 2034, the market is expected to surpass US$ 2.0 Bn by the end of 2034.
This remarkable expansion underscores the pivotal role synchrophasors play in modernizing power grids, enhancing grid stability, and integrating renewable energy sources.
Request a Report Sample for More Insights – https://www.transparencymarketresearch.com/sample/sample.php?flag=S&rep_id=2651
Key Drivers Shaping the Synchrophasors Market
The rising demand for reliable and efficient power systems is at the core of the synchrophasors market’s growth. As global energy needs continue to rise, driven by urbanization and industrialization, synchrophasors are becoming integral to the digital transformation of power grids.
- Grid Modernization Initiatives: Governments and utilities worldwide are prioritizing grid upgrades to ensure resilience and minimize blackouts. Synchrophasors, with their ability to monitor grid stability in real-time, are crucial to these initiatives.
- Integration of Renewable Energy: The push for clean energy sources such as wind and solar necessitates advanced tools like synchrophasors to manage the variability and intermittency of renewables.
- Focus on Wide Area Monitoring Systems (WAMS): Synchrophasors enable wide-area situational awareness, allowing utilities to detect, predict, and respond to grid anomalies effectively.
Key Players:
Prominent players in the market include:
- ABB
- Siemens Energy
- General Electric
- Toshiba Corporation
- Schneider Electric
- Schweitzer Engineering Laboratories (SEL)
- Hitachi Energy
- Vizimax
- Wasion Group Holdings Ltd.
Market Segmentation
By Component:
The synchrophasors market is categorized into hardware, software, and services, with hardware dominating due to the increasing deployment of PMUs and real-time dynamic monitoring systems (RTDMS).
- Hardware:
- Real-time Dynamic Monitoring System (RTDMS)
- Phasor Measurement Unit (PMU)
- Phasor Data Concentrators (PDCs)
- Communication Equipment
- Others (Data Units, Clocks, etc.)
- Software: Applications that analyze synchrophasor data to optimize grid operations are gaining traction.
- Services: Maintenance, integration, and consultancy services are emerging as critical segments, supporting hardware and software deployments.
By Application:
The diverse applications of synchrophasors include:
- Fault location and protective relaying
- Stability monitoring
- Power system control
- Wide-area situational awareness
- Islanding detection
- Load characterization
By End-use:
Key end-users include:
- Power transmission systems
- Power distribution systems
- Distributed energy systems
- Power generation facilities
Get a Custom Research Report at https://www.transparencymarketresearch.com/sample/sample.php?flag=S&rep_id=2651
Regional Insights
North America dominates the synchrophasors market, driven by significant investments in grid modernization and renewable energy integration. The U.S., in particular, has been a frontrunner, supported by government initiatives like the Smart Grid Investment Grant (SGIG) program.
Europe is witnessing steady growth due to the region’s focus on clean energy and stringent regulations for grid reliability. Germany and the U.K. are key contributors to this market.
Asia Pacific is anticipated to emerge as a lucrative market, with countries such as China and India investing heavily in grid infrastructure to meet rising energy demands.
Latin America and the Middle East & Africa are gradually adopting synchrophasors, spurred by the need to enhance grid resilience in remote and underserved areas.
Competitive Landscape
The synchrophasors market is fragmented, with numerous players competing to deliver innovative and efficient solutions. Companies are focusing on:
- Expanding product portfolios
- Strategic collaborations and partnerships
- Research and development (R&D) to launch advanced synchrophasor technologies
Recent Developments:
- ABB introduced a new range of PMUs with enhanced cybersecurity features, addressing growing concerns over grid vulnerabilities.
- Siemens Energy launched advanced synchrophasor solutions aimed at improving grid reliability in renewable energy-dominated systems.
- Schneider Electric partnered with leading utilities to deploy wide-area monitoring systems across Europe.
Trends and Opportunities in the Synchrophasors Market
- Digital Twin Technology:
The integration of synchrophasors with digital twin models is revolutionizing grid management. Utilities can simulate grid conditions, predict failures, and optimize performance using real-time data. - IoT and Big Data Analytics:
The convergence of IoT and advanced analytics with synchrophasor data is enabling smarter decision-making, offering utilities actionable insights to enhance grid stability. - Focus on Cybersecurity:
As synchrophasor systems become increasingly interconnected, addressing cybersecurity risks is critical. Players are investing in robust encryption and monitoring technologies. - Emergence of Microgrids:
The adoption of microgrids is driving demand for synchrophasors to ensure seamless integration with larger grids and maintain reliability in localized systems. - Expansion in Emerging Markets:
Developing countries are recognizing the potential of synchrophasors in improving energy access and reliability, creating significant opportunities for market players.
Aligning with Broader Industry Trends
The synchrophasors market aligns closely with trends in the broader chemicals and materials industry:
- Sustainability Focus: Emphasis on energy efficiency and reduced carbon footprints aligns with global sustainability goals.
- Shift to Decentralized Energy Systems: Decentralized systems and smart grids are reshaping energy infrastructure, boosting the adoption of synchrophasors.
- Technological Synergy: Advanced materials for synchrophasor components are being developed to enhance durability and performance.
The synchrophasors market represents a transformative opportunity in the power sector, playing a vital role in ensuring grid stability, integrating renewable energy, and supporting the transition to smart grids. With a projected value of US$ 2.0 Bn by 2034, this market is poised for robust growth, driven by technological advancements, government initiatives, and a global focus on energy resilience.
Utilities and manufacturers investing in synchrophasor technologies will not only gain a competitive edge but also contribute significantly to the evolution of sustainable and efficient energy systems.
For more insights into market trends, competitive strategies, and emerging opportunities, buy this research report from Transparency Market Research: https://www.transparencymarketresearch.com/checkout.php?rep_id=2651<ype=S
Trending Research Reports in the Research Reports in Electronics and Semiconductors
- Quartz Crystal Market (水晶市場): The continued expansion of 5G networks, IoT applications, smart devices, and automotive electronics has created opportunity for quartz crystal manufacturers to grasp some quartz crystal market share.
- Product Prototyping Market (제품 프로토 타이핑 시장): Estimated to advance at a CAGR of 11.5% from 2024 to 2034 and reach US$ 63.90 Bn by the end of 2034
About Transparency Market Research
Transparency Market Research, a global market research company registered at Wilmington, Delaware, United States, provides custom research and consulting services. Our exclusive blend of quantitative forecasting and trends analysis provides forward-looking insights for thousands of decision makers. Our experienced team of Analysts, Researchers, and Consultants use proprietary data sources and various tools & techniques to gather and analyses information.
Our data repository is continuously updated and revised by a team of research experts, so that it always reflects the latest trends and information. With a broad research and analysis capability, Transparency Market Research employs rigorous primary and secondary research techniques in developing distinctive data sets and research material for business reports.
Contact:
Transparency Market Research Inc.
CORPORATE HEADQUARTER DOWNTOWN,
1000 N. West Street,
Suite 1200, Wilmington, Delaware 19801 USA
Tel: +1-518-618-1030
USA – Canada Toll Free: 866-552-3453
Website: https://www.transparencymarketresearch.com
Email: sales@transparencymarketresearch.com
Follow Us: LinkedIn| Twitter| Blog | YouTube

© 2024 Benzinga.com. Benzinga does not provide investment advice. All rights reserved.
Imaflex Reports Q3 2024 Results, Provides Business Update
Delivers sustained top and bottom-line growth
Q3 2024 Highlights
- Revenues of $28.4 million, up 24.3% from $22.9 million in Q3 2023
- Gross profit up 122% to $4.6 million
- Net income up 847.1% to $1.5 million (EPS of $0.03)1
- Solid liquidity with $15.7 million available at quarter end, including a cash balance of $3.7 million ($0.07 per share) and another $12.0 million under Imaflex’s revolving line of credit
- Generated free cash flow2 of $4.2 million
MONTRÉAL, Nov. 28, 2024 /CNW/ – Imaflex Inc. (“Imaflex” or the “Corporation”) IFX reports consolidated financial results for the third quarter (Q3) ended September 30, 2024 and provides a business update. All amounts are in Canadian dollars.
“We continued to deliver solid year-over-year results in the third quarter, reflecting the strength of our dedicated team and expanding capabilities,” said Mr. Yazedjian, Imaflex’s new President and Chief Executive Officer. “As we look ahead, we are confident in our ability to build on this momentum and deliver sustainable growth.” As usual, third quarter performance was impacted by Québec’s annual construction holiday, which results in temporary plant closures across the province, including Imaflex’s Montréal and Victoriaville plants.
Consolidated Financial Highlights (unaudited)
|
Three months ended Sept 30, |
Nine months ended Sept 30, |
|||||
|
CDN $ thousands, except per share amounts |
2024 |
2023 |
% Change |
2024 |
2023 |
% Change |
|
Revenues |
28,418 |
22,858 |
24.3 % |
84,655 |
70,588 |
19.9 % |
|
Gross Profit |
4,617 |
2,080 |
122.0 % |
14,935 |
8,601 |
73.6 % |
|
Selling & admin. expenses |
2,607 |
2,070 |
25.9 % |
7,029 |
6,367 |
10.4 % |
|
Other (gains) losses |
340 |
(360) |
(194.4) % |
(457) |
31 |
(1,574.2) % |
|
Net income |
1,468 |
155 |
847.1 % |
6,750 |
1,516 |
345.3 % |
|
Basic EPS |
0.03 |
0.00 |
n/a |
0.13 |
0.03 |
333.3 % |
|
Diluted EPS |
0.03 |
0.00 |
n/a |
0.13 |
0.03 |
333.3 % |
|
Gross margin |
16.2 % |
9.1 % |
7.1 pp |
17.6 % |
12.2 % |
5.4 pp |
|
Selling & admin. expenses as % of revenues |
9.2 % |
9.1 % |
0.1 pp |
8.3 % |
9.0 % |
(0.7) pp |
|
EBITDA2 (Excluding FX) |
3,339 |
1,126 |
196.5 % |
11,806 |
5,497 |
114.8 % |
|
EBITDA |
2,995 |
1,463 |
104.7 % |
12,247 |
5,358 |
128.6 % |
|
EBITDA margin |
10.5 % |
6.4 % |
4.1 pp |
14.5 % |
7.6 % |
6.9 pp |
|
________________________________ |
|
|
1 |
Earning per share (EPS) based on basic and diluted weighted shares outstanding |
|
2 |
See header titled “Caution Regarding non-IFRS Financial Measures” which follows. |
Financial Review: Quarter Ended September 30
Revenues
Revenues were $28.4 million for the third quarter of 2024, up 24.3% from $22.9 million in 2023. Growth was driven by heightened volumes, stronger sales of higher margin offerings and favourable movements in foreign exchange.
For the first nine months of 2024, revenues increased 19.9% to $84.7 million, driven by the same factors outlined for the quarter.
Gross Profit
Gross profit came in at $4.6 million (16.2% of sales) for the current quarter, up significantly from $2.1 million (9.1% of sales) in 2023. For 2024 year-to-date, the gross profit was $14.9 million (17.6% of sales), versus $8.6 million (12.2% of sales) in 2023.
Despite a competitive pricing environment, the Corporation’s performance in 2024 has been bolstered by higher sales volumes, product mix, operational efficiencies, and ongoing cost controls.
Operating Expenses
Selling and Administrative expenses were $2.6 million (9.2% of sales) in the current quarter, versus $2.1 million (9.1% of sales) in 2023. The year-over-year increase was largely due to increased administrative expenses, including higher provisions for the Corporation’s profit participation plan resulting from the heightened profitability. For 2024 year-to-date, expenses totalled $7.0 million (8.3% of sales), compared to $6.4 million (9.0% of sales) in 2023. The selling expense ratio for both the current quarter and year-to-date benefited from the higher sales base in 2024.
Imaflex recorded other losses of $0.3 million for the current quarter, versus gains of $0.4 million in the same period last year, resulting in a $0.7 million unfavourable year-over-year variance. For 2024 year-to-date, the Company recorded gains of $0.5 million versus losses of $31 thousand in 2023, yielding a $0.5 million favourable variance. Other gains and losses were primarily driven by foreign exchange movements.
A majority of the Corporation’s foreign exchange gains and losses are non-cash impacting and largely relate to intercompany balances for which Imaflex can control the time of settlement.
Net Income and EBITDA
Net income grew to $1.5 million in the current quarter, increasing $1.3 million or 847.1%, over 2023. For the year-to-date, net income grew to $6.8 million, up 345.3% from $1.5 million in 2023. The heightened profitability in 2024 was driven by the higher gross profit.
EBITDA was $3.0 million (10.5% of sales) for the current quarter, up 104.7% from $1.5 million (6.4% of sales) in 2023. On a constant currency basis, EBITDA came in at $3.3 million (11.7% of sales), up 196.5% over the
$1.1 million (4.9% of sales) achieved in the third quarter of 2023.
For 2024 year-to-date, EBITDA stood at $12.2 million (14.5% of sales), up 128.6% from $5.4 million (7.6% of sales) in the corresponding prior-year period. Excluding the impact of foreign exchange, EBITDA grew 114.8% over 2023, coming in at $11.8 million (13.9% of sales), compared to $5.5 million (7.8% of sales) in 2023.
Liquidity and Capital Resources
Net cash flows generated by operating activities, including movements in working capital and taxes, stood at $5.0 million for the current quarter, up from cash inflows of $0.7 million in the same period of 2023. The $4.3 million improvement was driven by the higher profit in 2024, along with movements in trade & other payables, foreign exchange, and income taxes, partially offset by movements in trade & other receivables and inventories.
For the first nine months of 2024, cash flows generated by operating activities, including movements in working capital and income taxes, stood at $9.1 million, up from $2.3 million in the prior year. The $6.8 million increase was primarily driven by the higher profit in 2024, along with movements in income taxes.
As at September 30, 2024 Imaflex continued to maintain a strong financial position with $15.7 million in available liquidity, including $3.7 million of cash (up from $0.7 million at the end of Q2 2024) and a fully undrawn $12.0 million revolving line of credit.
Working capital stood at $21.9 million at quarter end, up from $14.0 million as of December 31, 2023. The improvement was driven by heightened cash levels, higher trade and other receivables, along with a reduction in bank indebtedness and long-term debt, partially offset by higher finance lease obligations.
Equipment Purchase Program – Update
In 2022, Imaflex announced the signing of equipment purchase agreements for three multi-layer extruders and a metallizer. The metallizer and one extruder were fully commissioned in 2023, while the remaining two extruders are now operational and being commissioned. These purchases strengthen Imaflex’s capacity to explore new market opportunities and meet future demand.
ADVASEAL® Update
Imaflex remains focused on securing U.S. Environmental Protection Agency (“EPA”) approval of ADVASEAL®. As is typical with the EPA’s review process, no decision timeline was provided, although it is taking much longer than the Corporation originally expected.
Outlook
“As I step into the President and CEO position, I have made it a priority to meet with employees across the business and engage with some key customers and shareholders,” said Mr. Yazedjian. “These conversations have provided valuable insights, and I am inspired by the strength of our team and the strategic possibilities ahead. The positive momentum we have seen for the first nine months of 2024 is a testament to our capabilities.
While we are mindful of evolving market conditions, we remain confident in our ability to leverage our strong foundation to achieve sustained growth. Moving forward, we will focus on strengthening our core business, while driving innovation and expansion in key areas.”
Caution Regarding Non-IFRS Financial Measures
The Company’s management uses non-IFRS measures in this press release, namely EBITDA (Earnings Before Interest, Taxes, Depreciation, and Amortization), EBITDA excluding foreign exchange and Free Cash Flow.
While EBITDA and Free Cash Flow are not standard International Financial Reporting Standards (IFRS) measures, management, analysts, investors and others use them as an indicator of the Company’s financial and operating management and performance. EBITDA should not be construed as an alternative to net income determined in accordance with IFRS as an indicator of the Company’s performance. The Company’s method of calculating EBITDA and Free Cash Flow may be different from those used by other companies and accordingly they should not be considered in isolation.
About Imaflex Inc.
Founded in 1994, Imaflex is focused on the development and manufacturing of innovative solutions for the flexible packaging space. Concurrently, the Corporation develops and manufactures films for the agriculture industry. The Corporation’s products consist primarily of polyethylene (plastic) film and bags, including metalized plastic film, for the industrial, agricultural and consumer markets. Headquartered in Montreal, Quebec, Imaflex has manufacturing facilities in Canada and the United States. The Corporation’s common stock is listed on the TSX Venture Exchange under the ticker symbol IFX. Additional information is available at www.imaflex.com.
Cautionary Statement on Forward Looking Information
Certain information included in this press release constitutes “forward-looking” statements within the meaning of Canadian securities laws. Forward-looking statements are necessarily based upon a number of estimates and assumptions that, while considered reasonable by the management of the Corporation, are inherently subject to significant business, economic and competitive uncertainties, risks and contingencies. The Corporation cautions the reader that such forward-looking statements involve known and unknown risks, uncertainties and other factors that may cause the actual financial results, performance, or achievements of Imaflex to be materially different from the Corporation’s estimated future results, performance or achievements expressed or implied by those forward-looking statements and that the forward-looking statements are not guarantees of future performance. These statements are also based on certain factors and assumptions. For more details on these estimates, risks, assumptions and factors, see the Corporation’s most recent Management Discussion and Analysis filed on SEDAR+ at www.sedarplus.ca and on the investor section of the Corporation’s website at www.imaflex.com. The Corporation disclaims any obligation to update or revise any forward-looking statements, whether as a result of new information, events or otherwise, except as expressly required by law. Readers are cautioned not to put undue reliance on these forward-looking statements.
Neither the TSX Venture Exchange nor its Regulation Services Provider (as that term is defined in the policies of the TSX Venture Exchange) accepts responsibility for the adequacy or accuracy of this release.
SOURCE Imaflex Inc.

![]() View original content: http://www.newswire.ca/en/releases/archive/November2024/28/c8684.html
View original content: http://www.newswire.ca/en/releases/archive/November2024/28/c8684.html
© 2024 Benzinga.com. Benzinga does not provide investment advice. All rights reserved.


