Rotogravure Printing Machine Market Size Expected to Hit USD 2.8 Billion by 2031, Expanding at a 3.5% CAGR: Transparency Market Research, Inc.
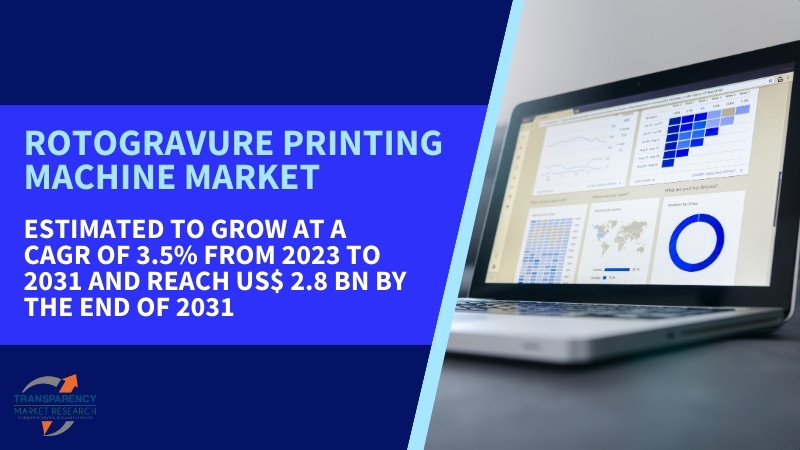
Wilmington, Delaware, United States, Transparency Market Research Inc. , Nov. 07, 2024 (GLOBE NEWSWIRE) — The global rotogravure printing machine market was projected to attain US$ 2 billion in 2022. It is anticipated to garner a 3.5% CAGR from 2023 to 2031 and by 2031, the market is likely to attain US$ 2.8 billion by 2031.
Newspapers, periodicals, and flex printing may be printed in large quantities using a gravure printing press. To guarantee excellent prints, the rotogravure printing method uses sophisticated cylinder engraving.
The packaging industry uses high-volume printing machines to boost output while preserving print quality in line with brand specifications. Businesses are able to print their desired logos, brand pictures, and other content on packaging materials with an industrial rotogravure press that is customized.
Request for a Sample PDF of this Research Report: https://www.transparencymarketresearch.com/sample/sample.php?flag=S&rep_id=36734
Global Rotogravure Printing Machine Market: Key Players
With modern technology, businesses operating in the global environment are making significant investments in product innovation. To expedite the packaging of products, businesses in the packaging industry are using automated printing equipment.
To increase their worldwide presence, they are entering into commercial contracts with well-known companies in the rotogravure printing machine industry. The following companies are well-known participants in the global rotogravure printing machine market:
- Bobst Group SA.
- Windmoeller & Hoelscher Corporation
- Comexi Group S.L.
- DCM-ATN
- KKA GmbH
- ROTATEK S.A.
- Uteco Converting SpA
- Shaanxi Beiren Printing Machinery Co., Ltd.
- Pelican Rotoflex Pvt Ltd.
- Fuji Kikai Kogyo Co Ltd
- Officine Meccaniche Giovanni Cerutti SpA
Key Findings of the Market Report
- In the food and beverage sectors, there is an increasing need for visually appealing and reasonably priced packaging.
- The cost of printing on substrates with rotogravure printing is cheap per unit.
- Businesses in the food and beverage industry favor it.
- With the use of precise rotogravure printing technology, businesses may efficiently communicate product specifications to their clientele through labels and tags.
- The market statistics for rotogravure printing machines are supported by the rise in demand for gravure printing in the e-commerce industry.
- High accuracy and print quality bulk printing is made possible by rotogravure printing machines.
Market Trends for Rotogravure Printing Machines
- Flexible packaging is utilized in a variety of end-use sectors, such as food and beverage, pharmaceuticals, cosmetics and personal care, industrial, and consumer products. Since rotogravure printing uses high-quality ink, it is often utilized in commercial packaging.
- The rotogravure printing machine market is growing because of the increase in demand for flexible packaging solutions in many sectors due to its efficient, long-lasting, and high-quality packaging.
- The packaging industry is seeing a rise in expenditures in technical improvements, which is changing the dynamics of the market. Leading manufacturers use high-speed rotogravure printing machines for flexible packaging in order to boost production through automated printing processes. These devices can print excellent designs on a variety of surfaces, including paper, metal, glass, and plastic.
Global Market for Rotogravure Printing Machine: Regional Outlook
Various reasons are propelling the growth of rotogravure printing machines throughout the region. These are:
- In 2022, Europe constituted the largest portion of the world’s landmass. From 2023 to 2031, the industry in the region is expected to grow at a CAGR of 2.1%.
- Over the next few years, Europe’s market share for rotogravure printing machines is expected to grow due to the continent’s high volume of magazine production and growing need for bulk printing solutions. Market expansion in the region is also being aided by the packaging industry’s rapid rise.
- The population’s growing consumption of packaged food is also fueling the need for rotogravure printing equipment in Europe’s food and beverage industry.
- Ultra-Processed Foods (UFDs) account for 12.0% of the average adult daily food intake amount in Europe, according to the National Institutes of Health, where adult consumption of UFDs is 328 g/day.
Unlock Growth Potential in Your Industry! Download PDF Brochure: https://www.transparencymarketresearch.com/sample/sample.php?flag=S&rep_id=36734
Key developments by the players in this market are:
- The multinational manufacturer of flexible packaging Takigawa Corporation expanded their operations in Bardstown, Kentucky, in October 2022 by adding a second HELIOSTAR gravure press from Windmoeller & Hoelscher Corporation. The 10-color HELIOSTAR gravure press allows for excellent mass printing on various materials.
- Berkshire Labels, a well-known producer of creative and superior self-adhesive labels, sticker sheets, and shrink sleeves in the United Kingdom, inked a deal with BOBST Group in October 2022 to acquire the BOBST DIGITAL MASTER 340 label press, an entirely automated and digitalized production line.
Global Rotogravure Printing Machine Market Segmentation
Ink Type
Substrate
- Plastic
- Aluminum Foil
- Paper & Paperboard
Drying Source
- Electrical
- Thermal Fluid
- Gas
Automation Type
- Automatic Rotogravure Machine
- Manual Rotogravure Machine
End Use
- Newspaper
- Security Printing
- Food & Beverages
- Pharmaceuticals
- Consumer Goods
- Industrial
- Others
Region
- North America
- Latin America
- Europe
- Asia Pacific
- Middle East & Africa
Get an Exclusive Discount Now to Access Industry Forecasts: https://www.transparencymarketresearch.com/checkout.php?rep_id=36734<ype=S
Explore Trending Reports of Packaging:
- Aerosol Cans Market – The global aerosol cans market stood at US$ 3.0 billion in 2022 and is projected to reach US$ 4.9 billion in 2031. The global aerosol cans market is anticipated to expand at a CAGR of 5.5% between 2023 and 2031.
- Flexible Packaging Market – The global flexible packaging market is projected to flourish at a CAGR of 4.9% from 2023 to 2031.
About Transparency Market Research
Transparency Market Research, a global market research company registered at Wilmington, Delaware, United States, provides custom research and consulting services. Our exclusive blend of quantitative forecasting and trends analysis provides forward-looking insights for thousands of decision makers. Our experienced team of Analysts, Researchers, and Consultants use proprietary data sources and various tools & techniques to gather and analyses information.
Our data repository is continuously updated and revised by a team of research experts, so that it always reflects the latest trends and information. With a broad research and analysis capability, Transparency Market Research employs rigorous primary and secondary research techniques in developing distinctive data sets and research material for business reports.
Contact:
Transparency Market Research Inc.
CORPORATE HEADQUARTER DOWNTOWN,
1000 N. West Street,
Suite 1200, Wilmington, Delaware 19801 USA
Tel: +1-518-618-1030
USA – Canada Toll Free: 866-552-3453
Website: https://www.transparencymarketresearch.com
Email: sales@transparencymarketresearch.com
Follow Us: LinkedIn| Twitter| Blog | YouTube

Market News and Data brought to you by Benzinga APIs
© 2024 Benzinga.com. Benzinga does not provide investment advice. All rights reserved.
Why Trump's Boost To Treasury Yields, Inflation Expectations May Weaken Fed's Efforts To Cut Interest Rates
Rising U.S. Treasury yields and a strengthening in the value of the dollar in the wake of Donald Trump’s return to the White House are threatening to counteract the Federal Reserve’s efforts to lower interest rates.
The Federal Reserve is expected to cut its benchmark interest rate by 25 basis points on Thursday, marking a back-to-back reduction and bringing the policy rate to a range of 4.5%-4.75%, the lowest since February 2023.
The bond market appears less influenced by the Fed’s dovish stance and more by the fiscal and inflationary implications of Trump’s victory in the 2024 presidential election.
Trump’s Fiscal Plans Drive Deficit Concerns
Trump’s proposed fiscal policies are expected to add significantly to the U.S. national debt.
According to the nonprofit Committee for a Responsible Federal Budget (CRFB), Trump’s tax and spending plans could increase the federal deficit by approximately $7.75 trillion between 2026 and 2035 in a baseline scenario.
This would push the debt-to-GDP ratio from 102% to a staggering 143%, or 18% higher than current law projections.
In a high-deficit scenario, the CRFB estimates that deficits could swell by $15.55 trillion, elevating the debt-to-GDP ratio to 157%.
Such a sharp rise in the national debt would necessitate a sharp increase in Treasury issuance by the government in the upcoming years, putting upward pressure on yields as investors demand higher returns to offset heightened risks of fiscal instability.
On top of that, Trump’s pledge to raise import tariffs — by 60% on goods from China and 10% on imports from other countries — is widely viewed by economists as an inflationary move.
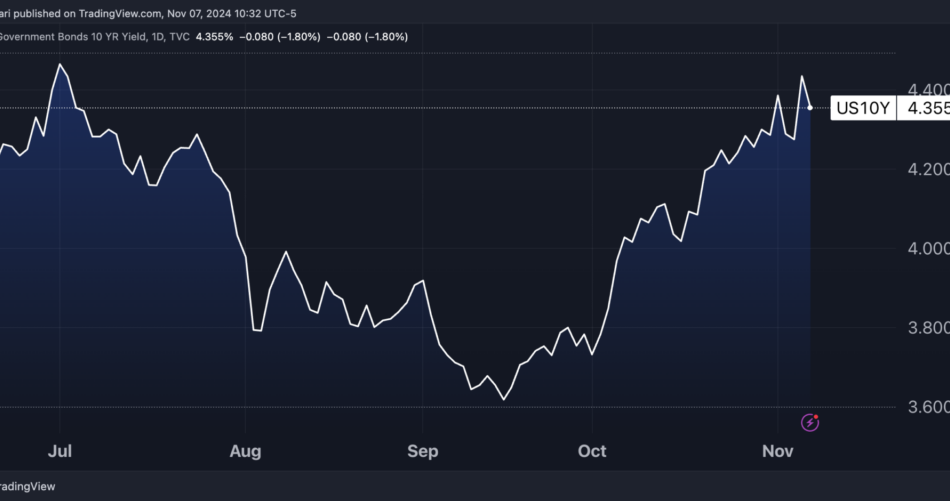
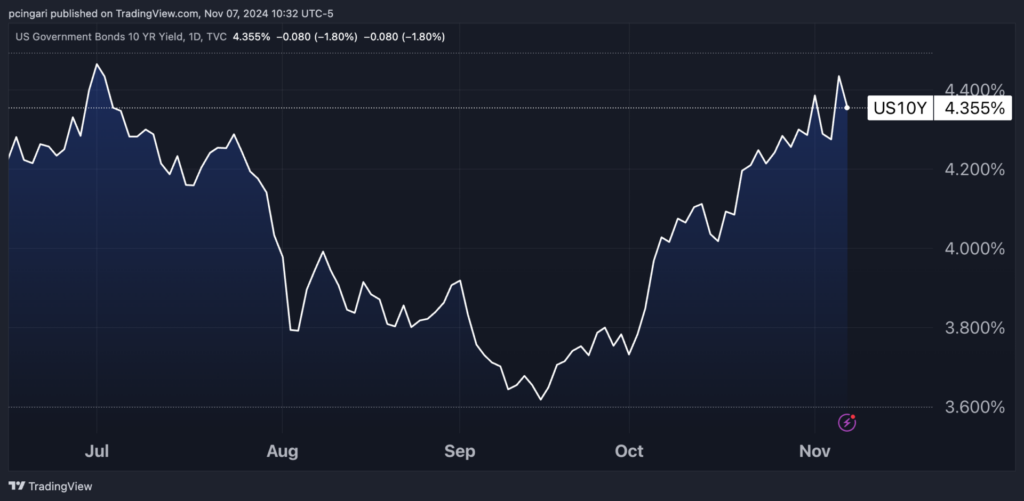
Treasury yields have surged sharply in under two months, with the 10-year yield climbing from 3.6% to 4.35%. As a result, the U.S. 10 Year Treasury Note ETF UTEN has fallen by over 5% since its September highs.
Chart: 10-Year Treasury Yields Spike, Anticipate Worsening Debt Path After 2024 Elections
Rising Yields Complicate Fed’s Easing Path
In the meantime, the Fed cut interest rates by 50 basis points in September and guided investors toward a further cut in November, a stance that would typically lower borrowing costs and ease financial conditions.
The bond market’s reaction has been the opposite, creating tighter financial conditions that investors wouldn’t normally expect under a Fed easing bias.
In addition to rising yields, the U.S. dollar has also strengthened significantly.
“Bond yields are rising for a good reason, as the economy is holding up stronger than expected and markets are also pricing in continued government spending and the potential for widening deficits,” said Glen Smith, chief investment officer at GDS Wealth Management.
The recent spike in yields is undermining the Fed’s attempts to ease financial conditions, the CIO said.
“Rising bond yields are reversing the Fed’s efforts to loosen policy, as bond yields determine the interest rates that consumers pay on mortgages and credit cards,” he said.
Smith suggested Thursday’s expected rate cut could be the last for a while, as the Fed might pause its rate cuts in December and into 2025 if the economy remains resilient and disinflation slows.
Inflation Expectations Spike With Trump Win
Trump’s return to the White House has heightened inflationary concerns.
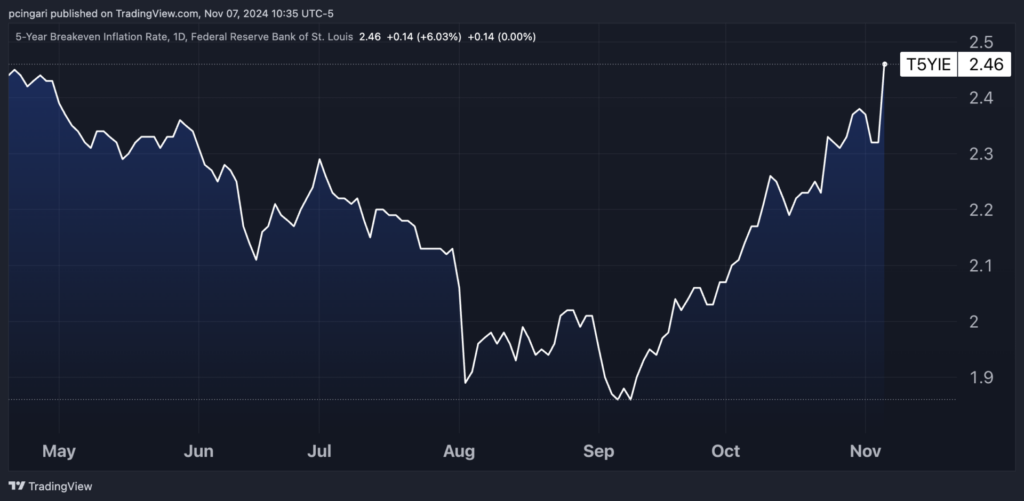
The five-year breakeven inflation rate, a widely watched gauge of inflation expectations derived from Treasury yields, rose by 14 basis points to 2.46% on Wednesday.
This shift indicates that investors are now anticipating inflation to average 2.5% over the next five years, well above the Fed’s 2% target.
Russell Shor, senior market specialist at Jefferies-owned trading platform Tradu, warned that Trump’s policies could push inflation even higher.
“With Trump’s return to the White House, the Fed may feel pressure to tighten its stance on inflation. His tariff and immigration plans could drive up prices, and the central bank will be watching closely for any inflation resurgence,” Shor said.
Chart: 5-Year Breakeven Inflation Rate Spikes To Nearly 2.5% After Trump’s Election Victory
Read Next:
Image created using Shutterstock and Fed photos with a background created using artificial intelligence via MidJourney.
© 2024 Benzinga.com. Benzinga does not provide investment advice. All rights reserved.
MLL Legal Selects Anaqua's AQX Law Firm Platform to Enhance IP Management and Drive Operational Efficiency
BOSTON, Nov. 07, 2024 (GLOBE NEWSWIRE) — Anaqua, the leading provider of innovation and intellectual property (IP) management technology, today announced that MLL Legal, one of Switzerland’s largest law firms, has selected Anaqua’s AQX® Law Firm platform to enhance its IP management capabilities for its clients.
MLL Legal is known for its expertise in innovative sectors such as fintech, blockchain, artificial intelligence, and life sciences. With over 250 professionals, including 150 lawyers, MLL Legal operates from offices in Zurich, Geneva, Lausanne, Zug, as well as international locations in London and Madrid. The firm is consistently recognized in prestigious legal publications and rankings for its extensive knowledge in commercial law. MLL Legal has been one of Switzerland’s leading law firms in the field of IP for decades.
By adopting Anaqua’s AQX Law Firm platform, MLL Legal will replace its current IP management system with a unified, scalable solution that integrates email archiving, document sharing, and workflow enhancements—all with an emphasis on design and trademark management. The platform’s multi-tiered access controls offer customizable security ensuring the safe handling of sensitive client data, while its collaborative features facilitate seamless teamwork both within the firm and with external clients.
“We chose Anaqua primarily for three reasons: its robust reporting tools, the intuitive user experience, and the out-of-the-box system functionality,” said Franziska Schweizer, head of the IP Prosecution Team at MLL Legal. “The AQX platform’s reporting tools enable us to quickly generate clear and comprehensible reports without the need for manual processing. This efficiency allows our team to focus more on delivering high-quality legal advice.”
Bob Romeo, CEO of Anaqua, added: “MLL Legal’s decision underscores the growing demand for innovative IP solutions within the European legal market. Our platform’s capabilities are designed to ensure increased efficiency and flexibility, enabling law firms like MLL Legal to better manage their clients’ IP portfolios while providing exceptional service.”
About Anaqua
Anaqua, Inc. is a premium provider of integrated technology solutions and services for the management of intellectual property (IP). Anaqua’s AQX® and PATTSY WAVE® IP management solutions combine best practice workflows with big data analytics and technology-enabled services to create an intelligent environment that informs IP strategies, enables IP decisions and streamlines IP processes. Today, nearly half of the 100 largest U.S. patent applicants and global brands, as well as a growing number of law firms worldwide, use Anaqua’s solutions. Over one million IP executives, lawyers, paralegals, administrators and innovators use the platform for their IP management. The company is headquartered in Boston, with additional offices in the United States, Europe, Asia, and Australia. For more information, please visit anaqua.com or LinkedIn.

Market News and Data brought to you by Benzinga APIs
© 2024 Benzinga.com. Benzinga does not provide investment advice. All rights reserved.
Bonds And Fed Front And Center As Bonds Approach Bottom Support Zone After Trump Win
To gain an edge, this is what you need to know today.
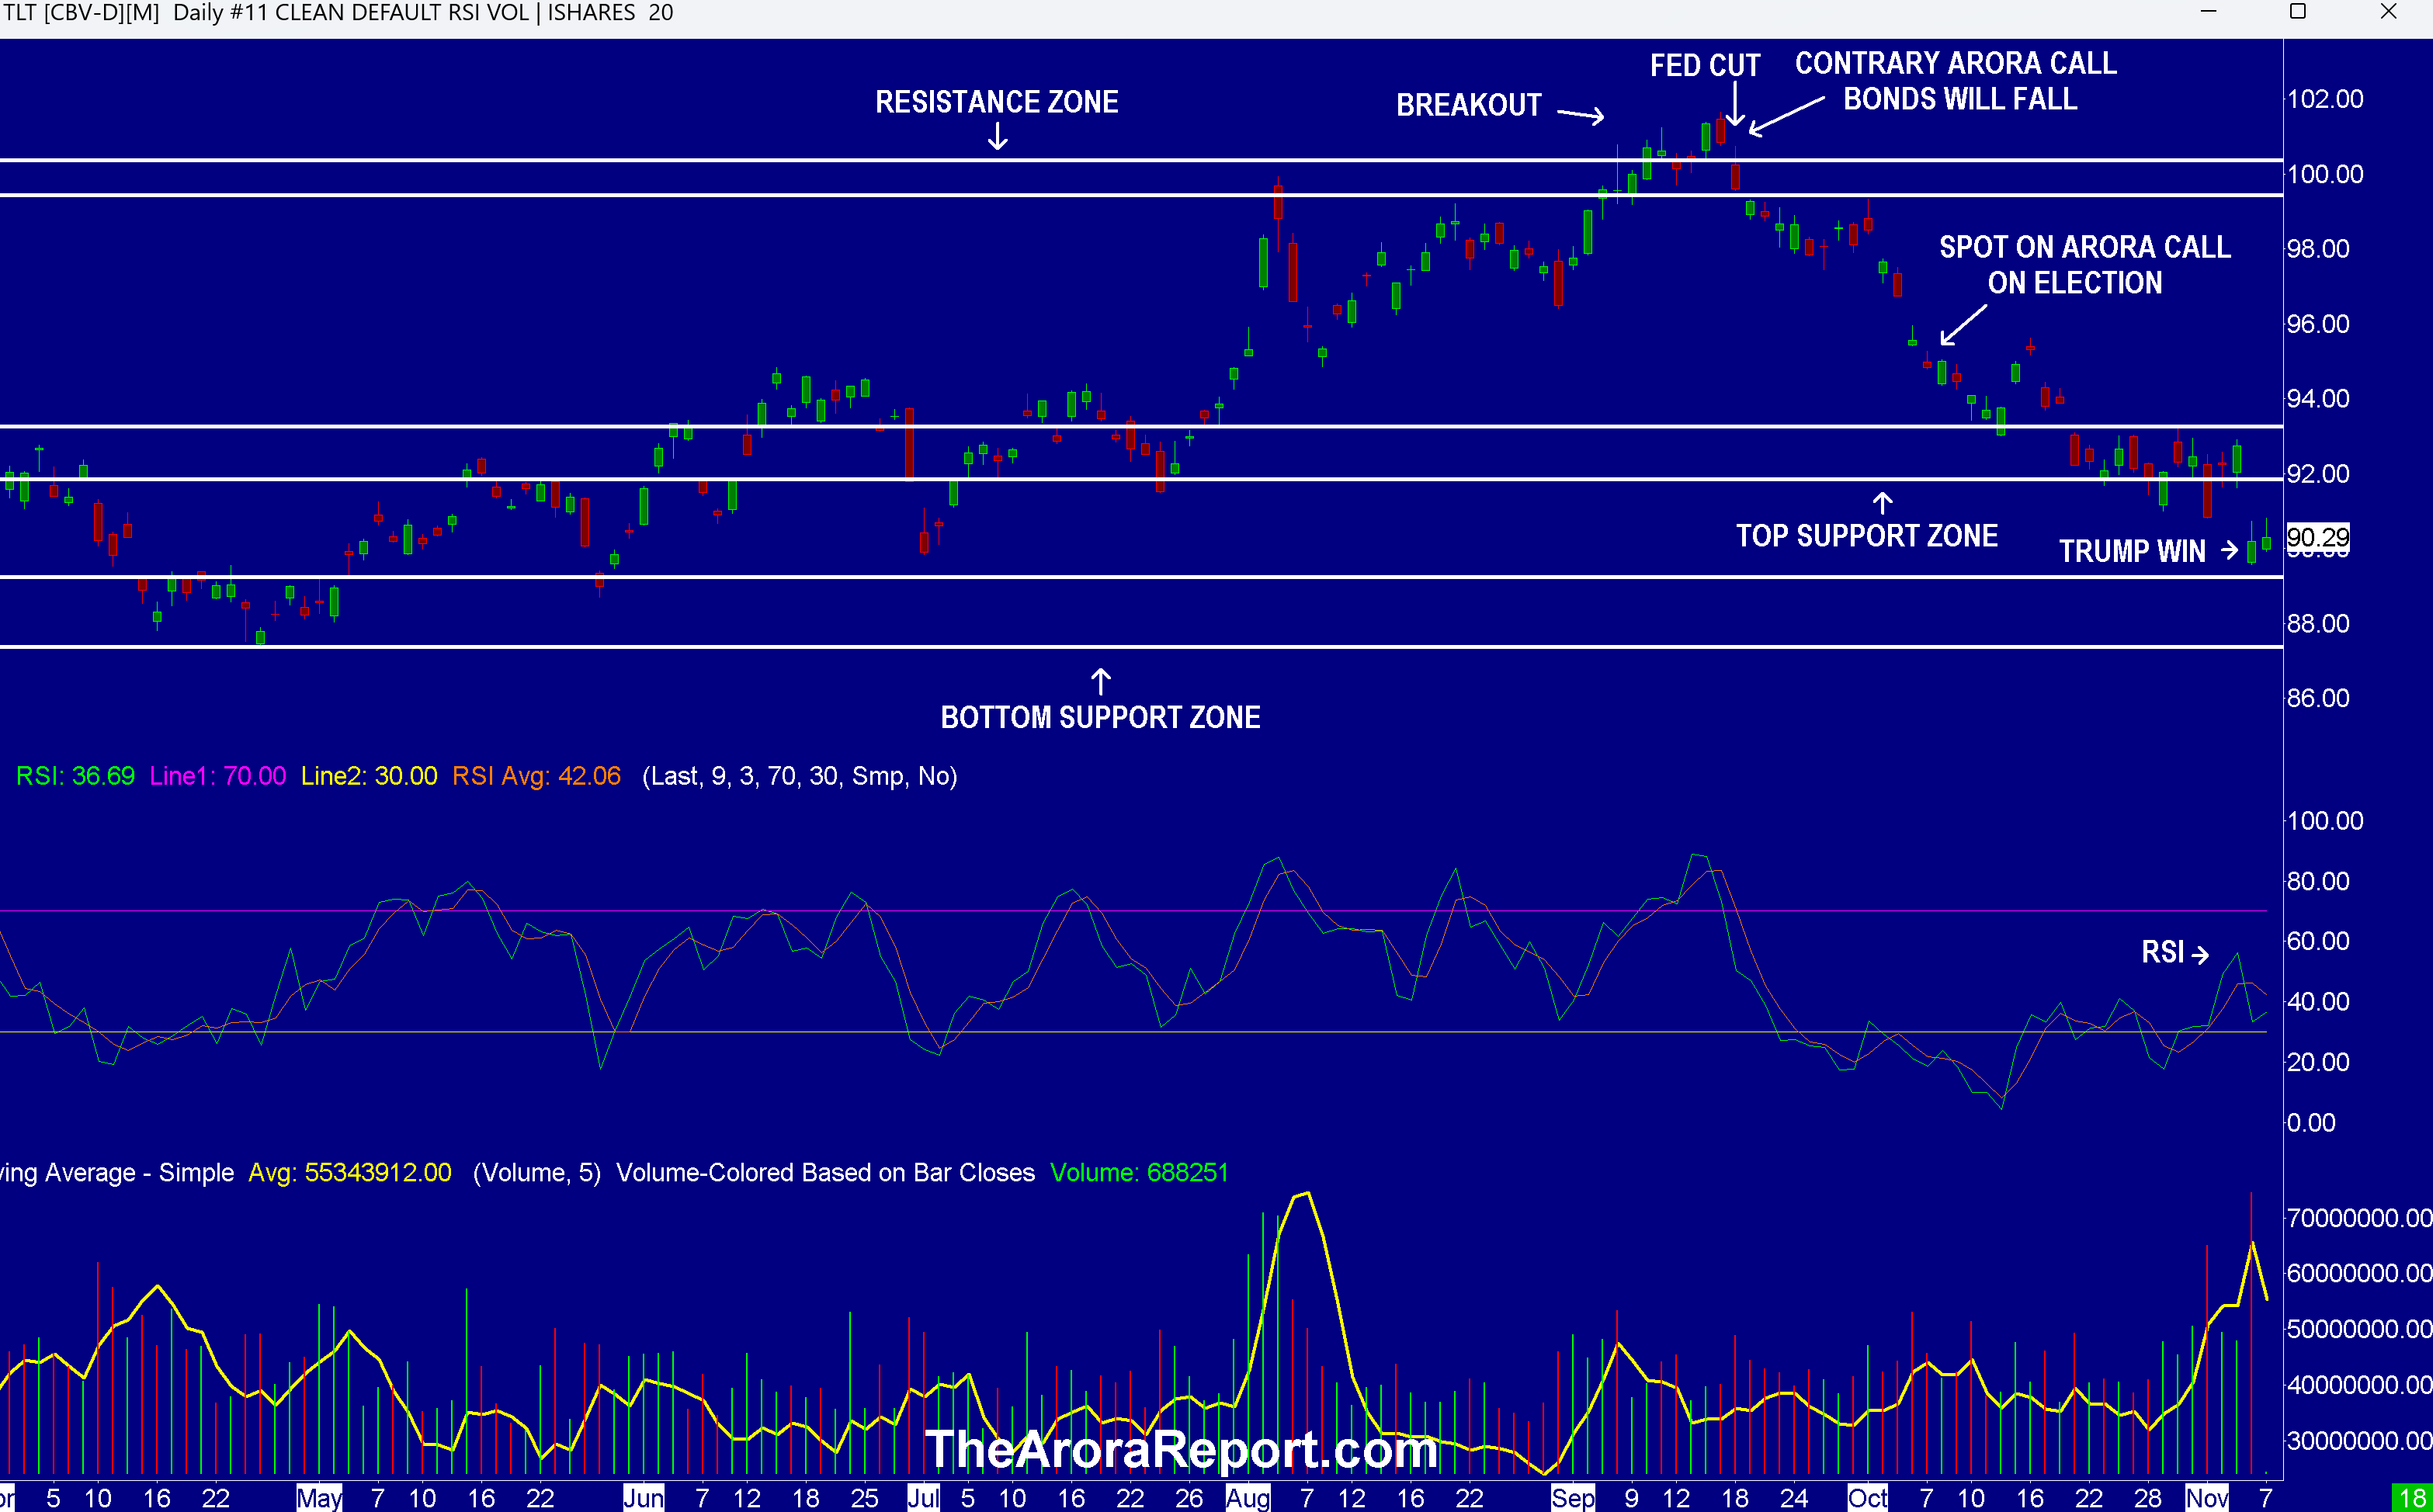
Bonds Fall On Trump Win
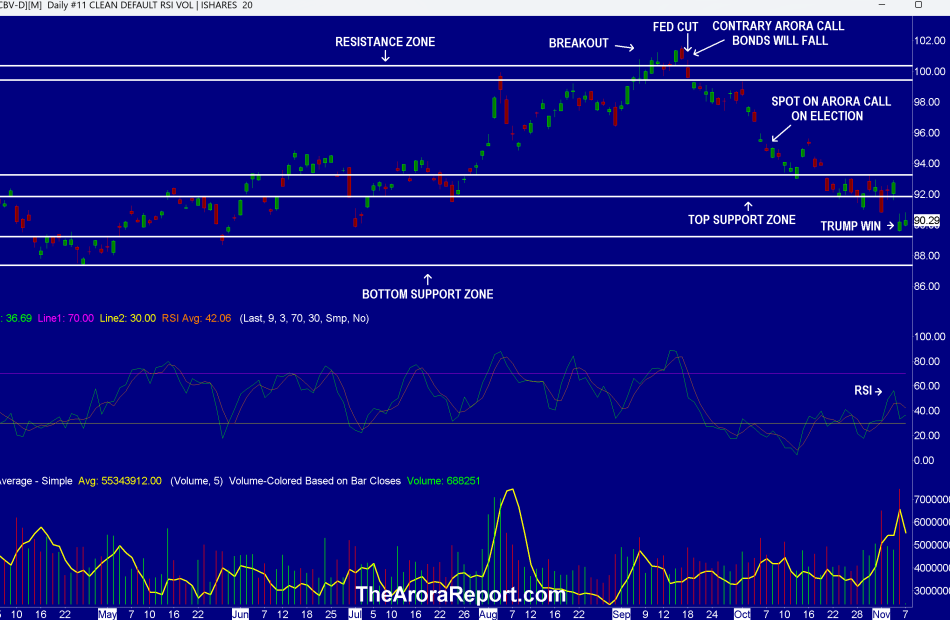
Please click here for an enlarged chart of iShares 20+ Year Treasury Bond ETF TLT.
Note the following:
- After Trump’s win, bonds are front and center.
- The chart shows when the contrary Arora call was made that bonds would fall. That call was made at a time when everyone was predicting that bonds would rise.
- The chart shows when the Arora call was made about the election. We wrote in the Morning Capsule on October 8, “In the event of a one party sweep, TLT can potentially fall to the bottom support zone.”
- The chart shows that the second Arora call on bonds has proven accurate after Trump’s win.
- The chart shows when Trump won the election.
- The chart shows that on Trump’s win, TLT gapped down and opened close to the top and of the bottom support zone. Yesterday’s bar does not show premarket data. In the premarket, TLT touched the top band of the support zone. On The Arora Report charts, premarket data is included on the current day, but not on the previous days. This methodology provides the most clarity.
- The FOMC will announce its rate decision at 2pm ET, followed by Powell’s press conference at 2:30pm ET.
- The consensus is that the Fed will cut rates by 25 bps.
- In The Arora Report analysis, the Fed could not possibly be happy about the large drop in bonds after the last rate cut. We will be paying careful attention to what Powell says about the drop in bonds in his press conference. If Powell says anything about this subject, it will be the most important new information that can be gleaned today.
- Most institutional investors and many retail investors have suffered massive losses in bonds. It is important to remember that the largest amount of money is still managed using the 60/40 portfolio as a starting point. This means 60% in stocks and 40% in bonds. The Arora Report has long shown that following the protection band is heads and shoulders above following the 60/40 portfolio. Nonetheless, the dogma of 60/40 remains popular. This is the reason we publish information on 60/40 portfolios. For those following the 60/40 portfolio, The Arora Report call has been to limit the duration to less than five years. The Arora Report call on duration has been consistent at a time when a vast majority of money managers were significantly increasing duration. The longer the bond duration, the larger the losses investors have suffered.
- In The Arora Report analysis, after Trump’s election the Fed is faced with two important issues:
- In The Arora Report analysis, depending upon how Trump implements his tariff plan, it may add 0.5% – 1% to inflation.
- According to the nonpartisan Committee for a Responsible Federal Budget, Trump’s tax plans will increase the national deficit by $7.8T over the next 10 years. All of this deficit will have to be financed by borrowing. This will increase the supply of Treasuries. A higher supply of Treasuries will lead to higher interest rates on the long end, unless the Fed decides to manipulate it with quantitative easing or some other artificial method.
- At a time when the stock market is at an all time high and bonds are suffering major losses, there is not good news on the economic data front.
- Unit labor costs are spiking. Q3 Unite Labor Costs – Preliminary came at 1.9% vs. 0.5% consensus.
- As of this writing, the momo crowd is oblivious. However, expect smart money to pay attention to this important, highly inflationary data. Also expect the Fed to pay attention to this data.
- Initial jobless claims came at 221K vs. 222K consensus. This indicates that the employment picture remains strong, especially at the low end.
- In The Arora Report analysis, there is another important question that the Fed will have to face. Trump plans to deport undocumented immigrants. According to the Department of Homeland Security, there are about 11M undocumented immigrants in the U.S. What happens to labor supply at the low end if 11M workers are taken out of the workforce? What does it do to inflation? What does it do to economic growth, and in turn the stock and bond markets?
England
The Bank of England has cut interest rates. The key interest has been reduced to 4.75% from 5%.
This is the first cut by a major central bank after Trump’s election. Investors should keep an eye on how the European Central Bank and the Bank of Japan act after Trump’s election. Remember, the U.S. economy is intertwined with the global economy.
Magnificent Seven Money Flows
In the early trade, money flows are positive in Apple Inc AAPL, Amazon.com, Inc. AMZN, Alphabet Inc Class C GOOG, Meta Platforms Inc META, Microsoft Corp MSFT, and NVIDIA Corp NVDA.
In the early trade, money flows are negative in Tesla Inc TSLA.
In the early trade, money flows are positive in SPDR S&P 500 ETF Trust SPY and Invesco QQQ Trust Series 1 QQQ.
Momo Crowd And Smart Money In Stocks
Investors can gain an edge by knowing money flows in SPY and QQQ. Investors can get a bigger edge by knowing when smart money is buying stocks, gold, and oil. The most popular ETF for gold is SPDR Gold Trust GLD. The most popular ETF for silver is iShares Silver Trust SLV. The most popular ETF for oil is United States Oil ETF USO.
Bitcoin
Bitcoin BTC/USD is range bound.
Protection Band And What To Do Now
It is important for investors to look ahead and not in the rearview mirror. The proprietary protection band from The Arora Report is very popular. The protection band puts all of the data, all of the indicators, all of the news, all of the crosscurrents, all of the models, and all of the analysis in an analytical framework that is easily actionable by investors.
Consider continuing to hold good, very long term, existing positions. Based on individual risk preference, consider a protection band consisting of cash or Treasury bills or short-term tactical trades as well as short to medium term hedges and short term hedges. This is a good way to protect yourself and participate in the upside at the same time.
You can determine your protection bands by adding cash to hedges. The high band of the protection is appropriate for those who are older or conservative. The low band of the protection is appropriate for those who are younger or aggressive. If you do not hedge, the total cash level should be more than stated above but significantly less than cash plus hedges.
A protection band of 0% would be very bullish and would indicate full investment with 0% in cash. A protection band of 100% would be very bearish and would indicate a need for aggressive protection with cash and hedges or aggressive short selling.
It is worth reminding that you cannot take advantage of new upcoming opportunities if you are not holding enough cash. When adjusting hedge levels, consider adjusting partial stop quantities for stock positions (non ETF); consider using wider stops on remaining quantities and also allowing more room for high beta stocks. High beta stocks are the ones that move more than the market.
Traditional 60/40 Portfolio
Probability based risk reward adjusted for inflation does not favor long duration strategic bond allocation at this time.
Those who want to stick to traditional 60% allocation to stocks and 40% to bonds may consider focusing on only high quality bonds and bonds of five year duration or less. Those willing to bring sophistication to their investing may consider using bond ETFs as tactical positions and not strategic positions at this time.
The Arora Report is known for its accurate calls. The Arora Report correctly called the big artificial intelligence rally before anyone else, the new bull market of 2023, the bear market of 2022, new stock market highs right after the virus low in 2020, the virus drop in 2020, the DJIA rally to 30,000 when it was trading at 16,000, the start of a mega bull market in 2009, and the financial crash of 2008. Please click here to sign up for a free forever Generate Wealth Newsletter.
Market News and Data brought to you by Benzinga APIs
© 2024 Benzinga.com. Benzinga does not provide investment advice. All rights reserved.
Interra Capital Group Successfully Closes on the Acquisition of Remington Square
HOUSTON, Nov. 7, 2024 /PRNewswire/ — Interra Capital Group, a leader in commercial real estate investments, is pleased to announce the successful acquisition of Remington Square, a distinguished three-building class A office portfolio strategically located in Houston, Texas. The financial terms of the transaction remain undisclosed, underscoring the private nature of this significant real estate deal.
Jack Polatsek, CEO of Interra Capital Group, expressed his enthusiasm about the acquisition, stating, “Closing on Remington Square comes at a pivotal time when we see a strengthening trend of return to office that aligns with the Federal Reserve cutting their benchmark rates, enhancing the intrinsic value of well-located office properties. This property represents not just an investment in real estate but an opportunity to capitalize on market dynamics that favor well-positioned assets like Remington Square.”
Judah Westreich, Chief Financial Officer at Interra Capital Group, also shared his insights: “This acquisition reflects our strategic initiative to enhance our portfolio’s quality and performance. Remington Square stands out as a prime example of the type of asset that can deliver robust returns in the current economic climate, where discerning investment and proactive management are key.”
Anita Kundaje, Director of Acquisitions at Interra Capital Group, highlighted the company’s strategy in the real estate market. “Interra is decisively in acquisition mode, aggressively pursuing opportunities to expand our portfolio with assets that demonstrate significant upside potential and strategic value,” said Kundaje. “We are actively seeking properties that align with our rigorous criteria for sustainable growth and investment returns. Our recent acquisition of Remington Square is a testament to this focused approach, as we continue to capitalize on favorable market conditions to enhance our holdings.”
About Remington Square Remington Square is a premium office complex totaling 392,357 square feet across approximately 16.96 acres in Houston, Texas. It serves as a hub for diverse businesses, featuring state-of-the-art amenities such as an on-site restaurant, a modern fitness center, tenant lounges, and ample parking with a ratio of 4.57/1,000 SF. Its strategic location affords excellent regional accessibility and proximity to Houston’s rapidly growing residential areas, making it a coveted location for existing and prospective tenants.
About Interra Capital Group Interra Capital Group is a prominent real estate investment firm specializing in the acquisition and management of commercial properties across the United States. Interra is committed to creating value through strategic investments and diligent asset management.
![]() View original content:https://www.prnewswire.com/news-releases/interra-capital-group-successfully-closes-on-the-acquisition-of-remington-square-302296998.html
View original content:https://www.prnewswire.com/news-releases/interra-capital-group-successfully-closes-on-the-acquisition-of-remington-square-302296998.html
SOURCE Interra Capital Group
Market News and Data brought to you by Benzinga APIs
© 2024 Benzinga.com. Benzinga does not provide investment advice. All rights reserved.
Nasdaq 100 Extends Record Levels Ahead Of Fed Meeting, Tesla Hits 26-Month Highs, Small Caps Stall: What's Driving Markets Thursday?
After Wednesday’s “everything rally” spurred by the election results, investors took a less euphoric approach on Thursday ahead of the Federal Open Market Committee (FOMC) meeting.
The Fed is widely expected to cut interest rates by 25 basis points, bringing them to a range of 4.5%-4.75%, following a previous 50-basis-point cut in September.
Yet, all eyes are on Fed Chair Jerome Powell’s comments at 2:30 p.m. ET regarding the potential for future rate hikes and his views on inflation risks. Concerns from the market center on the possibility of a policy U-turn driven by higher fiscal deficits and price pressures from trade tariffs under a Trump administration.
Tech stocks led gains, with the Nasdaq 100 extending its record-breaking levels, surpassing 21,000 points and eyeing a third consecutive positive session. The S&P 500 and Dow Jones posted more modest gains, while the Russell 2000 paused after Wednesday’s 5.8% leap.
Tesla Inc. TSLA remained a top performer among mega-cap stocks, bolstered by expectations of Elon Musk‘s influence in the upcoming administration.
Treasury yields reversed a substantial portion of Wednesday’s post-election increase, while the U.S. dollar dipped by 0.7%.
Metal commodities rebounded after Wednesday’s sharp losses, with gold rising 1.3%, silver up 2% and copper rallying over 4%.
Oil prices strengthened by 1%, with West Texas Intermediate trading around $72 per barrel.
Bitcoin BTC/USD rose 0.8%, reaching $76,000 to extend its record highs, while Ethereum ETH/USD outperformed with a gain of over 4%.
| Major Indices | Price | 1-day % chg |
| Nasdaq 100 | 21,050.78 | 1.3% |
| S&P 500 | 5,968.27 | 0.7% |
| Dow Jones | 43,748.20 | 0.0% |
| Russell 2000 | 2,389.10 | -0.2% |
According to Benzinga Pro data:
- The SPDR S&P 500 ETF Trust SPY rose 0.7% to $594.84.
- The SPDR Dow Jones Industrial Average DIA stalled at $437.25.
- The tech-heavy Invesco QQQ Trust Series QQQ soared 1.3% to $512.38.
- The iShares Russell 2000 ETF IWM eased 0.3% to $236.67.
- The Technology Select Sector SPDR Fund XLK outperformed, rising 1.3%. The Financials Select Sector SPDR Fund XLF lagged, down 1.2%.
Some relevant reactions to earnings reports are:
- Qualcomm Inc. QCOM, up 0.1%,
- Gilead Sciences Inc. GILD, up 6.2%,
- MercadoLibre Inc. MELI, down 16%,
- APPLovin Corp. APP, up 43%,
- McKesson Corp. MCK, up 11%,
- Take-Two Interactive Software Inc. TTWO, up 6.3%,
- Transdigm Group Inc. TDG, down 4.4%
Read Next:
This image was created using artificial intelligence.
Market News and Data brought to you by Benzinga APIs
© 2024 Benzinga.com. Benzinga does not provide investment advice. All rights reserved.
Lyft Teams Up With Intel's Mobileye, May Mobility For Robotaxi Services As Tesla Gears Up To Enter Autonomous Riding Hailing Market
Uber’s rival ride-hailing platform, Lyft Inc. LYFT said on Wednesday that it has partnered with Intel Corp.-owned INTC Mobileye, and May Mobility to provide autonomous vehicle rides to its customers.
What Happened: As part of Lyft’s partnership with Intel-owned Mobileye, the company will make its scaled rideshare platform available to all vehicles with Mobileye’s self-driving technology.
“The objective is for future AV operators who want to deploy and manage large-scale fleets in various metropolitan areas in North America to purchase Mobileye Drive equipped, “Lyft-ready” vehicles from vehicle builders, access Lyft’s rider demand and optimize utilization and profitability of their fleets,” Mobileye said about the partnership.
The companies, however, did not reveal when the first vehicles with Mobileye’s self-driving technology will show on the Lyft app.
May Mobility, meanwhile, will directly deploy autonomous vehicles to the Lyft platform in Atlanta starting in 2025, Lyft said. Lyft customers in Atlanta can be matched with a fleet of autonomous Toyota Sienna minivans equipped with May Mobility’s autonomous technology as part of the partnership. The company, however, did not specify the number of vehicles that will be deployed.
“Lyft’s aim is to connect AVs, drivers, riders, and partners to create new opportunities for all. Our rideshare network will continue to evolve as millions of people will have the opportunity to earn billions of dollars whether they choose to drive, put their AVs into service, or both,” David Risher, CEO of Lyft, said.
Why It Matters: Lyft’s AV comes on the heels of Tesla Inc.’s TSLA announcement that it expects to start an autonomous ride-hail service in Texas and California starting next year, subject to regulatory approval.
However, the vehicles might not all operate as driverless robotaxis initially as some states demand a safety driver until the company touches certain milestones in terms of miles and hours driven, the company then said.
However, company CEO Elon Musk expressed confidence that the company will be operating driverless paid rides sometime next year.
Tesla also unveiled a no-pedal, no-steering wheel dedicated robotaxi product last month called the Cybercab. Cybercab, Musk then said, will enter production ‘before 2027′ and will be priced below $30,000. Until then, the ride-hail fleet will be composed of the company’s Model 3 and Model Y.
Uber, meanwhile, has a partnership with Alphabet Inc’s Waymo since 2023. Earlier this year, Uber said that Waymo and Uber would bring the latter’s fully autonomous, all-electric Jaguar I-PACE vehicles to Austin and Atlanta starting in early 2025 on the Uber app.
Price Action: Lyft shares closed up 4.4% at $14.4 on Wednesday, and surged over 20% in after-hours trading. The stock is up 4.4% year-to-date, according to data from Benzinga Pro.
Check out more of Benzinga’s Future Of Mobility coverage by following this link.
Read Next:
Photo courtesy: Shutterstock
Market News and Data brought to you by Benzinga APIs
© 2024 Benzinga.com. Benzinga does not provide investment advice. All rights reserved.
Novo Nordisk's stock hits 9-month low as 2025 guidance underwhelms
MILAN (Reuters) — Danish drugmaker Novo Nordisk’s (NVO, NOVO-B.CO) shares hit an over 9-month low on Thursday after surging more than 8% the previous day, as underwhelming guidance for next year overshadowed strong sales growth for its popular Wegovy weight-loss drug.
The two-day move saw Europe’s biggest company by market cap trade in a wide 14-percentage-point range from low to high. On Thursday morning, the stock was down 3% in Copenhagen, after earlier falling 5.5% to its lowest since January.
In an analyst call on Wednesday, following a quarterly release that eased concerns that demand for Wegowy was slowing, Novo’s finance chief Karsten Munk Knudsen said sales growth next year could be in the high percentage teens.
Barclays said commentary on 2025 weighed on the shares. “We had a call back with IR and the moving parts seem to indicate (at least what we know now) a midpoint for FY25 top line a touch lower than current company consensus,” Emily Field, analyst at the UK bank, wrote in a note, affirming her overweight rating on the stock.
The company will formally guide for 2025 in February.
US-listed Novo shares were up 1.6% in premarket trading on Thursday, having lost over 4% the prior session.
Gilles Guibout, head of European equity strategies at AXA Investment Managers in Paris, said the sharp moves in Novo’s shares were probably due to hedge fund action.
“Novo Nordisk is a widely held stock. Its market has significant potential. However, it’s easier to find sellers than buyers for the stock, as everyone already holds plenty of it,” he said.
“It’s a stock that needs to be normalised. At the beginning of the year, there was too much hype around it,” he added.
Novo Nordisk shares are up around 4% so far this year, but they have fallen almost 30% from the record high set in June.
The stock trades at a 27 times its expected earnings, a 22% premium to its 20-year average valuation, according to LSEG Datastream data. It is worth around $470 billion.
(Reporting by Danilo Masoni; Editing by Amanda Cooper)
OpenAI Acquires Dharmesh Shah's $15.5M Domain Chat.com: What's Behind The Move?
ChatGPT-parent OpenAI, under the leadership of Sam Altman, has taken over the domain chat.com, which was previously under the ownership of HubSpot‘s founder and CTO, Dharmesh Shah.
What Happened: On Wednesday, Altman posted a cryptic post on X, formerly Twitter, using the words, “chat.com,” only. The URL now redirects to ChatGPT.
Following Altman’s post, Shah also took to X and confirmed the purchase, indicating that he might have received OpenAI shares in exchange for the domain.
See Also: Google Delivers New AI Features To Maps, Google Earth, Waze Apps
Shah had initially bought the domain for $15.5 million in early 2023 but sold it a few months later for an undisclosed amount, which he confirmed was higher than the purchase price.
Shah’s initial purchase of chat.com was driven by his belief in the potential of Chat-based UX, facilitated by Generative AI.
Subscribe to the Benzinga Tech Trends newsletter to get all the latest tech developments delivered to your inbox.
Why It Matters: OpenAI’s acquisition of chat.com follows its recent transition from a nonprofit to a for-profit model, a move that sparked a financial and governance tug-of-war with Microsoft Corporation MSFT.
The ChatGPT parent has been on a financial upswing, with its valuation soaring to $157 billion in its latest funding round. Previously, it was reported that the AI startup intends to more than double the price of its flagship product, ChatGPT, over the next five years.
Last month, OpenAI rolled out ChatGPT Search, a feature that allows the AI to crawl the web for up-to-date news, sports scores, stock quotes, and more.
Check out more of Benzinga’s Consumer Tech coverage by following this link.
Read Next:
Disclaimer: This content was partially produced with the help of Benzinga Neuro and was reviewed and published by Benzinga editors.
Market News and Data brought to you by Benzinga APIs
© 2024 Benzinga.com. Benzinga does not provide investment advice. All rights reserved.

