Nvidia Set to Replace Intel in the Dow Jones Industrial Average
(Bloomberg) — Nvidia Corp., the chipmaker at the heart of the artificial intelligence boom, is joining the oldest of Wall Street’s three main equity benchmarks.
Most Read from Bloomberg
The company will replace rival Intel Corp. in the 128-year-old Dow Jones Industrial Average prior to the start of trading on Nov. 8, S&P Dow Jones Indices said in a statement late Friday. Sherwin-Williams Co. is also joining, replacing Dow Inc.
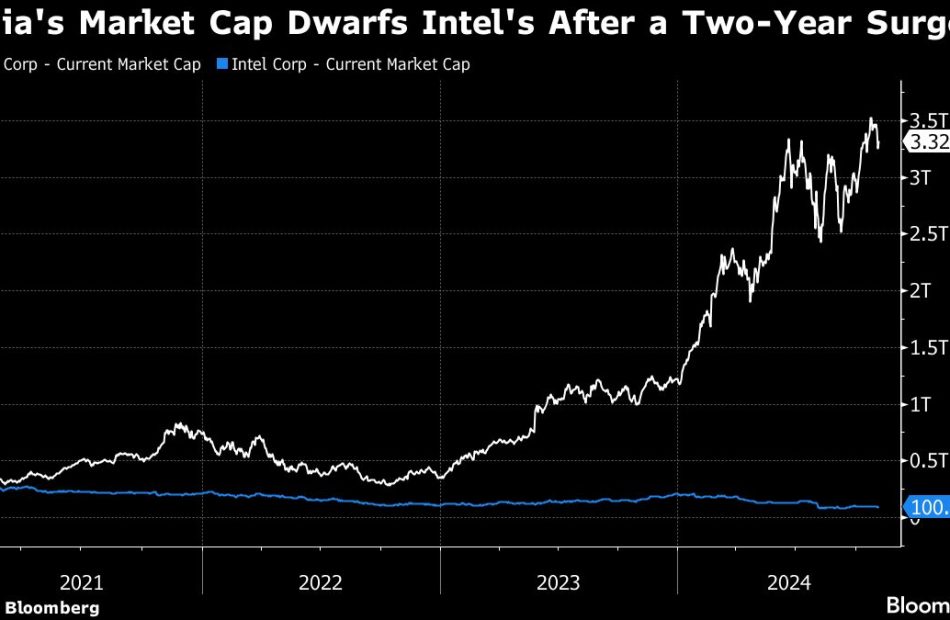
The addition of Nvidia to the blue-chip index is a testament to the power of the AI-driven rally that’s pushed the chipmaker up 900% in the past 24 months. The Dow Jones Industrial Average was the only major US equity benchmark that didn’t hold Nvidia — until now.
“Nvidia is a well-run company and joining the Dow demonstrates just how powerful its rally has been in recent years after it was at the right place at the right time when no one else was,” said Scott Colyer, chief executive at Advisors Asset Management.
The Santa Clara, California-based company has been the poster child of the euphoria surrounding AI and the biggest driver of stock market gains. The chipmaker ended the week with a market value of $3.32 trillion, about $50 billion shy of Apple Inc. Shares were up 3.2% in post-market trading, putting Nvidia in a position to dethrone Apple as the world’s most valuable company as soon as Monday if the gains hold.
Intel joined the gauge in November 1999 when it was added along with Microsoft Corp., SBC Communications and Home Depot Inc. Once the industry leader in computer processors, Intel has been recently struggling under a turnaround plan. The company has slashed spending in 2024, cut jobs and suspended investor payouts. Shares have lost 54% this year, and sank another 2% after the bell.
“Intel has lagged in a huge way,” said Adam Sarhan, founder of 50 Park Investments. “Now, the Dow is evolving. You don’t want to see stocks that were there 30 years ago. You want to see what’s the strongest that survive today.”
Midland, Michigan-based Dow Inc. has been in the blue-chip index since 2019, when it was spun off by former parent DowDuPont.
The Dow Jones Industrial Average, which first started as an index of 12 industrial stocks that included General Electric Co., has faced criticism for being a much narrower equities gauge than the S&P 500 Index or the Nasdaq 100 and lacking technology stocks that have dominated markets in recent years.
Tech Stocks Surge But S&P 500 Faces Second Weekly Decline, Amazon Rallies, Bitcoin Drops Below $70,000: What's Driving Markets Friday?
Wall Street rebounded Friday following Thursday’s selloff, yet midday gains were still insufficient to prevent a second consecutive weekly decline for the S&P 500, currently down 1% for the week.
Concerns over tech earnings eased after Amazon.com Inc. AMZN outperformed expectations, restoring some risk appetite and supporting the sector rebound.
Amazon shares surged over 6%, heading for their best session since February.
The Nasdaq 100, up by 1.1%, outperformed the S&P 500, up 0.8%.
In economic data, the U.S. economy added just 12,000 jobs in October, a steep drop from the 223,000 gain in September and well below the forecast of 113,000, as hurricanes and strikes led to hiring freezes nationwide.
Despite the weak job figures, the unemployment rate held steady at 4.1%, indicating companies chose to retain workers rather than downsize.
The ISM Manufacturing PMI signaled contraction for the seventh consecutive month in October, with the index missing estimates.
Oil prices experienced a volatile session, initially spiking on reports of an imminent retaliatory attack by Iran on Israel before pulling back as those concerns faded. Gold edged down 0.1%.
Bitcoin BTC/USD dipped 0.3%, slipping below the $70,000 mark.
Friday’s Performance In Major US Indices, ETFs
| Major Indices | Price | 1-day % change |
| Nasdaq 100 | 20,123.15 | 1.2% |
| Dow Jones | 42,161.88 | 1.0% |
| S&P 500 | 5,751.05 | 0.8% |
| Russell 2000 | 2,209.70 | 0.6% |
According to Benzinga Pro data:
- The SPDR S&P 500 ETF Trust SPY rose 0.9% to $573.75.
- The SPDR Dow Jones Industrial Average DIA rose 1.1% to $422.09.
- The tech-heavy Invesco QQQ Trust Series QQQ rallied 1.2% to $489.80.
- The iShares Russell 2000 ETF IWM rose 0.8% to $219.26.
- The Consumer Discretionary Select Sector SPDR Fund XLY outperformed, rising 2%. The Utilities Select Sector SPDR Fund XLU lagged, down 1.4%.
Friday’s Stock Movers
Stocks reacting to earnings reports included:
- Apple Inc. AAPL, down 1.6%.
- Intel Corp. INTC, up over 6%.
- Atlassian Corp. TEAM, up 20%.
- Exxon Mobil Corp. XOM, down 0.7%.
- Chevron Corp. CVX, up 2.8%.
- Charter Communications Inc. CHTR, up 13%.
- Dominon Energy Inc. D, down 0.2%.
- Cardinal Health Inc. CAH, up 6%.
- CBOE Global Markets Inc. CBOE, down 2.9%.
- Waters Corp. WAT, up 17%.
Read Next:
Image created using artificial intelligence via Midjourney.
Market News and Data brought to you by Benzinga APIs
© 2024 Benzinga.com. Benzinga does not provide investment advice. All rights reserved.
Cryptocurrency Bittensor Down More Than 3% Within 24 hours
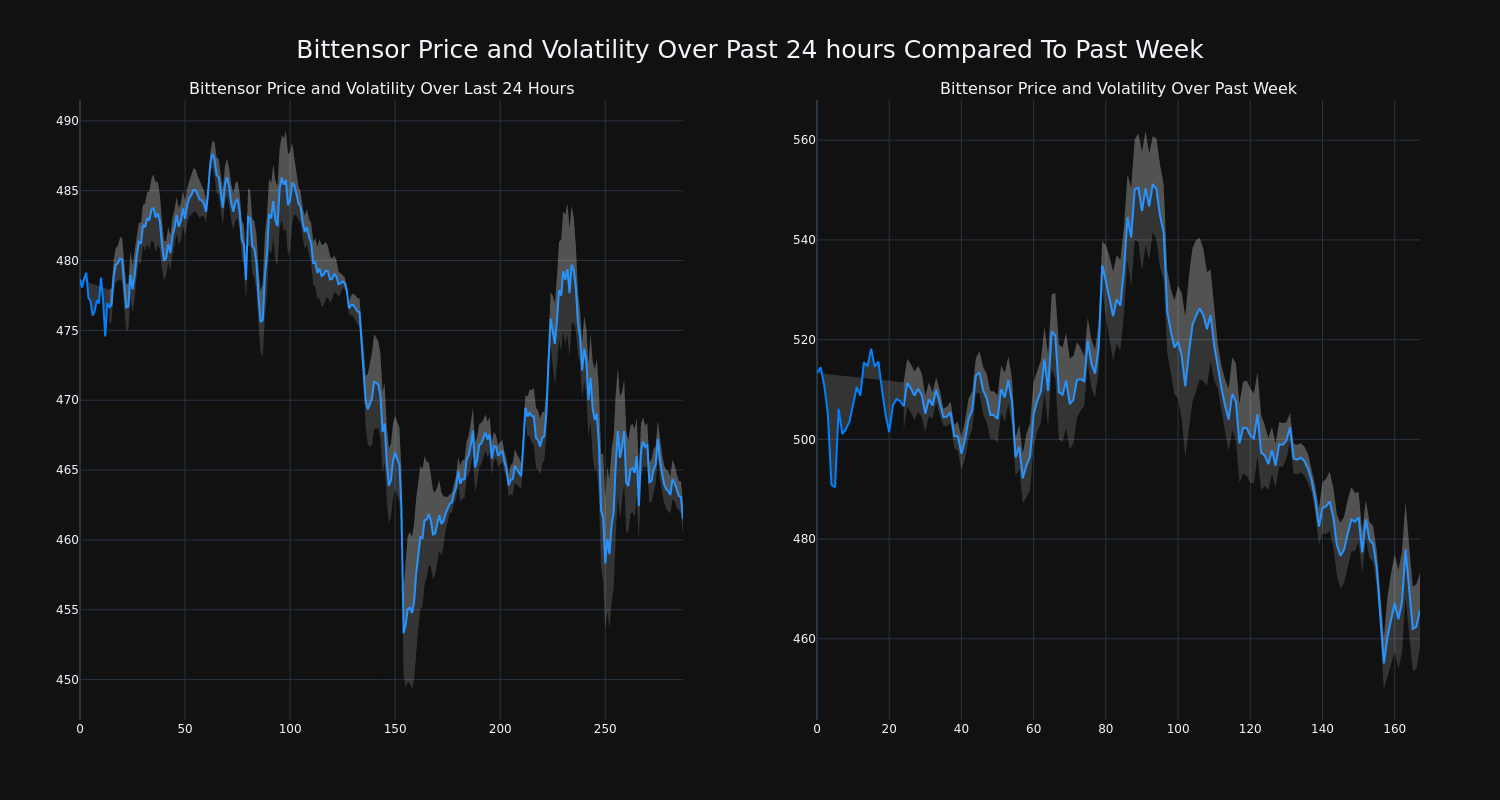
Bittensor’s TAO/USD price has decreased 3.49% over the past 24 hours to $461.95, continuing its downward trend over the past week of -9.0%, moving from $513.3 to its current price.
The chart below compares the price movement and volatility for Bittensor over the past 24 hours (left) to its price movement over the past week (right). The gray bands are Bollinger Bands, measuring the volatility for both the daily and weekly price movements. The wider the bands are, or the larger the gray area is at any given moment, the larger the volatility.
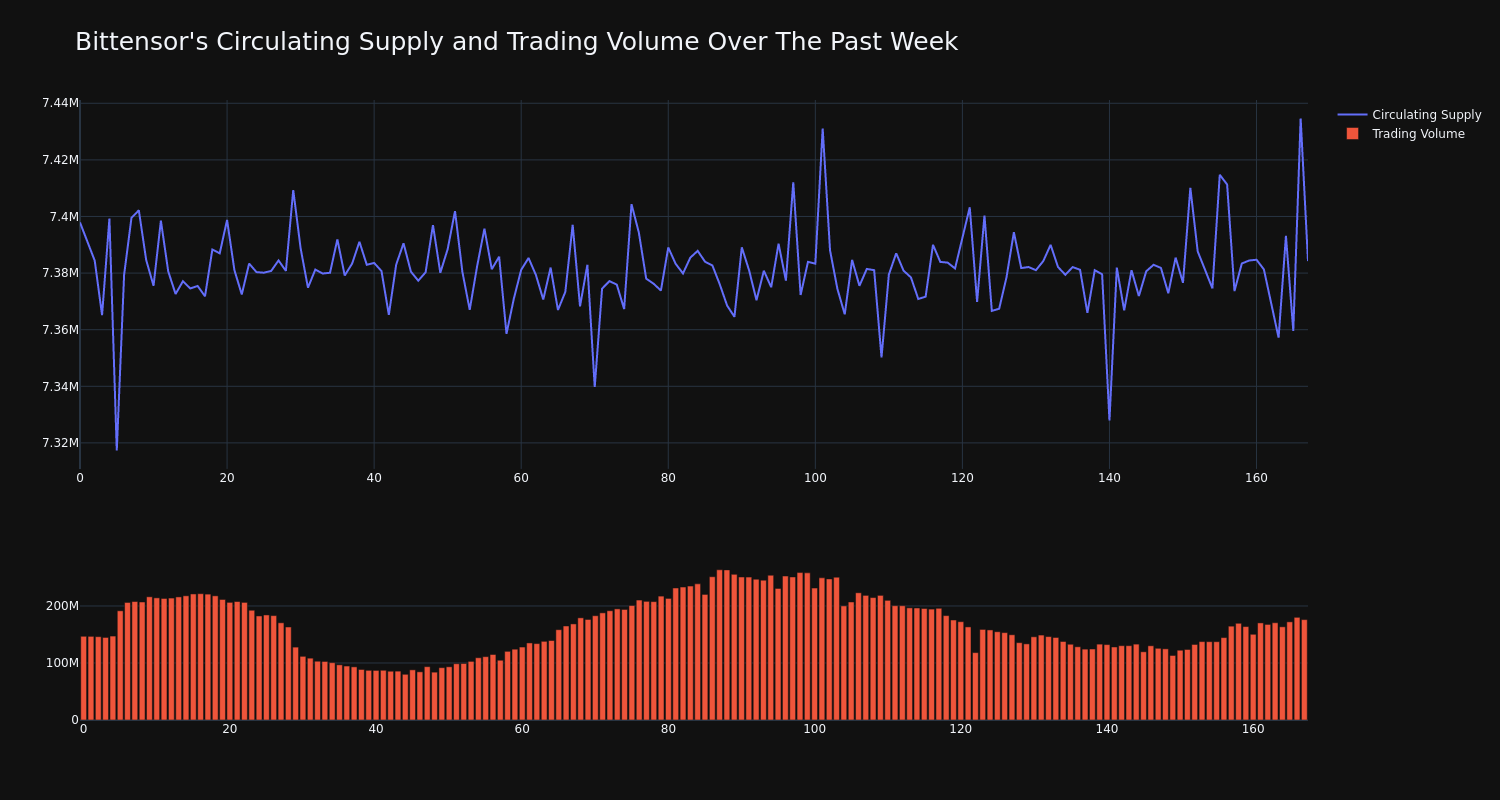
The trading volume for the coin has risen 20.0% over the past week diverging from the circulating supply of the coin, which has decreased 0.18%. This brings the circulating supply to 7.38 million, which makes up an estimated 35.15% of its max supply of 21.00 million. According to our data, the current market cap ranking for TAO is #31 at $3.41 billion.
This article was generated by Benzinga’s automated content engine and reviewed by an editor.
Market News and Data brought to you by Benzinga APIs
© 2024 Benzinga.com. Benzinga does not provide investment advice. All rights reserved.
Liberty Northwest Bancorp, Inc. Reports Third Quarter 2024 Earnings
2024 Third Quarter Financial Highlights:
- Total assets were $183.7 million at quarter end.
- Net interest income of $1.01 million for the third quarter.
- Net interest margin of 2.37% for the third quarter.
- Total deposits increased 2% to $146.4 million at September 30, 2024, compared to $143.1 million a year ago.
- Net loans increased 1% to $140.0 million at September 30, 2024, compared to $139.2 million a year ago.
- Asset quality remains pristine.
- Non-interest bearing demand deposits represent 27% of total deposits.
- Tangible book value per share was $7.67 at quarter end.
POULSBO, Wash., Nov. 01, 2024 (GLOBE NEWSWIRE) — Liberty Northwest Bancorp, Inc. LBNW (the “Company”) and its wholly-owned subsidiary Liberty Bank today announced net income of $25 thousand for the third quarter ended September 30, 2024, compared to $7 thousand for the second quarter ended June 30, 2024, and $6 thousand for the third quarter ended September 30, 2023. In the first nine months of 2024, net income increased 41% to $47 thousand, compared to $33 thousand the same period in 2023.
Total assets were $183.7 million as of September 30, 2024, compared to $188.3 million at September 30, 2023. Net loans totaled $140.0 million as of September 30, 2024, a 2% decrease compared to $143.2 million at June 30, 2024, and a 1% increase compared to $139.2 million a year ago. Loan demand was muted during the quarter largely due to the high interest rate environment.
Asset quality remained pristine during the quarter. The allowance for credit losses totaled $1.17 million as of September 30, 2024, and was 0.83% of total loans outstanding. The Company recorded net loan charge-offs of $4 thousand during the quarter. The Company has one non-performing loan of $235 thousand as of September 30, 2024.
Due to strong credit quality metrics and muted loan growth, the Company recorded a $95 thousand reversal to its provision for credit losses in the third quarter of 2024. This compared to a $90 thousand reversal to its provision for credit losses in the second quarter of 2024 and a $25 thousand reversal to its provision for credit losses in the third quarter of 2023.
Total deposits increased 2% to $146.4 million at September 30, 2024, compared to $143.1 million at September 30, 2023, and increased modestly compared to $145.8 million three months earlier. Non-interest bearing demand accounts represented 27%, interest bearing demand represented 28%, money market and savings accounts comprised 19%, and certificates of deposit made up 26% of the total deposit portfolio at September 30, 2024.
“We continue to take advantage of our strong local economy, with a growing deposit base and loan pipeline,” said Rick Darrow, Liberty Northwest Bancorp, Inc. President and Chief Executive Officer. “While the high-interest rate environment continues to be a challenge, we believe we are well positioned with a strong balance sheet and ample capital to continue to grow.”
Net interest income, before the provision for loan losses, was $1.01 million for the third quarter of 2024, compared to $1.14 million in the third quarter of 2023. The decrease in net interest income year-over-year was primarily due to the increase in interest expense on deposits and other borrowings resulting from the higher interest rate environment. For the first nine months of 2024, net interest income was $3.11 million, compared to $3.35 million for the first nine months of 2023.
“Higher yields on earning assets during the quarter were more than offset by the increase in cost of funds, resulting in net interest margin compression during the quarter,” said Darrow. The Company’s net interest margin was 2.37% for the third quarter of 2024, compared to 2.45% for the preceding quarter, and 2.64% for the third quarter of 2023. For the first nine months of 2024, the net interest margin was 2.40%, compared to 2.62% for the first nine months of 2023.
Total non-interest income was $74 thousand for the third quarter of 2024, compared to $111 thousand for the third quarter a year ago. The decrease compared to the year ago quarter was primarily due to higher referral fee income during the third quarter of 2023, compared to the third quarter of 2024. For the first nine months of 2024, non-interest income was $226 thousand, compared to $371 thousand for the first nine months of 2023.
Total noninterest expense was $1.14 million for the third quarter of 2024, a decrease of $121 thousand, or 10%, from the third quarter a year ago. Compensation and benefits costs decreased by $69 thousand, or 9%, over the year ago quarter, while occupancy costs decreased by $57 thousand, or 40% from the same quarter a year ago. Year-to-date, total noninterest expense decreased $228 thousand, or 6%, to $3.50 million, over the same period in 2023.
“We have done a good job of managing operating expenses over the last several quarters, reducing total noninterest expense by 10% over the third quarter a year ago,” said Darrow. “Our operating performance is expected to continue to improve, as we improve our margin, and continue to keep operating expenses in check. We are well positioned for continued growth in our core business operations and remain focused on creating value for all of our customers, employees and shareholders.”
Capital ratios continue to exceed regulatory requirements, with a total risk-based capital ratio at 15.97% at quarter end, substantially above well-capitalized regulatory requirements. The tangible book value per share was $7.67 at quarter end, compared to $7.71 a year earlier.
Near the end of the second quarter of 2024, the Company completed the issuance of $1.2 million of Preferred Stock. Under the terms of the transaction, the Preferred Stock will convert to Common Stock within a 2 year time period.
“The proceeds from this offering will be used to further strengthen our capital position and to support continued loan growth in our vibrant Pacific Northwest markets,” said Darrow.
About Liberty Northwest Bancorp, Inc.
Liberty Northwest Bancorp, Inc. is the bank holding company for Liberty Bank, a commercial bank chartered in the State of Washington. The Bank began operations June 11, 2009, and operates a full-service branch in Poulsbo, WA. The Bank provides loan and deposit services to predominantly small and middle-sized businesses and individuals in and around Kitsap and King counties. The Bank is subject to regulation by the State of Washington Department of Financial Institutions and the Federal Deposit Insurance Corporation (FDIC). For more information, please visit www.libertybanknw.com. Liberty Northwest Bancorp, Inc. LBNW, qualified to trade on the OTCQX® Best Market in June 2022. For information related to the trading of LBNW, please visit www.otcmarkets.com.
Forward-Looking Statement Safe Harbor: This news release contains comments or information that constitutes forward-looking statements (within the meaning of the Private Securities Litigation Reform Act of 1995) that are based on current expectations that involve a number of risks and uncertainties. Forward-looking statements describe Liberty Northwest Bancorp, Inc.’s projections, estimates, plans and expectations of future results and can be identified by words such as “believe,” “intend,” “estimate,” “likely,” “anticipate,” “expect,” “looking forward,” and other similar expressions. They are not guarantees of future performance. Actual results may differ materially from the results expressed in these forward-looking statements, which because of their forward-looking nature, are difficult to predict. Investors should not place undue reliance on any forward-looking statement, and should consider factors that might cause differences including but not limited to the degree of competition by traditional and nontraditional competitors, declines in real estate markets, an increase in unemployment or sustained high levels of unemployment; changes in interest rates; greater than expected costs to integrate acquisitions, adverse changes in local, national and international economies; changes in the Federal Reserve’s actions that affect monetary and fiscal policies; changes in legislative or regulatory actions or reform, including without limitation, the Dodd-Frank Wall Street Reform and Consumer Protection Act; demand for products and services; changes to the quality of the loan portfolio and our ability to succeed in our problem-asset resolution efforts; the impact of technological advances; changes in tax laws; and other risk factors. Liberty Northwest Bancorp, Inc. undertakes no obligation to publicly update or clarify any forward-looking statement to reflect the impact of events or circumstances that may arise after the date of this release.
| STATEMENTS OF INCOME (Unaudited) | |||||||||||||||||||||||||||||||
| (Dollars in thousands) | |||||||||||||||||||||||||||||||
| Quarter Ended Sept 30, 2024 |
Quarter Ended June 30, 2024 |
Three Month Change |
Quarter Ended Sept 30, 2023 |
One Year Change |
Year to Date Sept 30, 2024 |
Year to Date Sept 30, 2023 |
One Year Change |
||||||||||||||||||||||||
| Interest Income | |||||||||||||||||||||||||||||||
| Loans | $ | 1,994 | $ | 1,920 | 4 | % | $ | 1,814 | 10 | % | $ | 5,875 | $ | 5,283 | 11 | % | |||||||||||||||
| Interest bearing deposits in banks | 83 | 61 | 38 | % | 99 | -16 | % | 223 | 222 | 0 | % | ||||||||||||||||||||
| Securities | 114 | 119 | -4 | % | 119 | -4 | % | 352 | 343 | 3 | % | ||||||||||||||||||||
| Total interest income | 2,192 | 2,100 | 4 | % | 2,032 | 8 | % | 6,451 | 5,848 | 10 | % | ||||||||||||||||||||
| Interest Expense | |||||||||||||||||||||||||||||||
| Deposits | 903 | 785 | 15 | % | 544 | 66 | % | 2,370 | 1,484 | 60 | % | ||||||||||||||||||||
| Other Borrowings | 283 | 261 | 9 | % | 352 | -20 | % | 975 | 1,012 | -4 | % | ||||||||||||||||||||
| Total interest expense | 1,186 | 1,046 | 13 | % | 896 | 32 | % | 3,345 | 2,497 | 34 | % | ||||||||||||||||||||
| Net Interest Income | 1,005 | 1,053 | -5 | % | 1,136 | -11 | % | 3,106 | 3,352 | -7 | % | ||||||||||||||||||||
| Provision for Loan Losses | (95 | ) | (90 | ) | 6 | % | (25 | ) | 280 | % | (225 | ) | (45 | ) | 400 | % | |||||||||||||||
| Net interest income after provision for loan losses | 1,100 | 1,143 | -4 | % | 1,161 | -5 | % | 3,331 | 3,397 | -2 | % | ||||||||||||||||||||
| Non-Interest Income | |||||||||||||||||||||||||||||||
| Service charges on deposit accounts | 28 | 28 | -3 | % | 17 | 60 | % | 77 | 50 | 53 | % | ||||||||||||||||||||
| Other non-interest income | 46 | 51 | -9 | % | 94 | -51 | % | 149 | 321 | -54 | % | ||||||||||||||||||||
| Total non-interest income | 74 | 79 | -7 | % | 111 | -34 | % | 226 | 371 | -39 | % | ||||||||||||||||||||
| Non-Interest Expense | |||||||||||||||||||||||||||||||
| Salaries and employee benefits | 668 | 673 | -1 | % | 737 | -9 | % | 1,946 | 2,149 | -9 | % | ||||||||||||||||||||
| Occupancy and equipment expenses | 88 | 96 | -9 | % | 145 | -40 | % | 329 | 444 | -26 | % | ||||||||||||||||||||
| Other operating expenses | 387 | 445 | -13 | % | 382 | 1 | % | 1,223 | 1,133 | 8 | % | ||||||||||||||||||||
| Total non-interest expenses | 1,143 | 1,214 | -6 | % | 1,264 | -10 | % | 3,498 | 3,726 | -6 | % | ||||||||||||||||||||
| Net Income Before Income Tax | 31 | 9 | 268 | % | 8 | 311 | % | 59 | 42 | 41 | % | ||||||||||||||||||||
| Provision for Income Tax | 7 | 2 | 268 | % | 2 | 311 | % | 12 | 9 | 41 | % | ||||||||||||||||||||
| Net Income | $ | 25 | $ | 7 | 268 | % | $ | 6 | 311 | % | $ | 47 | $ | 33 | 41 | % | |||||||||||||||
| BALANCE SHEETS (Unaudited) | ||||||||||||||||||||
| (Dollars in thousands) | ||||||||||||||||||||
| Sept 30, 2024 |
June 30, 2024 |
Three Month Change |
Sept 30, 2023 |
One Year Change |
||||||||||||||||
| Assets | ||||||||||||||||||||
| Cash and due from Banks | $ | 2,408 | $ | 2,124 | 13 | % | $ | 3,359 | -28 | % | ||||||||||
| Interest bearing deposits in banks | 11,262 | 14,625 | -23 | % | 11,635 | -3 | % | |||||||||||||
| Securities | 21,225 | 21,664 | -2 | % | 24,316 | -13 | % | |||||||||||||
| Loans | 141,206 | 144,477 | -2 | % | 140,467 | 1 | % | |||||||||||||
| Allowance for loan losses | (1,167 | ) | (1,266 | ) | -8 | % | (1,227 | ) | -5 | % | ||||||||||
| Net Loans | 140,038 | 143,210 | -2 | % | 139,240 | 1 | % | |||||||||||||
| Premises and fixed assets | 6,161 | 6,219 | -1 | % | 6,512 | -5 | % | |||||||||||||
| Accrued Interest receivable | 668 | 678 | -2 | % | 678 | -2 | % | |||||||||||||
| Intangible assets | 19 | 26 | -27 | % | 46 | -58 | % | |||||||||||||
| Other assets | 1,897 | 2,262 | -16 | % | 2,534 | -25 | % | |||||||||||||
| Total Assets | $ | 183,678 | $ | 190,808 | -4 | % | $ | 188,320 | -2 | % | ||||||||||
| Liabilities and Shareholders’ Equity | ||||||||||||||||||||
| Deposits | ||||||||||||||||||||
| Demand, non-interest bearing | $ | 39,669 | $ | 44,092 | -10 | % | $ | 43,702 | -9 | % | ||||||||||
| Interest Bearing Demand | 40,764 | 40,171 | 1 | % | 30,865 | 32 | % | |||||||||||||
| Money Market and Savings | 27,419 | 24,534 | 12 | % | 27,207 | 1 | % | |||||||||||||
| Certificates of Deposit | 38,507 | 36,989 | 4 | % | 41,317 | -7 | % | |||||||||||||
| Total Deposits | 146,359 | 145,786 | 0 | % | 143,091 | 2 | % | |||||||||||||
| Total Borrowing | 22,454 | 30,446 | -26 | % | 31,923 | -30 | % | |||||||||||||
| Accrued interest payable | 238 | 244 | -2 | % | 303 | -21 | % | |||||||||||||
| Other liabilities | 704 | 212 | 233 | % | 316 | 123 | % | |||||||||||||
| Total Liabilities | 169,756 | 176,687 | -4 | % | 175,633 | -3 | % | |||||||||||||
| Shareholders’ Equity | ||||||||||||||||||||
| Preferred Stock | 1,242 | 1,242 | 0 | % | *** | |||||||||||||||
| Common Stock | 1,650 | 1,650 | 0 | % | 1,644 | 0 | % | |||||||||||||
| Additional paid in capital | 13,138 | 13,147 | -0 | % | 13,095 | 0 | % | |||||||||||||
| Retained Earnings | (1,447 | ) | (1,471 | ) | 2 | % | (1,495 | ) | 3 | % | ||||||||||
| Other Comprehensive Income | (661 | ) | (447 | ) | -48 | % | (557 | ) | -19 | % | ||||||||||
| Total Shareholders’ Equity | 13,922 | 14,121 | -1 | % | 12,687 | 10 | % | |||||||||||||
| Total Liabilities and Shareholders’ Equity | $ | 183,678 | $ | 190,808 | -4 | % | $ | 188,320 | -2 | % | ||||||||||
| Quarter Ended Sept 30, 2024 |
Quarter Ended June 30, 2024 |
Quarter Ended Sept 30, 2023 |
YTD 2024 | YTD 2023 | ||||||||||||||||
| Financial Ratios | ||||||||||||||||||||
| Return on Average Assets | 0.06 | % | 0.01 | % | 0.01 | % | 0.03 | % | 0.02 | % | ||||||||||
| Return on Average Equity | 0.70 | % | 0.21 | % | 0.19 | % | 0.47 | % | 0.35 | % | ||||||||||
| Efficiency Ratio | 105.9 | % | 107.2 | % | 101.4 | % | 105.0 | % | 99.7 | % | ||||||||||
| Net Interest Margin | 2.37 | % | 2.45 | % | 2.64 | % | 2.40 | % | 2.62 | % | ||||||||||
| Loan to Deposits | 96.5 | % | 99.1 | % | 97.3 | % | ||||||||||||||
| Tangible Book Value per Share | $ | 7.67 | $ | 7.79 | $ | 7.71 | ||||||||||||||
| Book Value per Share | $ | 7.68 | $ | 7.80 | $ | 7.74 | ||||||||||||||
| Earnings per Share | $ | 0.01 | $ | 0.00 | $ | 0.00 | $ | 0.03 | $ | 0.02 | ||||||||||
| Asset Quality | ||||||||||||||||||||
| Net Loan Charge-offs (recoveries) | $ | 4 | $ | (228 | ) | $ | – | |||||||||||||
| Nonperforming Loans | $ | 235 | $ | 235 | $ | – | ||||||||||||||
| Nonperforming Assets to Total Assets | 0.13 | % | 0.12 | % | 0.00 | % | ||||||||||||||
| Allowance for Loan Losses to Total Loans | 0.83 | % | 0.88 | % | 0.87 | % | ||||||||||||||
| Other Real Estate Owned | – | – | – | |||||||||||||||||
| CAPITAL (Bank only) | ||||||||||||||||||||
| Tier 1 leverage ratio | 10.23 | % | 9.86 | % | 9.63 | % | ||||||||||||||
| Tier 1 risk-based capital ratio | 15.00 | % | 14.24 | % | 14.46 | % | ||||||||||||||
| Total risk based capital ratio | 15.97 | % | 15.26 | % | 15.48 | % | ||||||||||||||

For further discussion, please contact:
Rick Darrow, Chief Executive Officer | 360-394-4750
© 2024 Benzinga.com. Benzinga does not provide investment advice. All rights reserved.
Cryptocurrency Optimism Down More Than 3% Within 24 hours
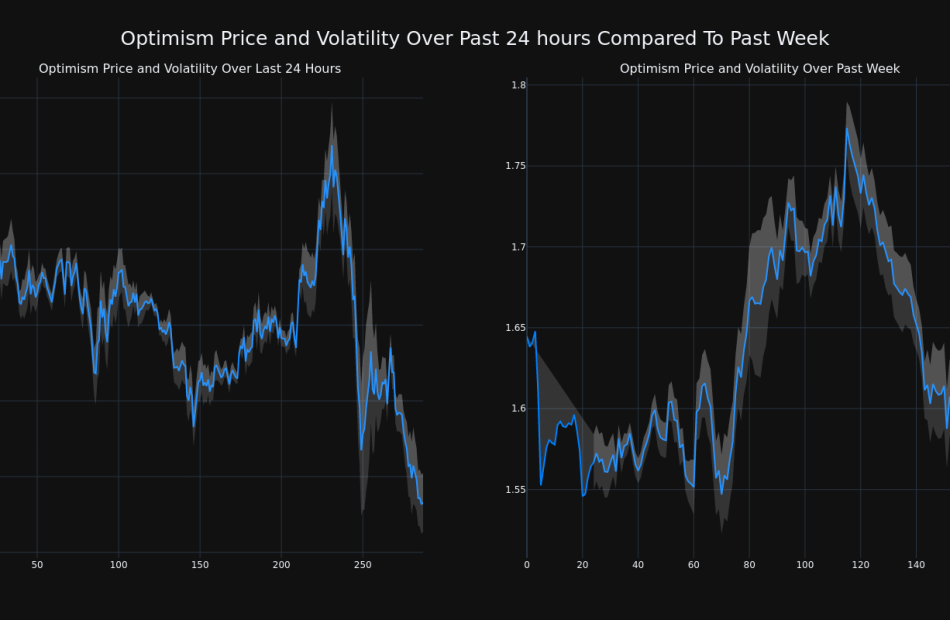
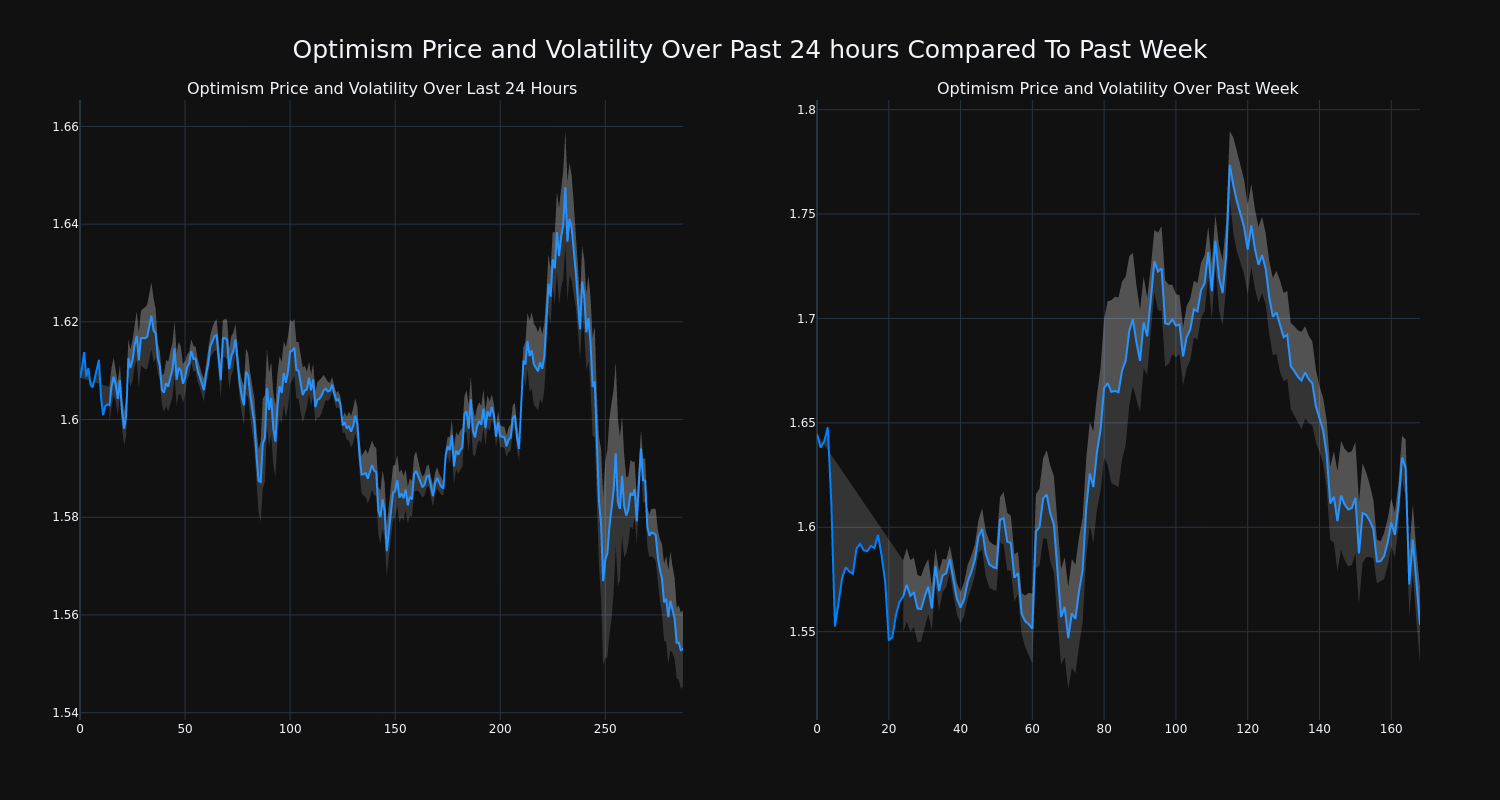
Over the past 24 hours, Optimism’s OP/USD price has fallen 3.44% to $1.55. This continues its negative trend over the past week where it has experienced a 6.0% loss, moving from $1.64 to its current price.
The chart below compares the price movement and volatility for Optimism over the past 24 hours (left) to its price movement over the past week (right). The gray bands are Bollinger Bands, measuring the volatility for both the daily and weekly price movements. The wider the bands are, or the larger the gray area is at any given moment, the larger the volatility.
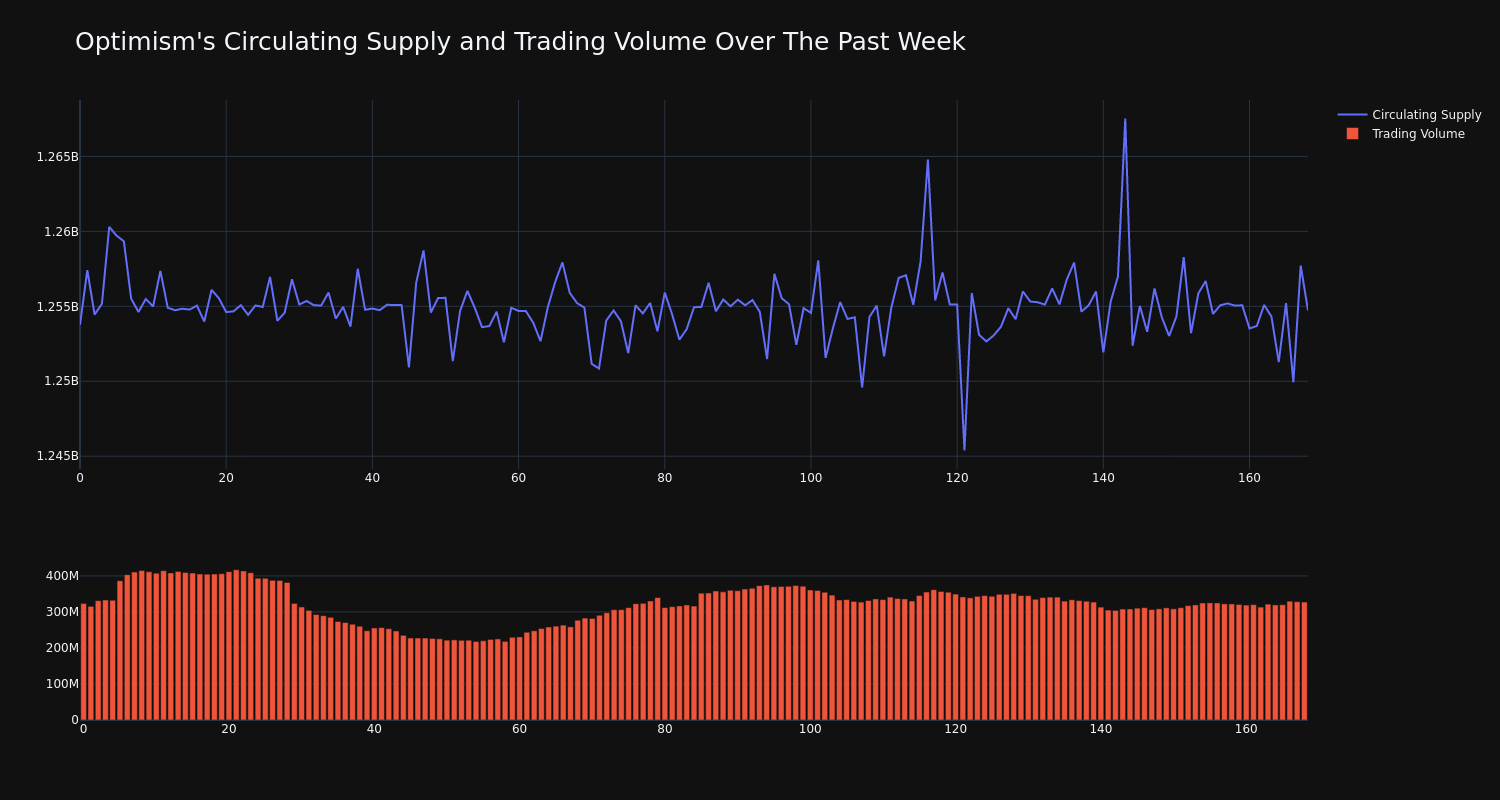
Optimism’s trading volume has climbed 1.0% over the past week along with the circulating supply of the coin, which has increased 0.08%. This brings the circulating supply to 1.26 billion, which makes up an estimated 29.22% of its max supply of 4.29 billion. According to our data, the current market cap ranking for OP is #49 at $1.95 billion.
This article was generated by Benzinga’s automated content engine and reviewed by an editor.
Market News and Data brought to you by Benzinga APIs
© 2024 Benzinga.com. Benzinga does not provide investment advice. All rights reserved.
Service Corp International Analysts Boost Their Forecasts After Upbeat Earnings
Service Corp International SCI reported better-than-expected third-quarter adjusted EPS results on Thursday.
Service Corp Intl reported quarterly earnings of 79 cents per share beat the analyst consensus estimate of 77 cents per shsare. The company reported quarterly sales of $1.014 billion which missed the analyst consensus estimate of $1.016 billion.
Tom Ryan, the Company’s Chairman and CEO, commented, “Today we reported adjusted earnings per share of $0.79 and net cash provided by operating activities excluding special items of $269 million. We are excited to see the positive impact in funeral revenue from our new marketing agreement with our new preferred preneed insurance provider, which launched during the quarter. Additionally, we are pleased both funeral and cemetery gross profit were relatively stable versus the prior year third quarter with modest revenue growth reflecting our continued focus on managing fixed costs.”
Service Corp Intl said it sees fourth-quarter adjusted loss of $1.00-1.10 per share, versus estimates of 77 cents per share.
Service Corp International shares gained 0.2% to trade at $81.79 on Friday.
These analysts made changes to their price targets on Service Corp International following earnings announcement.
- Raymond James analyst John Ransom maintained Service Corp Intl with an Outperform and increased the price target from $80 to $85.
- Truist Securities analyst Tobey Sommer maintained the stock with a Buy and raised the price target from $84 to $92.
Read More:
Market News and Data brought to you by Benzinga APIs
© 2024 Benzinga.com. Benzinga does not provide investment advice. All rights reserved.
Cryptocurrency Mantle Decreases More Than 3% Within 24 hours
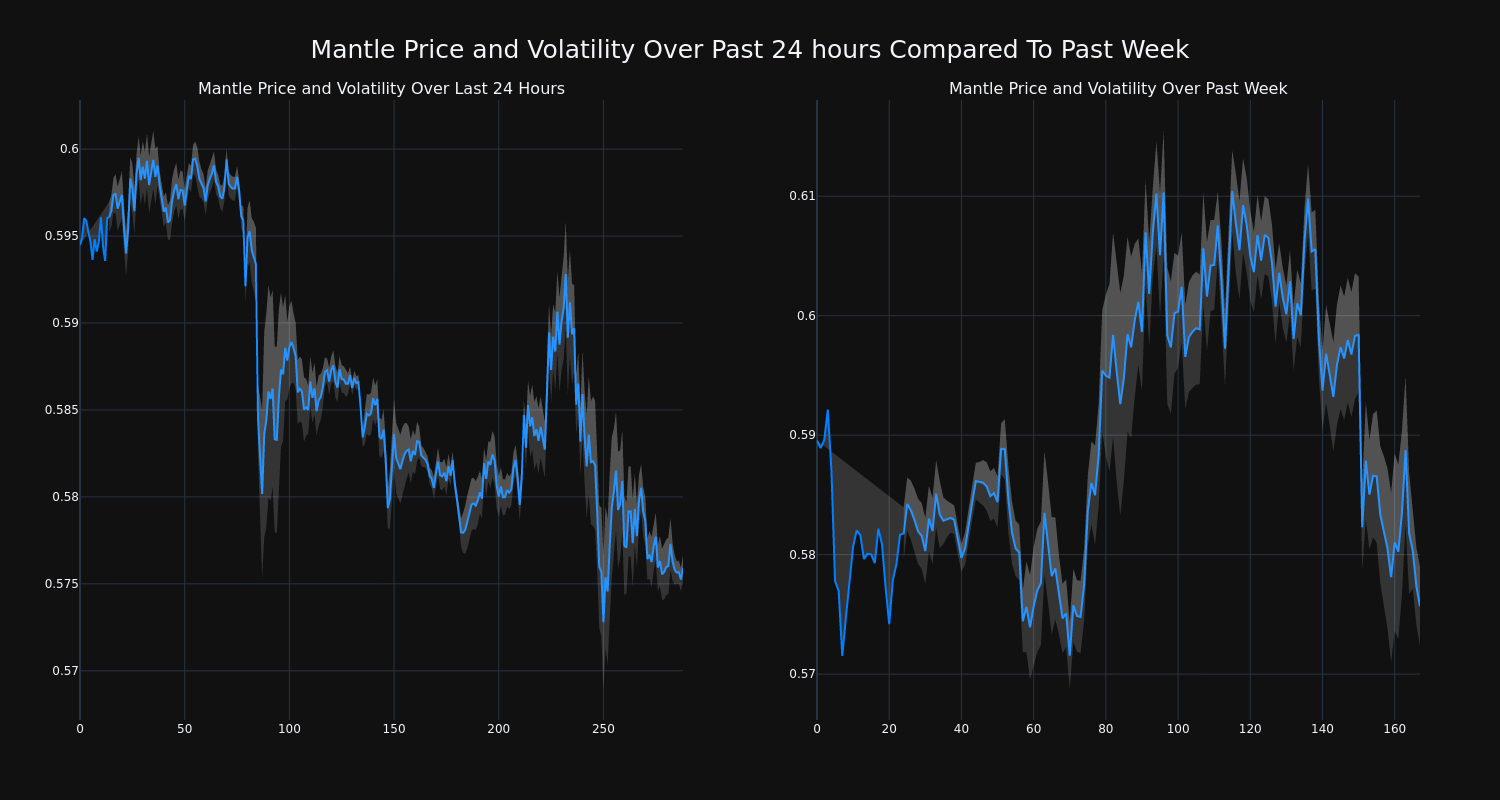
Mantle’s MNT/USD price has decreased 3.12% over the past 24 hours to $0.58, continuing its downward trend over the past week of -2.0%, moving from $0.59 to its current price.
The chart below compares the price movement and volatility for Mantle over the past 24 hours (left) to its price movement over the past week (right). The gray bands are Bollinger Bands, measuring the volatility for both the daily and weekly price movements. The wider the bands are, or the larger the gray area is at any given moment, the larger the volatility.
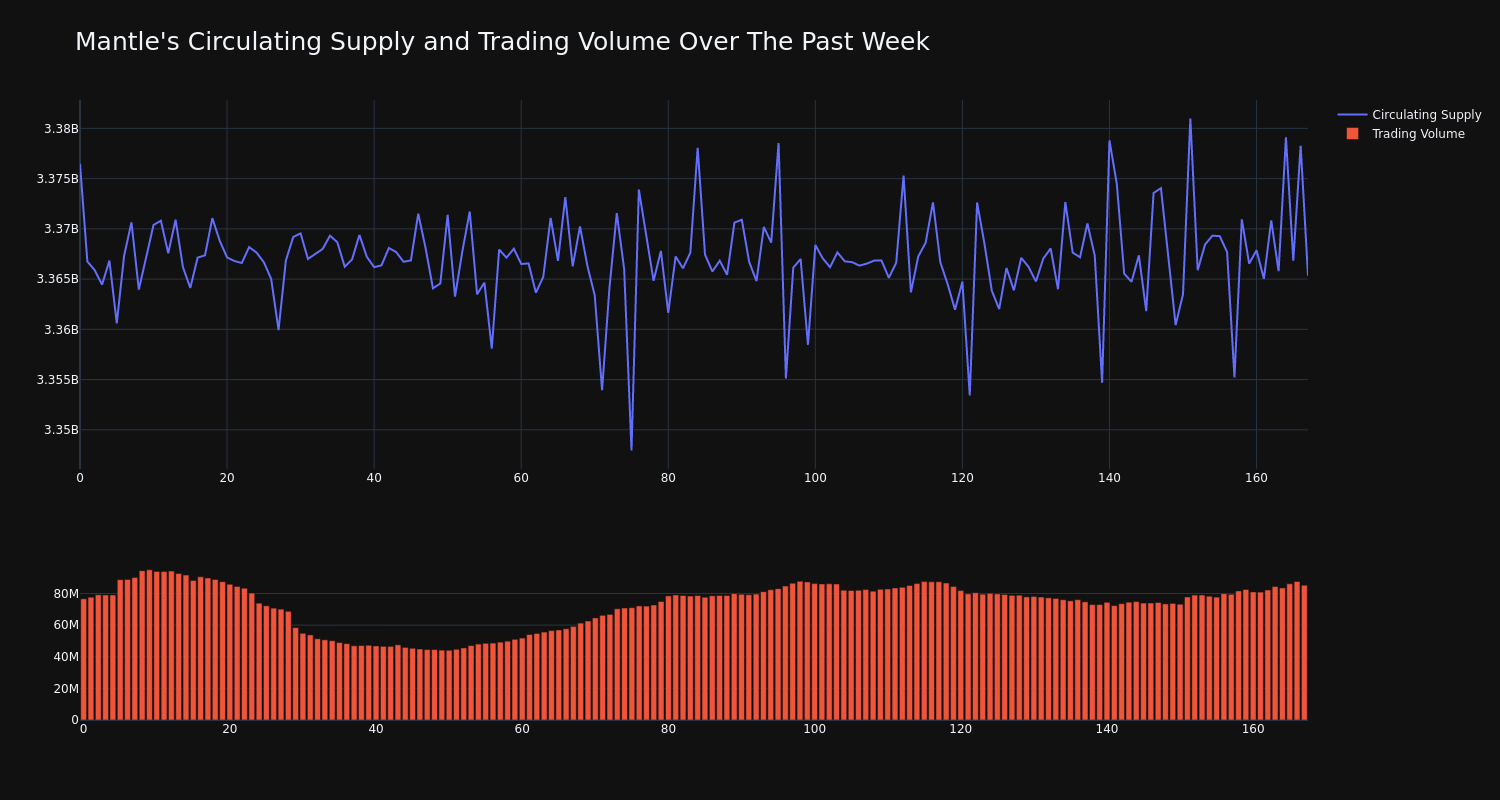
The trading volume for the coin has increased 11.0% over the past week. while the overall circulating supply of the coin has decreased 0.33% This puts its current circulating supply at an estimated 54.14% of its max supply, which is 6.22 billion. The current market cap ranking for MNT is #50 at $1.94 billion.
This article was generated by Benzinga’s automated content engine and reviewed by an editor.
Market News and Data brought to you by Benzinga APIs
© 2024 Benzinga.com. Benzinga does not provide investment advice. All rights reserved.
These Analysts Revise Their Forecasts On Generac After Q4 Results
Generac Holdings Inc. GNRC reported better-than-expected earnings for its fourth quarter on Thursday.
The company posted quarterly earnings of $2.25 per share which beat the analyst consensus estimate of $1.95 per share. The company reported quarterly sales of $1.173 billion which beat the analyst consensus estimate of $1.161 billion.
“Our third quarter results outperformed our expectations as elevated power outage activity drove increased shipments of our residential products and strong execution helped to deliver significant margin expansion,” said Aaron Jagdfeld, President and Chief Executive Officer. “Shipments of home standby and portable generators increased at a very strong rate from the prior year period, more than offsetting expected softness in C&I product sales. As a result, we are updating our full year 2024 guidance to include higher residential product sales with further improvements in adjusted EBITDA margins.”
Generac shares gained 2.4% to trade at $169.47 on Friday.
These analysts made changes to their price targets on Generac following earnings announcement.
- Baird analyst Michael Halloran maintained Generac with a Neutral and lowered the price target from $187 to $181.
- Goldman Sachs analyst Jerry Revich maintained the stock with a Buy and raised the price target from $148 to $193.
- TD Cowen analyst Jeffrey Osborne maintained Generac with a Buy and raised the price target from $172 to $183.
Read More:
Market News and Data brought to you by Benzinga APIs
© 2024 Benzinga.com. Benzinga does not provide investment advice. All rights reserved.
Calamos Investments Closed-End Funds (NASDAQ: CHI, CHY, CSQ, CGO, CHW, CCD and CPZ) Announce Monthly Distributions and Required Notifications of Sources of Distribution
METRO CHICAGO, Ill., Nov. 1, 2024 /PRNewswire/ — Calamos Investments®* has announced monthly distributions and sources of distributions paid in November 2024 to shareholders of its seven closed-end funds (the Funds) pursuant to the Funds’ respective distribution plans.
|
Fund |
Distribution |
Payable |
Record |
Ex-dividend |
|
date |
date |
date |
||
|
CHI (inception 06/26/2002) |
||||
|
Calamos Convertible Opportunities and Income Fund |
$0.0950 |
11/20/24 |
11/13/24 |
11/13/24 |
|
CHY (inception 05/28/2003) |
||||
|
Calamos Convertible and High Income |
$0.1000 |
11/20/24 |
11/13/24 |
11/13/24 |
|
Fund |
||||
|
CSQ (inception 03/26/2004) |
||||
|
Calamos Strategic Total Return Fund |
$0.1025 |
11/20/24 |
11/13/24 |
11/13/24 |
|
CGO (inception 10/27/2005) |
||||
|
Calamos Global Total Return Fund |
$0.0800 |
11/20/24 |
11/13/24 |
11/13/24 |
|
CHW (inception 06/27/2007) |
||||
|
Calamos Global Dynamic Income Fund |
$0.0500 |
11/20/24 |
11/13/24 |
11/13/24 |
|
CCD (inception 03/27/2015) |
||||
|
Calamos Dynamic Convertible and |
$0.1950 |
11/20/24 |
11/13/24 |
11/13/24 |
|
Income Fund |
||||
|
CPZ (inception 11/29/2019) |
||||
|
Calamos Long/Short Equity & Dynamic Income Trust |
$0.1400 |
11/20/24 |
11/13/24 |
11/13/24 |
The following table provides estimates of Calamos Global Total Return Fund’s and Calamos Global Dynamic Income Fund’s distribution sources, reflecting YTD cumulative experience. The Funds attribute these estimates equally to each regular distribution throughout the year.
|
Distribution Components for November 2024’s Payable Date |
CGO |
CHW |
|
Ordinary Income |
$0.0000 |
$0.0000 |
|
Short-Term Capital Gains |
$0.0800 |
$0.0500 |
|
Long-Term Capital Gains |
$0.0000 |
$0.0000 |
|
Return of Capital |
$0.0000 |
$0.0000 |
|
Total Distribution (Level Rate) |
$0.0800 |
$0.0500 |
|
2025 Fiscal YTD Data |
CGO |
CHW |
|
Ordinary Income |
$0.0000 |
$0.0000 |
|
Short-Term Capital Gains |
$0.0800 |
$0.0500 |
|
Long-Term Capital Gains |
$0.0000 |
$0.0000 |
|
Return of Capital |
$0.0000 |
$0.0000 |
|
Total Fiscal YTD Distribution (Level Rate) |
$0.0800 |
$0.0500 |
Regarding Calamos’ remaining five closed-end funds, which operate under a managed distribution policy: The information below is required by an exemptive order granted to the Funds by the US Securities and Exchange Commission and includes the information sent to shareholders regarding the sources of the Funds’ distributions.
The following table sets forth the estimated amount of the sources of distribution for purposes of Section 19 of the Investment Company Act of 1940, as amended, and the related rules adopted thereunder. The Funds estimate the following percentages, of their respective total distribution amount per common share, attributable to (i) current and prior fiscal year net investment income, (ii) net realized short-term capital gain, (iii) net realized longterm capital gain and (iv) return of capital or other capital source as a percentage of the total distribution amount. These percentages are disclosed for the current distribution as well as the fiscal YTD cumulative distribution amount per common share for the Funds. The following table provides estimates of each Fund’s distribution sources, reflecting YTD cumulative experience. The Funds attribute these estimates equally to each regular distribution throughout the year.
|
Estimated Per Share Sources of Distribution |
Estimated Percentage of Distribution |
|||||||||||
|
Per Share |
Net |
Short-Term |
Long-Term |
Return of |
Net |
Short-Term |
Long-Term |
Return of |
||||
|
Fund |
Distribution |
Income |
Gains |
Gains |
Capital |
Income |
Gains |
Gains |
Capital |
|||
|
CHI |
Current Month |
0.0950 |
– |
0.0950 |
– |
– |
0.0 % |
100.0 % |
0.0 % |
0.0 % |
||
|
Fiscal YTD |
0.0950 |
– |
0.0950 |
– |
– |
0.0 % |
100.0 % |
0.0 % |
0.0 % |
|||
|
Net Asset Value |
10.04 |
|||||||||||
|
CHY |
Current Month |
0.1000 |
– |
0.1000 |
– |
– |
0.0 % |
100.0 % |
0.0 % |
0.0 % |
||
|
Fiscal YTD |
0.1000 |
– |
0.1000 |
– |
– |
0.0 % |
100.0 % |
0.0 % |
0.0 % |
|||
|
Net Asset Value |
10.63 |
|||||||||||
|
CSQ |
Current Month |
0.1025 |
– |
0.1025 |
– |
– |
0.0 % |
100.0 % |
0.0 % |
0.0 % |
||
|
Fiscal YTD |
0.1025 |
– |
0.1025 |
– |
– |
0.0 % |
100.0 % |
0.0 % |
0.0 % |
|||
|
Net Asset Value |
17.55 |
|||||||||||
|
CCD |
Current Month |
0.1950 |
– |
0.1950 |
– |
– |
0.0 % |
100.0 % |
0.0 % |
0.0 % |
||
|
Fiscal YTD |
0.1950 |
– |
0.1950 |
– |
– |
0.0 % |
100.0 % |
0.0 % |
0.0 % |
|||
|
Net Asset Value |
19.23 |
|||||||||||
|
CPZ |
Current Month |
0.1400 |
0.0918 |
0.0482 |
– |
– |
65.6 % |
34.4 % |
0.0 % |
0.0 % |
||
|
Fiscal YTD |
0.1400 |
0.0918 |
0.0482 |
– |
– |
65.6 % |
34.4 % |
0.0 % |
0.0 % |
|||
|
Net Asset Value |
17.53 |
|||||||||||
|
Note: NAV returns are as of October 31, 2024 and Distribution Returns include the distribution announced today. |
||||||||||||
You should not draw any conclusions about the Fund’s investment performance from the amount of this distribution or from the terms of the Fund’s plan.
If the Fund(s) estimate(s) that it has distributed more than its income and capital gains, a portion of your distribution may be a return of capital. A return of capital may occur, for example, when some or all of the money that you invested in the Fund is paid back to you. A return of capital distribution does not necessarily reflect the Fund’s investment performance and should not be confused with ‘yield’ or ‘income’.
The amounts and sources of distributions reported in this 19(a) notice are only estimates and are not being provided for tax reporting purposes. The actual amounts and sources of the amounts for accounting and tax purposes will depend upon the Fund’s investment experience during the remainder of its fiscal year and may be subject to changes based on tax regulations. The Fund will send you a Form 1099 DIV for the calendar year that will tell you how to report these distributions for federal income tax purposes.
Return figures provided below are based on the change in the Fund’s Net Asset Value per share (“NAV”), compared to the annualized distribution rate for this current distribution as a percentage of the NAV on the last day of the month prior to distribution record date.
|
Annualized |
|||||
|
Fund |
5-Year |
Fiscal YTD |
Fiscal YTD |
Fiscal YTD |
|
|
NAV Return (1) |
NAV Dist Rate |
NAV Return |
NAV Dist Rate |
||
|
CHI |
8.75 % |
11.35 % |
24.26 % |
0.95 % |
|
|
CHY |
9.00 % |
11.29 % |
24.82 % |
0.94 % |
|
|
CSQ |
15.21 % |
7.01 % |
41.22 % |
0.58 % |
|
|
CCD |
9.64 % |
12.17 % |
24.63 % |
1.01 % |
|
|
CPZ |
6.81 % |
9.58 % |
18.31 % |
0.80 % |
|
|
(1) Since inception for CPZ |
|||||
|
Note: NAV returns are as of October 31, 2024, and Distribution Returns include the distribution announced today. |
|||||
While the NAV performance may be indicative of the Fund’s investment performance, it does not measure the value of a shareholder’s investment in the Fund. The value of a shareholder’s investment in the Fund is determined by the Fund’s market price, which is based on the supply and demand for the Fund’s shares in the open market. Past performance does not guarantee future results.
Monthly distributions offer shareholders the opportunity to accumulate more shares in a fund via the automatic dividend reinvestment plan. For example, if a fund’s shares are trading at a premium, distributions will be automatically reinvested through the plan at NAV or 95% of the market price, whichever is greater; if shares are trading at a discount, distributions will be reinvested at the market price through an open market purchase program. Thus, the plan offers current shareholders an efficient method of accumulating additional shares with a potential for cost savings. Please see the dividend reinvestment plan for more information.
Important Notes about Performance and Risk
Past performance is no guarantee of future results. As with other investments, market price will fluctuate with the market and upon sale, your shares may have a market price that is above or below net asset value and may be worth more or less than your original investment. Returns at NAV reflect the deduction of the Fund’s management fee, debt leverage costs and other expenses. You can purchase or sell common shares daily. Like any other stock, market price will fluctuate with the market. Upon sale, your shares may have a market price that is above or below net asset value and may be worth more or less than your original investment. Shares of closed-end funds frequently trade at a discount which is a market price that is below their net asset value.
About Calamos
Calamos Investments is a diversified global investment firm offering innovative investment strategies including alternatives, multi-asset, convertible, fixed income, equity, and sustainable equity. The firm offers strategies through separately managed portfolios, mutual funds, closed-end funds, private funds, an interval fund, ETFs, and UCITS funds. Clients include major corporations, pension funds, endowments, foundations and individuals, as well as the financial advisors and consultants who serve them. Headquartered in the Chicago metropolitan area, the firm also has offices in New York City, San Francisco, Milwaukee, Portland (Oregon), and the Miami area. For more information, please visit us on LinkedIn, on Twitter @Calamos, Instagram @calamos_investments, or at www.calamos.com.
*Calamos Investments LLC, referred to herein as Calamos Investments®, is a financial services company offering such services through its subsidiaries: Calamos Advisors LLC, Calamos Wealth Management LLC, Calamos Investments LLP and Calamos Financial Services LLC.
SOURCE Calamos Investments
© 2024 Benzinga.com. Benzinga does not provide investment advice. All rights reserved.
Vinesign Launches Powerful Public API, Empowering Businesses to Seamlessly Integrate E-Signature Solutions into Their Workflow
Salt Lake City, UT, Nov. 01, 2024 (GLOBE NEWSWIRE) — Vinesign by Filevine, a leader in electronic signature technology, today announced the launch of its new Public API designed to enhance business efficiency and productivity by allowing seamless integration of its e-signature solutions into existing digital ecosystems. With this innovative API, businesses can now effortlessly connect Vinesign with their Customer Relationship Management (CRM) systems and other tools via web automations, facilitating the automated sending of documents or templates for signature.
The introduction of Vinesign’s Public API marks a significant advancement in how businesses manage and execute digital transactions. By providing businesses with the ability to integrate directly with their current systems, Vinesign is enabling a more streamlined and efficient signing process, eliminating the need for manual uploads and ensuring faster turnaround times.
“At Vinesign, we understand the critical importance of seamless integration in ensuring the smooth operation of day-to-day business activities,” said Joshua Hostilo, Director of Product at Vinesign. “Our new Public API offers businesses the flexibility to tailor our e-signature solutions to their specific needs, paving the way for enhanced productivity, secure document management, and an improved customer experience.”
Key features of Vinesign’s new Public API include:
- Seamless Integration: Easily connect Vinesign with existing CRMs and other business tools using Web Automations, allowing for instant document sending and tracking.
- Automated Workflows: Enable automatic initiation of document sending processes directly from your CRM, reducing the complexity and time involved in managing documents.
- Enhanced Security: Maintain high levels of security and compliance with Vinesign’s robust encryption and authentication protocols, ensuring that all digital transactions are protected.
- Boosted Productivity: Save time and reduce errors by eliminating the need for manual handling of documents, thereby improving the overall efficiency of business operations.
The Vinesign Public API is now available for businesses seeking to optimize their document management processes and enhance client interactions through more efficient digital communication. For more information about how Vinesign’s Public API can benefit your business, please visit www.vinesign.com.
About Vinesign
Vinesign is a frontrunner in the field of electronic signature technology, dedicated to providing businesses with reliable, secure, and user-friendly e-signature solutions. Vinesign continues to innovate and enhance its offerings to meet the evolving needs of businesses across industries, supporting seamless integration and compliance with industry standards.

Erin Ash
Filevine
2624421056
erinash@filevine.com
Market News and Data brought to you by Benzinga APIs
© 2024 Benzinga.com. Benzinga does not provide investment advice. All rights reserved.

