Check Out What Whales Are Doing With THC
Deep-pocketed investors have adopted a bearish approach towards Tenet Healthcare THC, and it’s something market players shouldn’t ignore. Our tracking of public options records at Benzinga unveiled this significant move today. The identity of these investors remains unknown, but such a substantial move in THC usually suggests something big is about to happen.
We gleaned this information from our observations today when Benzinga’s options scanner highlighted 11 extraordinary options activities for Tenet Healthcare. This level of activity is out of the ordinary.
The general mood among these heavyweight investors is divided, with 36% leaning bullish and 54% bearish. Among these notable options, 2 are puts, totaling $50,501, and 9 are calls, amounting to $2,559,675.
What’s The Price Target?
Based on the trading activity, it appears that the significant investors are aiming for a price territory stretching from $80.0 to $170.0 for Tenet Healthcare over the recent three months.
Volume & Open Interest Trends
Looking at the volume and open interest is an insightful way to conduct due diligence on a stock.
This data can help you track the liquidity and interest for Tenet Healthcare’s options for a given strike price.
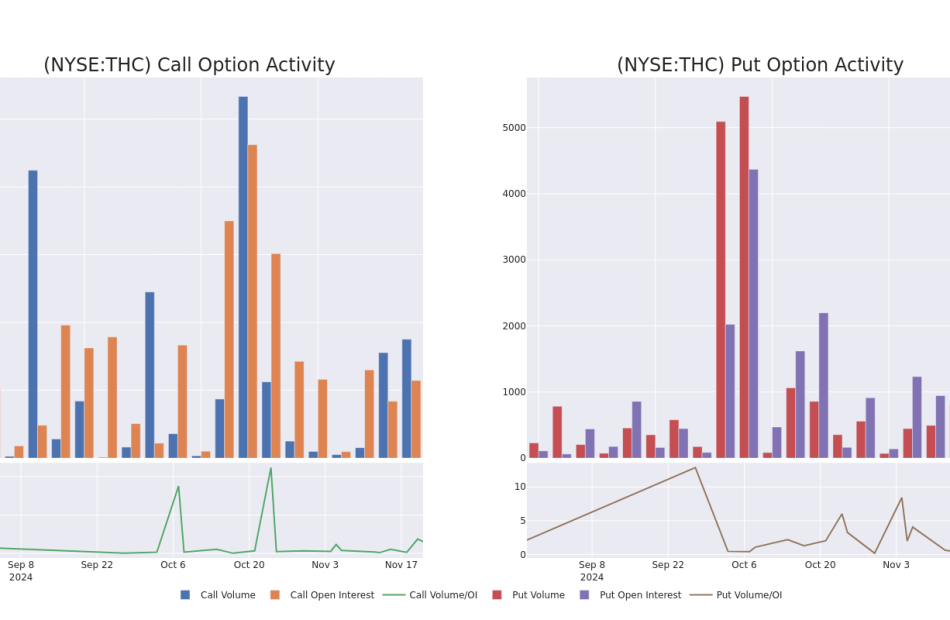
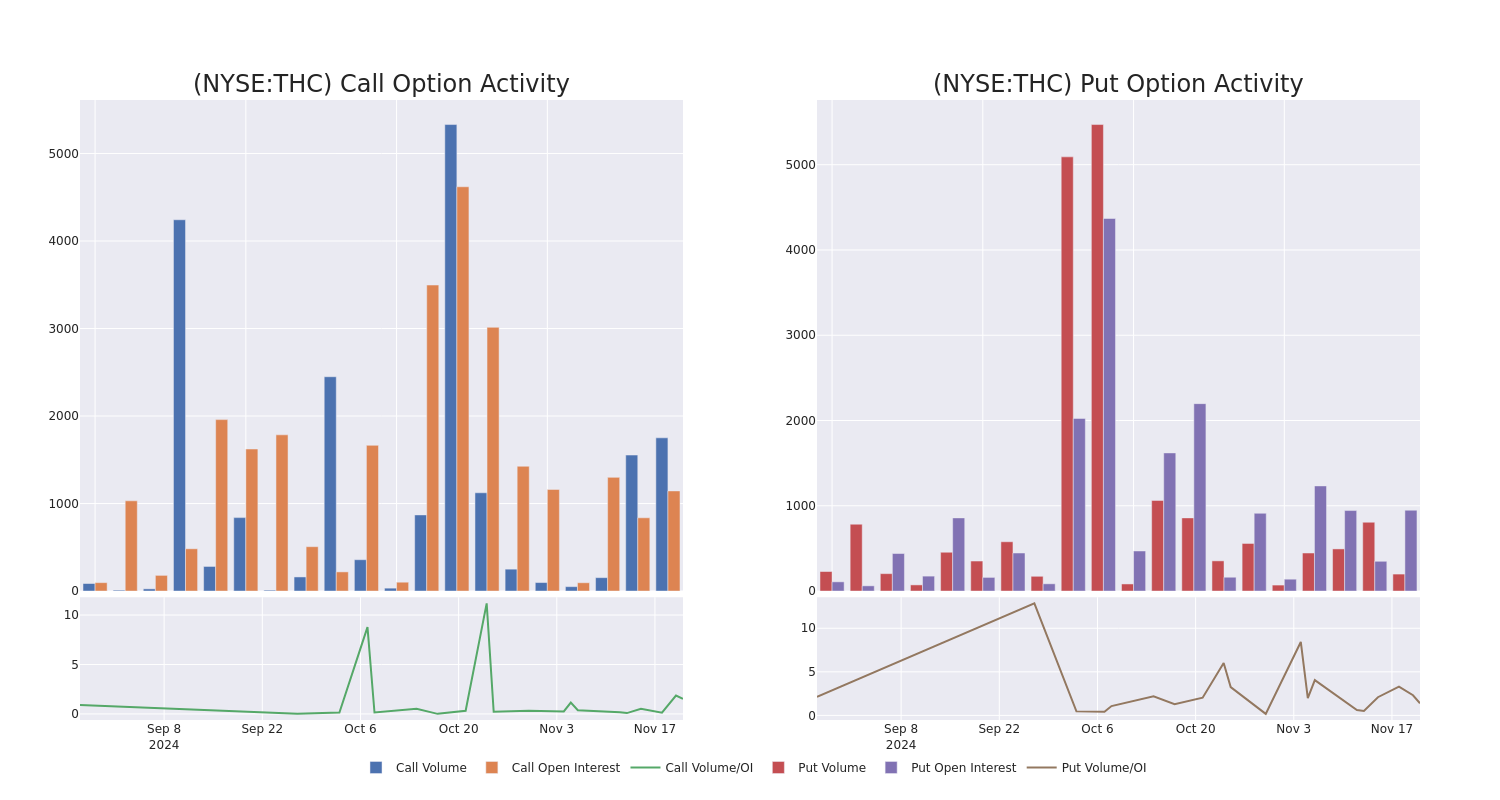
Below, we can observe the evolution of the volume and open interest of calls and puts, respectively, for all of Tenet Healthcare’s whale activity within a strike price range from $80.0 to $170.0 in the last 30 days.
Tenet Healthcare Option Activity Analysis: Last 30 Days
Noteworthy Options Activity:
| Symbol | PUT/CALL | Trade Type | Sentiment | Exp. Date | Ask | Bid | Price | Strike Price | Total Trade Price | Open Interest | Volume |
|---|---|---|---|---|---|---|---|---|---|---|---|
| THC | CALL | SWEEP | BULLISH | 06/20/25 | $68.0 | $68.0 | $68.0 | $80.00 | $550.8K | 8 | 270 |
| THC | CALL | SWEEP | BEARISH | 06/20/25 | $68.1 | $68.0 | $68.0 | $80.00 | $530.4K | 8 | 288 |
| THC | CALL | SWEEP | BULLISH | 06/20/25 | $67.1 | $67.1 | $67.1 | $80.00 | $503.2K | 8 | 96 |
| THC | CALL | SWEEP | BULLISH | 06/20/25 | $67.7 | $67.6 | $67.6 | $80.00 | $471.1K | 8 | 186 |
| THC | CALL | SWEEP | BEARISH | 06/20/25 | $68.1 | $68.0 | $68.0 | $80.00 | $122.4K | 8 | 487 |
About Tenet Healthcare
Tenet Healthcare is a Dallas-based healthcare services organization. It operates a collection of hospitals (about 50 as of July 2024) and over 500 ambulatory surgery centers and other outpatient facilities across the U.S., primarily in the South. Through its Conifer segment, Tenet also provides revenue cycle management solutions.
Following our analysis of the options activities associated with Tenet Healthcare, we pivot to a closer look at the company’s own performance.
Present Market Standing of Tenet Healthcare
- Currently trading with a volume of 1,180,448, the THC’s price is down by -2.04%, now at $148.74.
- RSI readings suggest the stock is currently is currently neutral between overbought and oversold.
- Anticipated earnings release is in 77 days.
What The Experts Say On Tenet Healthcare
A total of 5 professional analysts have given their take on this stock in the last 30 days, setting an average price target of $197.0.
Unusual Options Activity Detected: Smart Money on the Move
Benzinga Edge’s Unusual Options board spots potential market movers before they happen. See what positions big money is taking on your favorite stocks. Click here for access.
* An analyst from Barclays persists with their Overweight rating on Tenet Healthcare, maintaining a target price of $190.
* An analyst from Wells Fargo has decided to maintain their Overweight rating on Tenet Healthcare, which currently sits at a price target of $205.
* An analyst from Goldman Sachs has decided to maintain their Buy rating on Tenet Healthcare, which currently sits at a price target of $196.
* Maintaining their stance, an analyst from UBS continues to hold a Buy rating for Tenet Healthcare, targeting a price of $217.
* An analyst from Cantor Fitzgerald has decided to maintain their Overweight rating on Tenet Healthcare, which currently sits at a price target of $177.
Trading options involves greater risks but also offers the potential for higher profits. Savvy traders mitigate these risks through ongoing education, strategic trade adjustments, utilizing various indicators, and staying attuned to market dynamics. Keep up with the latest options trades for Tenet Healthcare with Benzinga Pro for real-time alerts.
Market News and Data brought to you by Benzinga APIs
© 2024 Benzinga.com. Benzinga does not provide investment advice. All rights reserved.
Bitcoin, Ethereum, Dogecoin Prepping For An Early Thanksgiving: 'BTC Is Currently (Less Than) One ETH Away From $100,000,' Says Trader
Cryptocurrency markets are trading higher, with Bitcoin approaching $100,000, Solana ETF talks picking up steam and XRP gaining on Gary Gensler announcing his resignation on Donald Trump‘s inauguration day.
| Cryptocurrency | Price | Gains +/- |
| Bitcoin BTC/USD | $97,986 | +3.1% |
| Ethereum ETH/USD | $3,348 | +8.7% |
| Solana SOL/USD | $253.64 | +7.1% |
| Dogecoin DOGE/USD | $0.3841 | +1.9% |
| Shiba Inu SHIB/USD | $0.00002454 | +2.2% |
Notable Statistics:
- IntoTheBlock data shows large transaction volume increasing by 8.5% and daily active addresses up by 0.4%. Transactions greater than $100,000 are up from 11,911 to 13,321 in a single day. Exchanges netflows are down by 89%.
- Coinglass data reports 139,421 traders were liquidated in the past 24 hours for $469.70 million.
Notable Developments:
Top Gainers:
| Cryptocurrency | Price | Gains +/- |
| Optimism OP/USD | $2.10 | +26.3% |
| Arbitrum ARB/USD | $0.79 | +26.2% |
| Starknet STRK/USD | $0.5031 | +18.6% |
Trader Notes: With Bitcoin prices chasing the all-time high levels, crypto trader Kaleo tweeted “Bitcoin is currently one Ethereum away from $100,000.”
Benjamin Cowen explained Bitcoin is tracking the average returns of prior halving years and if this trend continues Bitcoin could reach $120,000.
Crypto trader Kevin explained that despite BTC nearing $100,000, there is minimal hype compared to the 2020-2021 bull run.
He highlights a lack of live streams, sensational thumbnails, and low engagement across platforms, along with muted sentiment on Google Trends.
He believes investors’ focus on altcoins and frustration with lack of movement could be one factor while market not reaching euphoric stage could signal still far away from cycle’s peak.
Read Next:
Image: Shutterstock
Market News and Data brought to you by Benzinga APIs
© 2024 Benzinga.com. Benzinga does not provide investment advice. All rights reserved.
SVP Of World Kinect Makes $70K Sale
Disclosed on November 20, JoseMiguel Tejada, SVP at World Kinect WKC, executed a substantial insider sell as per the latest SEC filing.
What Happened: Tejada’s recent move involves selling 2,500 shares of World Kinect. This information is documented in a Form 4 filing with the U.S. Securities and Exchange Commission on Wednesday. The total value is $70,188.
Monitoring the market, World Kinect‘s shares down by 0.0% at $28.02 during Thursday’s morning.
All You Need to Know About World Kinect
World Kinect Corp is a energy management company involved in providing supply fulfillment, energy procurement advisory services, and transaction and payment management solutions to commercial and industrial customers . It sells and delivers liquid fuels, natural gas, electricity, renewable energy, and other sustainability solutions. Company operate in three reportable segments consisting of aviation, land, and marine. Company earn majority of revenue from Aviation segment.
World Kinect: Delving into Financials
Negative Revenue Trend: Examining World Kinect’s financials over 3 months reveals challenges. As of 30 September, 2024, the company experienced a decline of approximately -14.33% in revenue growth, reflecting a decrease in top-line earnings. As compared to competitors, the company surpassed expectations with a growth rate higher than the average among peers in the Energy sector.
Navigating Financial Profits:
-
Gross Margin: The company issues a cost efficiency warning with a low gross margin of 2.56%, indicating potential difficulties in maintaining profitability compared to its peers.
-
Earnings per Share (EPS): The company excels with an EPS that surpasses the industry average. With a current EPS of 0.57, World Kinect showcases strong earnings per share.
Debt Management: With a below-average debt-to-equity ratio of 0.43, World Kinect adopts a prudent financial strategy, indicating a balanced approach to debt management.
Market Valuation:
-
Price to Earnings (P/E) Ratio: With a lower-than-average P/E ratio of 12.34, the stock indicates an attractive valuation, potentially presenting a buying opportunity.
-
Price to Sales (P/S) Ratio: The Price to Sales ratio is 0.04, which is lower than the industry average. This suggests a possible undervaluation based on sales performance.
-
EV/EBITDA Analysis (Enterprise Value to its Earnings Before Interest, Taxes, Depreciation & Amortization): With an EV/EBITDA ratio lower than industry benchmarks at 5.71, World Kinect presents an attractive value opportunity.
Market Capitalization Analysis: Falling below industry benchmarks, the company’s market capitalization reflects a reduced size compared to peers. This positioning may be influenced by factors such as growth expectations or operational capacity.
Now trade stocks online commission free with Charles Schwab, a trusted and complete investment firm.
Why Insider Transactions Are Important
In the complex landscape of investment decisions, investors should approach insider transactions as part of a comprehensive analysis, considering various elements.
In the context of legal matters, the term “insider” refers to any officer, director, or beneficial owner holding more than ten percent of a company’s equity securities, as outlined by Section 12 of the Securities Exchange Act of 1934. This includes executives in the c-suite and significant hedge funds. Such insiders are obligated to report their transactions through a Form 4 filing, which must be completed within two business days of the transaction.
Pointing towards optimism, a company insider’s new purchase signals their positive anticipation for the stock to rise.
Despite insider sells not always signaling a bearish sentiment, they can be driven by various factors.
Transaction Codes Worth Your Attention
Taking a closer look at transactions, investors often prioritize those unfolding in the open market, meticulously cataloged in Table I of the Form 4 filing. A P in Box 3 denotes a purchase, while S signifies a sale. Transaction code C denotes the conversion of an option, and transaction code A signifies a grant, award, or other acquisition of securities from the company.
Check Out The Full List Of World Kinect’s Insider Trades.
Insider Buying Alert: Profit from C-Suite Moves
Benzinga Edge reveals every insider trade in real-time. Don’t miss the next big stock move driven by insider confidence. Unlock this ultimate sentiment indicator now. Click here for access.
This article was generated by Benzinga’s automated content engine and reviewed by an editor.
Market News and Data brought to you by Benzinga APIs
© 2024 Benzinga.com. Benzinga does not provide investment advice. All rights reserved.
Futu Hldgs Unusual Options Activity
Deep-pocketed investors have adopted a bearish approach towards Futu Hldgs FUTU, and it’s something market players shouldn’t ignore. Our tracking of public options records at Benzinga unveiled this significant move today. The identity of these investors remains unknown, but such a substantial move in FUTU usually suggests something big is about to happen.
We gleaned this information from our observations today when Benzinga’s options scanner highlighted 11 extraordinary options activities for Futu Hldgs. This level of activity is out of the ordinary.
The general mood among these heavyweight investors is divided, with 27% leaning bullish and 63% bearish. Among these notable options, 7 are puts, totaling $521,498, and 4 are calls, amounting to $389,812.
What’s The Price Target?
Based on the trading activity, it appears that the significant investors are aiming for a price territory stretching from $80.0 to $120.0 for Futu Hldgs over the recent three months.
Volume & Open Interest Development
Looking at the volume and open interest is an insightful way to conduct due diligence on a stock.
This data can help you track the liquidity and interest for Futu Hldgs’s options for a given strike price.
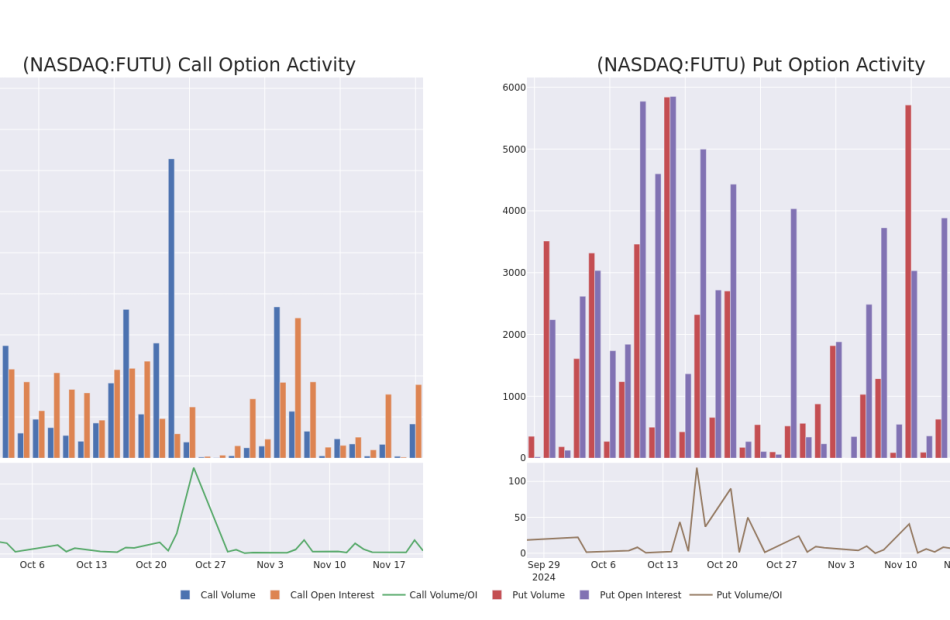
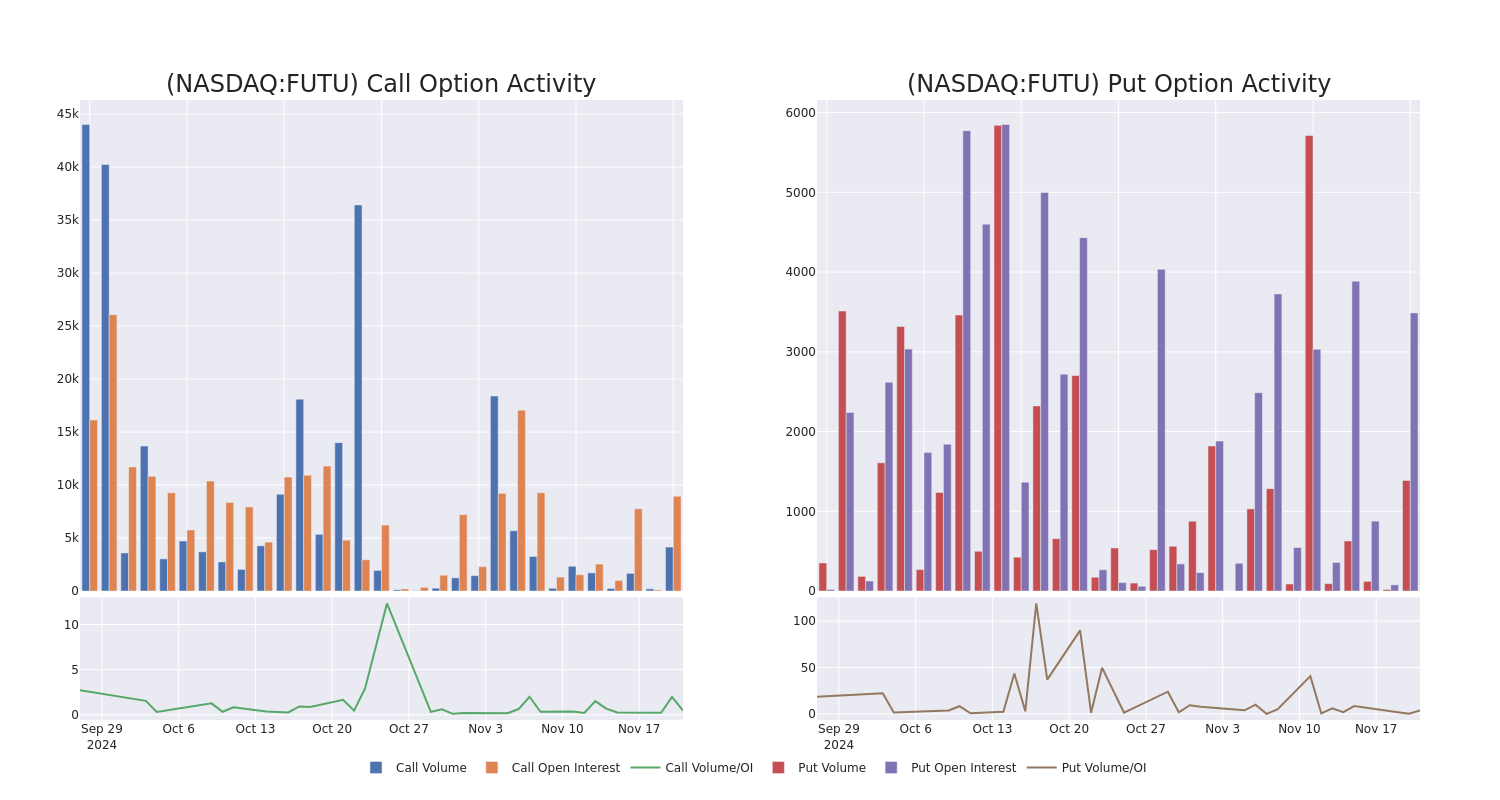
Below, we can observe the evolution of the volume and open interest of calls and puts, respectively, for all of Futu Hldgs’s whale activity within a strike price range from $80.0 to $120.0 in the last 30 days.
Futu Hldgs 30-Day Option Volume & Interest Snapshot
Significant Options Trades Detected:
| Symbol | PUT/CALL | Trade Type | Sentiment | Exp. Date | Ask | Bid | Price | Strike Price | Total Trade Price | Open Interest | Volume |
|---|---|---|---|---|---|---|---|---|---|---|---|
| FUTU | PUT | SWEEP | BEARISH | 11/22/24 | $10.7 | $9.8 | $10.75 | $95.00 | $199.9K | 1.7K | 388 |
| FUTU | CALL | TRADE | BULLISH | 12/20/24 | $0.98 | $0.94 | $0.98 | $105.00 | $166.9K | 3.0K | 2.1K |
| FUTU | CALL | SWEEP | BEARISH | 01/17/25 | $3.35 | $3.1 | $3.1 | $100.00 | $155.0K | 2.4K | 613 |
| FUTU | PUT | TRADE | BEARISH | 01/16/26 | $16.0 | $15.9 | $16.0 | $80.00 | $80.0K | 134 | 50 |
| FUTU | PUT | SWEEP | BEARISH | 11/22/24 | $10.7 | $9.8 | $10.7 | $95.00 | $77.0K | 1.7K | 460 |
About Futu Hldgs
Futu Holdings Ltd is an online broker providing one-stop online investing services. The company provides its services through its digital platform Futu NiuNiu, which includes market data, trading service, and news feed of Hong Kong, Mainland China, Singapore, and United States equity markets. It generates its revenue in the form of brokerage commission and handling charge services.
Present Market Standing of Futu Hldgs
- Currently trading with a volume of 2,164,151, the FUTU’s price is down by -1.99%, now at $87.22.
- RSI readings suggest the stock is currently is currently neutral between overbought and oversold.
- Anticipated earnings release is in 112 days.
What The Experts Say On Futu Hldgs
A total of 1 professional analysts have given their take on this stock in the last 30 days, setting an average price target of $95.0.
Turn $1000 into $1270 in just 20 days?
20-year pro options trader reveals his one-line chart technique that shows when to buy and sell. Copy his trades, which have had averaged a 27% profit every 20 days. Click here for access.
* Reflecting concerns, an analyst from Citigroup lowers its rating to Neutral with a new price target of $95.
Trading options involves greater risks but also offers the potential for higher profits. Savvy traders mitigate these risks through ongoing education, strategic trade adjustments, utilizing various indicators, and staying attuned to market dynamics. Keep up with the latest options trades for Futu Hldgs with Benzinga Pro for real-time alerts.
Market News and Data brought to you by Benzinga APIs
© 2024 Benzinga.com. Benzinga does not provide investment advice. All rights reserved.
November Small-Cap Surge Could Carry Into December's Santa Rally, Historical Trends Suggest
U.S. small-cap stocks are delivering a standout performance in November, aligning with a well-established seasonal trend that often paves the way for a strong December.
Historically, small caps tend to excel in the final two months of the year, with November’s impressive gains often rolling into December as part of the so-called “Santa Rally.”
The Russell 2000 index, the leading benchmark for small-cap equities, has climbed an impressive 8% this November, on track for the second-best monthly performance of the year.
See Also: Google, Anthropic Deal In Jeopardy As Regulators Look To Break Up Search Monopoly
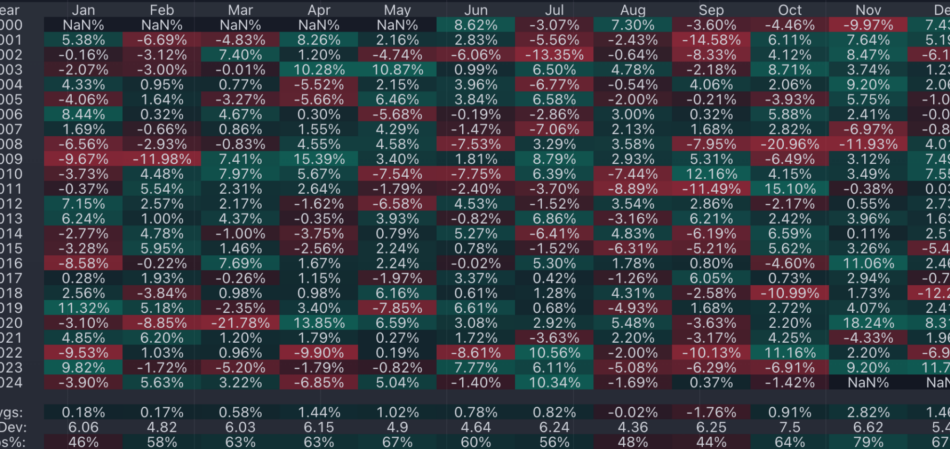
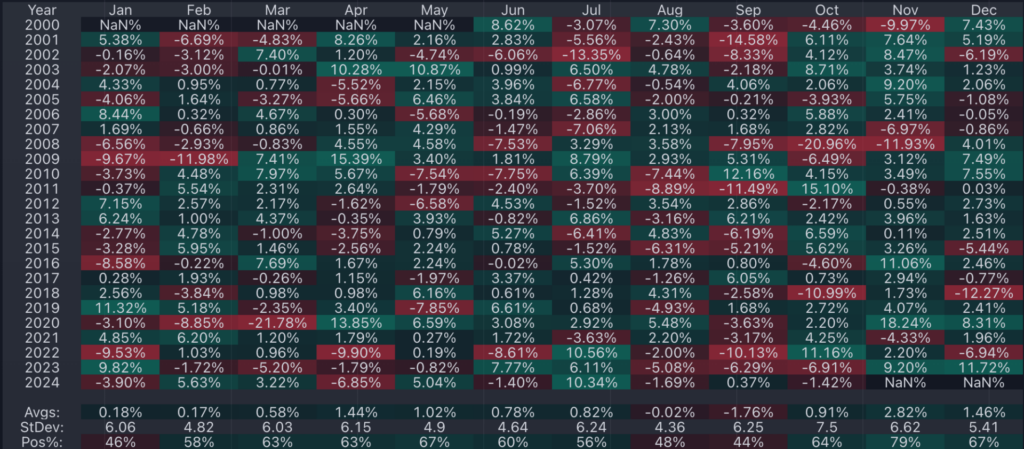
Data spanning more than two decades shows that November delivered the highest average returns for small-cap stocks.
From the year 2000 onward, the iShares Russell 2000 ETF IWM, has averaged a 2.6% gain in November, marking it as the strongest month of the year.
What’s even more striking is the reliability of this trend—79% of the time, the month ends with small-cap stocks in the green.
The Russell 2000 has ended November in negative territory only four times:
- A decline of 9.97% in 2000,
- 6.97% in 2007,
- 11.93% in 2008, and
- 4.33% in 2021.
In all other years, small-cap stocks have delivered gains during the month. The strongest rally occurred in November 2020, when the Russell soared 18.24% buoyed by the discovery of the Covid-19 vaccine.
Yet, history suggests this isn’t the time to cash out just yet. Investors tempted to take profits after November’s gains might reconsider, as December historically ranks as the second-best month for small caps.
On average, the Russell 2000 rose 1.46% in December, with 67% of years showing positive performance. The combination of these two months often gives small-cap investors a powerful year-end boost.
Russell 2000 Monthly Seasonality: November And December Show The Highest Average Gains
Why Are Small Caps Outperforming in November 2024?
As of late November, the Russell 2000’s 8% rally far surpasses the 4% rise of the S&P 500, tracked by the SPDR S&P 500 ETF Trust SPY. This outperformance is being driven by three major catalysts:
1. Federal Reserve Rate Cuts
The Federal Reserve has shifted into rate-cut mode, lowering rates by 25 basis points in November following a 50-basis-point reduction in September. Policymakers have signaled that further cuts are likely, albeit at a slower pace, as long as inflation continues to decelerate.
Lower interest rates disproportionately benefit small-cap companies, which rely more heavily on bank financing than their larger-cap counterparts. With borrowing costs falling, small businesses are better positioned to invest, grow, and improve profitability, giving them a significant tailwind compared to multinational firms.
2. Political Tailwinds From 2024 Elections
The outcome of the 2024 U.S. elections — a Republican trifecta (presidency, Senate and House of Representatives) — has fueled optimism among small-cap investors expecting the Trump administration to roll back regulations.
Additionally, the potential reintroduction of trade tariffs could act as a buffer for small-cap businesses by reducing competition from international firms facing higher regulatory or import costs. Financial services and industrial stocks, heavily represented in small-cap indices, have been among the top beneficiaries of this shift.
3. Economic Resilience
The U.S. economy is showing remarkable resilience by delivering strong GDP growth rates. The Atlanta Fed’s GDPNow estimate pegs fourth-quarter real GDP growth at 2.6%, following robust gains of 3.0% and 2.8% in the second and third quarters, respectively.
The labor market, a key indicator of economic health, also remains resilient. Despite disruptions from strikes and hurricanes affecting October payrolls data, jobless claims have fallen to their lowest levels in seven months in mid-November, indicating a tight labor market and sustained consumer confidence. These factors collectively underpin the performance of small-cap stocks, which are often more sensitive to domestic economic trends.
What’s Next For Small Caps?
With November’s gains already in the books, historical patterns suggest that small caps could keep their momentum into December. Whether fueled by seasonal trends, macroeconomic tailwinds, or political optimism, small-cap stocks are positioning themselves as a standout opportunity for year-end trading.
Now Read:
Image: Shutterstock
© 2024 Benzinga.com. Benzinga does not provide investment advice. All rights reserved.
Invesco Canada announces cash distributions for its ETFs
TORONTO, Nov. 21, 2024 /CNW/ — Invesco Canada Ltd. (“Invesco”) announced today the November 2024 distributions for its exchange-traded funds (ETFs). Unitholders of record on November 28, 2024, will receive cash distributions payable on December 6, 2024.
Details of the “per-unit” distribution amounts are as follows:
|
Invesco ETF name |
Ticker |
Distribution per |
Payment |
|
Asset allocation |
|||
|
Invesco Low Volatility Portfolio ETF |
PLV |
0.05351 |
Monthly |
|
Fixed income |
|||
|
Invesco 1-3 Year Laddered Floating Rate |
PFL |
0.07349 |
Monthly |
|
Invesco 1-5 Year Laddered Investment |
PSB |
0.04730 |
Monthly |
|
Invesco Fundamental High Yield |
PFH.F |
0.07631 |
Monthly |
|
Invesco Long Term Government Bond |
PGL |
0.05311 |
Monthly |
|
Invesco US Treasury Floating Rate Note |
IUFR.U |
0.07580 |
Monthly |
|
Invesco Canadian Core Plus Bond ETF – |
ICCB |
0.07236 |
Monthly |
|
Invesco Global Bond ETF – CAD |
ICGB |
0.07040 |
Monthly |
|
ESG fixed income |
|||
|
Invesco ESG Canadian Core Plus |
BESG |
0.05872 |
Monthly |
|
Invesco ESG Global Bond ETF – CAD |
IWBE |
0.05118 |
Monthly |
|
Equity income |
|||
|
Invesco Canadian Dividend Index ETF |
PDC |
0.12566 |
Monthly |
|
Invesco S&P/TSX Canadian Dividend |
ICAE |
0.06678 |
Monthly |
|
Invesco S&P US Dividend Aristocrats |
IUAE |
0.03240 |
Monthly |
|
Invesco S&P US Dividend Aristocrats |
IUAE.F |
0.03042 |
Monthly |
|
Invesco S&P International Developed |
IIAE |
0.05018 |
Monthly |
|
Invesco S&P International Developed |
IIAE.F |
0.04984 |
Monthly |
|
Low-volatility equity |
|||
|
Invesco S&P 500 Low Volatility Index |
ULV.C |
0.04734 |
Monthly |
|
Invesco S&P 500 Low Volatility Index |
ULV.F |
0.06646 |
Monthly |
|
Invesco S&P 500 Low Volatility Index |
ULV.U |
0.03381 |
Monthly |
|
Invesco S&P/TSX Composite Low |
TLV |
0.09596 |
Monthly |
|
Equal weight equity |
|||
|
Invesco S&P 500 Equal Weight Income |
EQLI |
0.16132 |
Monthly |
|
U.S. equity |
|||
|
Invesco NASDAQ 100 Income Advantage |
QQCI |
0.17972 |
Monthly |
† A ticker symbol ending with “.U” represents U.S.-dollar-denominated units. USD units of these ETFs are offered as a convenience for investors who wish to purchase with U.S. dollars and receive distributions and the proceeds of sale or redemption in U.S. dollars. The USD units are not hedged against changes in the exchange rate between the Canadian dollar and the U.S. dollar.
The tax composition of the Invesco ETFs’ distributions will be determined on an annual basis and will only be available after the Invesco ETFs’ tax year-end.
Commissions, management fees and expenses may all be associated with investments in ETFs. ETFs are not guaranteed, their values change frequently, and past performance may not be repeated. Please read the prospectus before investing. Copies are available from Invesco Canada Ltd. at invesco.com/ca.
There are risks involved with investing in ETFs. Please read the prospectus for a complete description of risks relevant to the ETF. Ordinary brokerage commissions apply to purchases and sales of ETF units.
“FTSE®, “Russell®“, “Russell 1000®“, and “FTSE Russell®” are trademarks of the relevant company of the London Stock Exchange Group plc and its group undertakings (the “LSE Group Companies”) and are used by a LSE Group Company under license. The FTSE RAFI® Index Series is calculated by FTSE in conjunction with Research Affiliates LLC (“RA”). RAFI®” and/or all other RA trademarks, trade names, patented and patent-pending concepts are the exclusive property of RA. None of the LSE Group Companies nor RA sponsor, endorse or promote Invesco ETFs and are not in any way connected to them and do not accept any liability in relation to their issue, operation and trading and makes no claim, prediction, warranty or representation either as to the results to be obtained from Invesco ETFs or the suitability of the indexes for the purposes to which they are being put by Invesco.
Morningstar® is a registered trademark of Morningstar Inc. (along with its affiliates, “Morningstar”) licensed for certain use by Invesco. The Invesco ETFs are not sponsored, endorsed, sold or promoted by Morningstar. Morningstar makes no representation or warranty, express or implied, to the owners of an Invesco ETF or any member of the public regarding the advisability of investing in securities generally or in an Invesco ETF.
Nasdaq-100® Equal Weighted Index, Nasdaq-100® ESG Index, Nasdaq-100 Index®, Nasdaq Next Generation 100 ESG IndexTM, Nasdaq Next Generation 100 ESG IndexTM and NASDAQ Select Canadian Dividend IndexTM are registered trademarks of Nasdaq, Inc. (which with its affiliates is referred to as the “Corporations”) and are licensed for use by Invesco. The Invesco ETFs have not been passed on by the Corporations as to their legality or suitability and are not issued, endorsed, sold, or promoted by the Corporations. THE CORPORATIONS MAKE NO WARRANTIES AND BEAR NO LIABILITY WITH RESPECT TO ANY INVESCO ETFs.
S&P®, S&P 500®, S&P Composite 1500® and Dividend Aristocrats® are registered trademarks of S&P Global or its affiliates (“S&P”); Dow Jones® is a registered trademark of Dow Jones Trademark Holdings LLC (“Dow Jones”); TSX is a trademark of TSX Inc. (“TSX”); and these trademarks have been licensed for use by of S&P Dow Jones Indices LLC or its affiliates (“SPDJI”) and sublicensed for certain purposes by Invesco. The Invesco ETFs are not sponsored, endorsed, sold or promoted by SPDJI, Dow Jones, S&P, TSX and their respective affiliates and none of such parties make any representation regarding the advisability of investing in such products nor do they have any liability for any errors, omissions, or interruptions of the Invesco ETFs’ indices.
For more information, please visit invesco.com/ca.
About Invesco Ltd.
Invesco Ltd. is a global independent investment management firm dedicated to delivering an investment experience that helps people get more out of life. Our distinctive investment teams deliver a comprehensive range of active, passive, and alternative investment capabilities. With offices in more than 20 countries, Invesco managed US$1.8 trillion in assets on behalf of clients worldwide as of Sept. 30, 2024. For more information, visit www.invesco.com.
Invesco® and all associated trademarks are trademarks of Invesco Holding Company Limited, used under licence.
© Invesco Canada Ltd., 2024
Contact: Samantha Brandifino, +1 332.323.5557, Samantha.Brandifino@invesco.com
SOURCE Invesco Ltd.

![]() View original content to download multimedia: http://www.newswire.ca/en/releases/archive/November2024/21/c0221.html
View original content to download multimedia: http://www.newswire.ca/en/releases/archive/November2024/21/c0221.html
© 2024 Benzinga.com. Benzinga does not provide investment advice. All rights reserved.
Eye On Growth: Gabrielle Sulzberger Adds $229K Of Eli Lilly Stock To Portfolio
On November 20, Gabrielle Sulzberger, Director at Eli Lilly LLY executed a significant insider buy, as disclosed in the latest SEC filing.
What Happened: In a significant move reported in a Form 4 filing with the U.S. Securities and Exchange Commission on Wednesday, Sulzberger purchased 315 shares of Eli Lilly, demonstrating confidence in the company’s growth potential. The total value of the transaction stands at $229,916.
Eli Lilly shares are trading down 1.56% at $741.66 at the time of this writing on Thursday morning.
Discovering Eli Lilly: A Closer Look
Eli Lilly is a drug firm with a focus on neuroscience, cardiometabolic, cancer, and immunology. Lilly’s key products include Verzenio for cancer; Mounjaro, Zepbound, Jardiance, Trulicity, Humalog, and Humulin for cardiometabolic; and Taltz and Olumiant for immunology.
Eli Lilly: Delving into Financials
Revenue Growth: Eli Lilly’s revenue growth over a period of 3 months has been noteworthy. As of 30 September, 2024, the company achieved a revenue growth rate of approximately 20.43%. This indicates a substantial increase in the company’s top-line earnings. As compared to competitors, the company surpassed expectations with a growth rate higher than the average among peers in the Health Care sector.
Insights into Profitability:
-
Gross Margin: The company sets a benchmark with a high gross margin of 81.02%, reflecting superior cost management and profitability compared to its peers.
-
Earnings per Share (EPS): Eli Lilly’s EPS is below the industry average. The company faced challenges with a current EPS of 1.08. This suggests a potential decline in earnings.
Debt Management: With a high debt-to-equity ratio of 2.19, Eli Lilly faces challenges in effectively managing its debt levels, indicating potential financial strain.
Valuation Overview:
-
Price to Earnings (P/E) Ratio: Eli Lilly’s stock is currently priced at a premium level, as reflected in the higher-than-average P/E ratio of 81.19.
-
Price to Sales (P/S) Ratio: With a relatively high Price to Sales ratio of 16.67 as compared to the industry average, the stock might be considered overvalued based on sales performance.
-
EV/EBITDA Analysis (Enterprise Value to its Earnings Before Interest, Taxes, Depreciation & Amortization): With an EV/EBITDA ratio of 59.36, the company’s market valuation exceeds industry averages.
Market Capitalization: Positioned above industry average, the company’s market capitalization underscores its superiority in size, indicative of a strong market presence.
Now trade stocks online commission free with Charles Schwab, a trusted and complete investment firm.
Exploring the Significance of Insider Trading
Emphasizing the importance of a comprehensive approach, considering insider transactions is valuable, but it’s crucial to evaluate them in conjunction with other investment factors.
From a legal standpoint, the term “insider” pertains to any officer, director, or beneficial owner holding more than ten percent of a company’s equity securities as outlined in Section 12 of the Securities Exchange Act of 1934. This encompasses executives in the c-suite and significant hedge funds. These insiders are mandated to inform the public of their transactions through a Form 4 filing, to be submitted within two business days of the transaction.
A company insider’s new purchase is a indicator of their positive anticipation for a rise in the stock.
While insider sells may not necessarily reflect a bearish view and can be motivated by various factors.
Cracking Transaction Codes
When analyzing transactions, investors tend to focus on those in the open market, detailed in Table I of the Form 4 filing. A P in Box 3 denotes a purchase,while S signifies a sale. Transaction code C signals the conversion of an option, and transaction code A denotes a grant, award, or other acquisition of securities from the company.
Check Out The Full List Of Eli Lilly’s Insider Trades.
Insider Buying Alert: Profit from C-Suite Moves
Benzinga Edge reveals every insider trade in real-time. Don’t miss the next big stock move driven by insider confidence. Unlock this ultimate sentiment indicator now. Click here for access.
This article was generated by Benzinga’s automated content engine and reviewed by an editor.
Market News and Data brought to you by Benzinga APIs
© 2024 Benzinga.com. Benzinga does not provide investment advice. All rights reserved.
Ross Stores Earnings Are Imminent; These Most Accurate Analysts Revise Forecasts Ahead Of Earnings Call
Ross Stores, Inc. ROST will release earnings results for its third quarter, after the closing bell on Thursday, Nov. 21.
Analysts expect the Dublin, California-based bank to report quarterly earnings at $1.4 per share, up from $1.33 per share in the year-ago period. Ross Stores projects to report revenue of $5.15 billion for the recent quarter, compared to $4.92 billion a year earlier, according to data from Benzinga Pro.
On Oct. 28, Ross Stores named James Conroy, a seasoned retail CEO, as Chief Executive Officer, succeeding Barbara Rentler effective Feb. 2, 2025.
Ross Stores shares rose 0.1% to close at $139.32 on Wednesday.
Benzinga readers can access the latest analyst ratings on the Analyst Stock Ratings page. Readers can sort by stock ticker, company name, analyst firm, rating change or other variables.
Let’s have a look at how Benzinga’s most-accurate analysts have rated the company in the recent period.
- TD Cowen analyst John Kernan maintained a Buy rating and cut the price target from $185 to $177 on Nov. 19. This analyst has an accuracy rate of 71%.
- Wells Fargo analyst Ike Boruchow maintained an Overweight rating and slashed the price target from $175 to $165 on Nov. 14. This analyst has an accuracy rate of 71%.
- Citigroup analyst Paul Lejuez downgraded the stock from Buy to Neutral and cut the price target from $179 to $152 on Nov. 12. This analyst has an accuracy rate of 62%.
- Morgan Stanley analyst Alex Straton maintained an Overweight rating and increased the price target from $163 to $178 on Aug. 23. This analyst has an accuracy rate of 64%.
- UBS analyst Jay Sole maintained a Neutral rating and boosted the price target from $147 to $167 on Aug. 23. This analyst has an accuracy rate of 73%.
Considering buying ROST stock? Here’s what analysts think:
Read This Next:
Market News and Data brought to you by Benzinga APIs
© 2024 Benzinga.com. Benzinga does not provide investment advice. All rights reserved.
Behind the Scenes of Walt Disney's Latest Options Trends
Deep-pocketed investors have adopted a bullish approach towards Walt Disney DIS, and it’s something market players shouldn’t ignore. Our tracking of public options records at Benzinga unveiled this significant move today. The identity of these investors remains unknown, but such a substantial move in DIS usually suggests something big is about to happen.
We gleaned this information from our observations today when Benzinga’s options scanner highlighted 15 extraordinary options activities for Walt Disney. This level of activity is out of the ordinary.
The general mood among these heavyweight investors is divided, with 60% leaning bullish and 20% bearish. Among these notable options, 6 are puts, totaling $240,736, and 9 are calls, amounting to $439,043.
Projected Price Targets
Analyzing the Volume and Open Interest in these contracts, it seems that the big players have been eyeing a price window from $95.0 to $125.0 for Walt Disney during the past quarter.
Volume & Open Interest Development
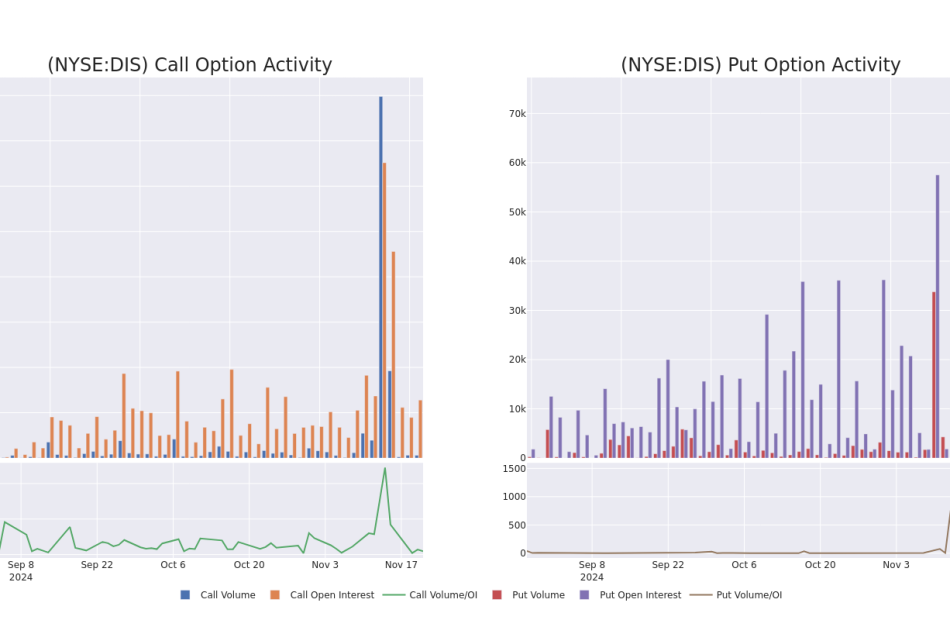
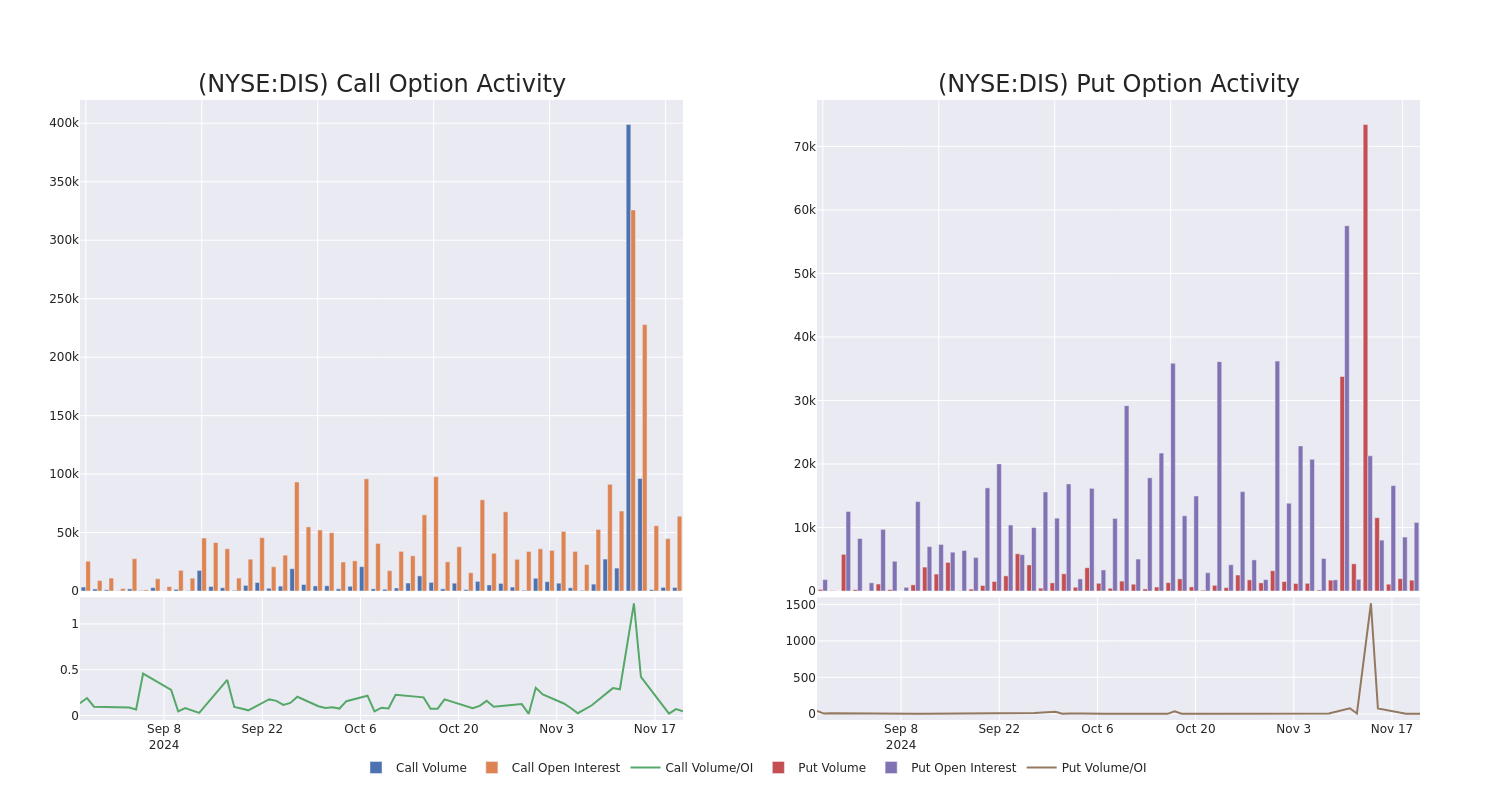
Assessing the volume and open interest is a strategic step in options trading. These metrics shed light on the liquidity and investor interest in Walt Disney’s options at specified strike prices. The forthcoming data visualizes the fluctuation in volume and open interest for both calls and puts, linked to Walt Disney’s substantial trades, within a strike price spectrum from $95.0 to $125.0 over the preceding 30 days.
Walt Disney Option Activity Analysis: Last 30 Days
Significant Options Trades Detected:
| Symbol | PUT/CALL | Trade Type | Sentiment | Exp. Date | Ask | Bid | Price | Strike Price | Total Trade Price | Open Interest | Volume |
|---|---|---|---|---|---|---|---|---|---|---|---|
| DIS | CALL | SWEEP | BEARISH | 01/17/25 | $6.75 | $6.7 | $6.7 | $110.00 | $76.3K | 26.8K | 440 |
| DIS | CALL | TRADE | BULLISH | 12/06/24 | $1.6 | $1.6 | $1.6 | $115.00 | $64.0K | 2.8K | 426 |
| DIS | CALL | TRADE | NEUTRAL | 01/17/25 | $15.45 | $15.05 | $15.22 | $100.00 | $60.8K | 17.0K | 40 |
| DIS | CALL | SWEEP | BULLISH | 03/21/25 | $7.55 | $7.4 | $7.52 | $115.00 | $59.4K | 3.2K | 442 |
| DIS | CALL | SWEEP | BEARISH | 01/17/25 | $6.75 | $6.7 | $6.7 | $110.00 | $47.5K | 26.8K | 518 |
About Walt Disney
Disney operates in three global business segments: entertainment, sports, and experiences. Entertainment and experiences both benefit from the firm’s ownership of iconic franchises and characters. Entertainment includes the ABC broadcast network, several cable television networks, and the Disney+ and Hulu streaming services. Within the segment, Disney also engages in movie and television production and distribution, with content licensed to movie theaters, other content providers, or, increasingly, kept in-house for use on Disney’s own streaming platform and television networks. The sports segment houses ESPN and the ESPN+ streaming service. Experiences contains Disney’s theme parks and vacation destinations, and also benefits from merchandise licensing.
Current Position of Walt Disney
- With a volume of 6,075,759, the price of DIS is up 0.99% at $115.39.
- RSI indicators hint that the underlying stock may be overbought.
- Next earnings are expected to be released in 76 days.
What Analysts Are Saying About Walt Disney
A total of 5 professional analysts have given their take on this stock in the last 30 days, setting an average price target of $129.0.
Turn $1000 into $1270 in just 20 days?
20-year pro options trader reveals his one-line chart technique that shows when to buy and sell. Copy his trades, which have had averaged a 27% profit every 20 days. Click here for access.
* An analyst from Deutsche Bank persists with their Buy rating on Walt Disney, maintaining a target price of $131.
* An analyst from B of A Securities has decided to maintain their Buy rating on Walt Disney, which currently sits at a price target of $140.
* An analyst from Evercore ISI Group has decided to maintain their Outperform rating on Walt Disney, which currently sits at a price target of $134.
* Reflecting concerns, an analyst from Needham lowers its rating to Buy with a new price target of $130.
* An analyst from Needham downgraded its action to Buy with a price target of $110.
Options are a riskier asset compared to just trading the stock, but they have higher profit potential. Serious options traders manage this risk by educating themselves daily, scaling in and out of trades, following more than one indicator, and following the markets closely.
If you want to stay updated on the latest options trades for Walt Disney, Benzinga Pro gives you real-time options trades alerts.
Market News and Data brought to you by Benzinga APIs
© 2024 Benzinga.com. Benzinga does not provide investment advice. All rights reserved.
Cannabinoid Leader Innocan Pharma's Q3: 174% YoY Revenue Growth
Innocan Pharma Corporation INNPF, an Israel-based cannabinoids-focused pharmaceutical company, reported a 174% year-over-year revenue growth, reaching $24 million for the first nine months of 2024. Quarterly revenues rose 111% YoY to $8.6 million, driven by robust sales from its subsidiary, BI Sky Global Ltd.
Q3 2024 Financial Highlights
- Revenue was $8.6 million for the third quarter, up 111% year-over-year, and $24 million for the nine-month period, up 174% year-over-year.
- Net income was $0.3 million, an increase of $2.1 million compared to a net loss of $1.8 million in Q3 2023.
- Adjusted EBITDA was not stated in the press release.
- Gross profit was $7.8 million for the third quarter, up 112% year-over-year.
Gross profit surged 183% YoY for the nine-month period, totaling $21.8 million, while Q3 gross profit grew 112% to $7.8 million. Operating profit turned positive, reaching $0.4 million, reversing a $1.2 million loss in Q3 2023.
Net profit also improved significantly, increasing by $2.1 million to $0.3 million for the quarter.
- Get Benzinga’s exclusive analysis and the top news about the cannabis industry and markets daily in your inbox for free. Subscribe to our newsletter here. If you’re serious about the business, you can’t afford to miss out.
Management Commentary
Iris Bincovich, Innocan’s CEO, attributed the strong performance to the company’s dual focus on pharmaceutical innovation and wellness. She highlighted the company’s progress in developing LPT-CBD, a proprietary non-opioid chronic pain management solution targeting both human and animal care. “Innocan is bringing strong value for shareholders,” Bincovich said, emphasizing the company’s commitment to addressing chronic pain.
Read Also: Can Trump’s Return Save The Cannabis Sector? Debt Mounts As Giants Face Post-Election Reckoning
Roni Kamhi, of BI Sky Global and COO of Innocan Pharma, highlighted the company’s consistent growth. “We are pleased to report nine consecutive quarters of continuous revenue growth,” he stated. He credited new product launches and enhanced brand awareness for the success.
Innocan’s financial gains underscore its strategic focus on innovation and market expansion, positioning the company as a rising player in the pharmaceutical sector. The company’s results signal ongoing growth potential amid increasing demand for non-opioid pain management solutions.
Read Next:
Market News and Data brought to you by Benzinga APIs
© 2024 Benzinga.com. Benzinga does not provide investment advice. All rights reserved.
Cannabis is evolving – don’t get left behind!
Curious about what’s next for the industry and how to leverage California’s unique market?
Join top executives, policymakers, and investors at the Benzinga Cannabis Market Spotlight in Anaheim, CA, at the House of Blues on November 12. Dive deep into the latest strategies, investment trends, and brand insights that are shaping the future of cannabis!
Get your tickets now to secure your spot and avoid last-minute price hikes.

