Cardano's Price Increased More Than 3% Within 24 hours
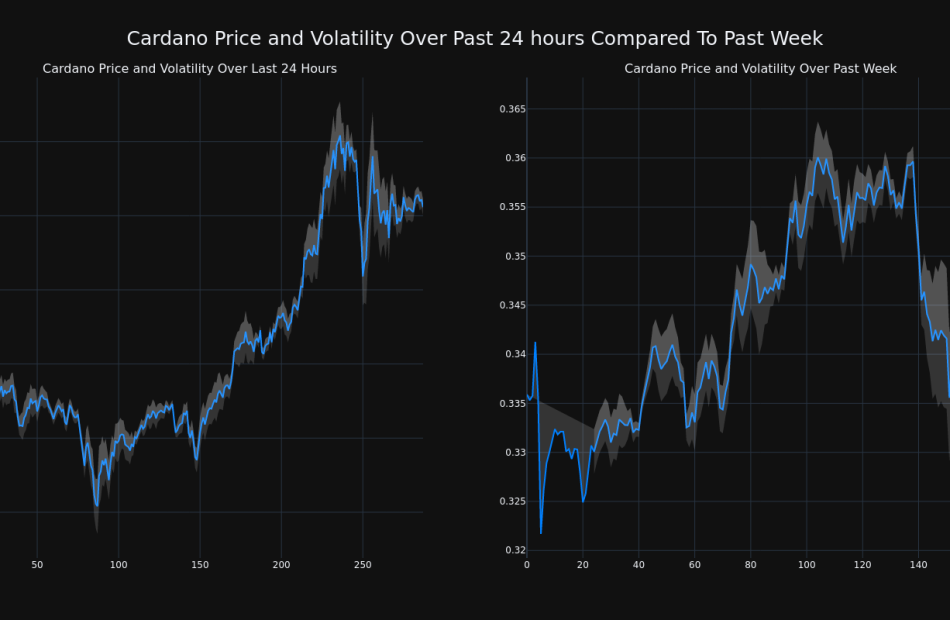
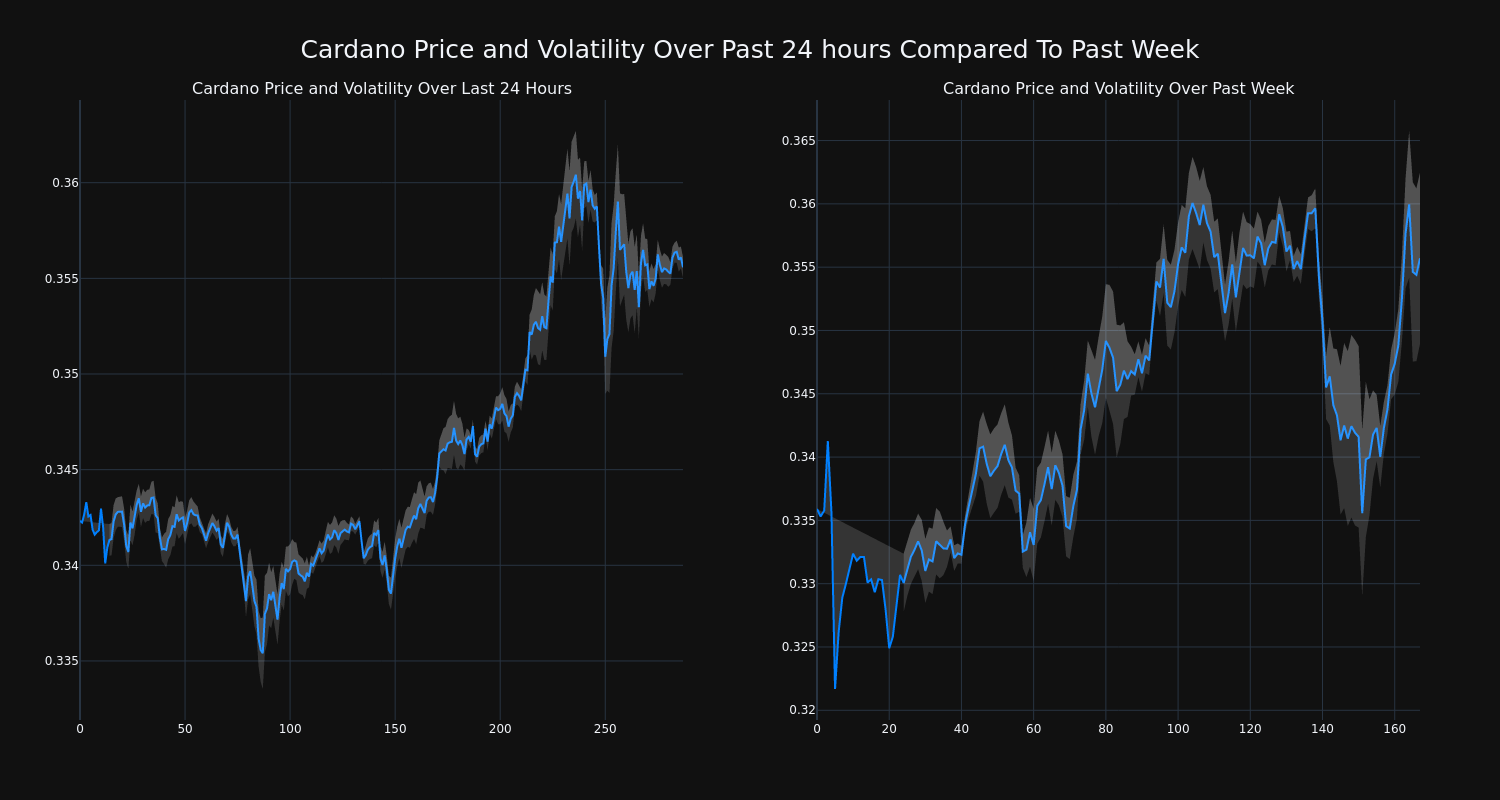
Cardano’s ADA/USD price has increased 3.88% over the past 24 hours to $0.36. Over the past week, ADA has experienced an uptick of over 6.0%, moving from $0.34 to its current price. As it stands right now, the coin’s all-time high is $3.09.
The chart below compares the price movement and volatility for Cardano over the past 24 hours (left) to its price movement over the past week (right). The gray bands are Bollinger Bands, measuring the volatility for both the daily and weekly price movements. The wider the bands are, or the larger the gray area is at any given moment, the larger the volatility.
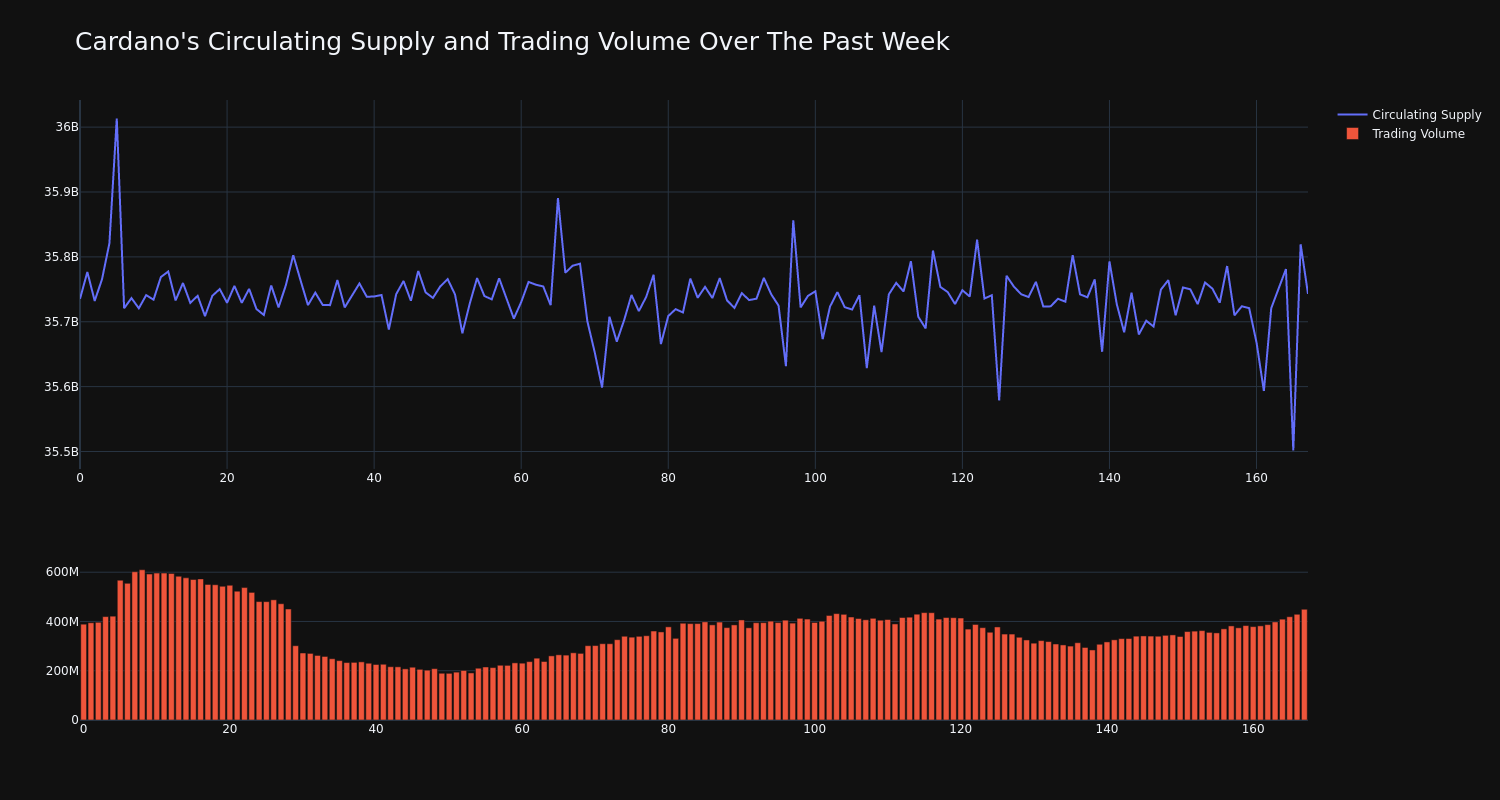
Cardano’s trading volume has climbed 16.0% over the past week along with the circulating supply of the coin, which has increased 0.02%. This brings the circulating supply to 35.75 billion, which makes up an estimated 79.44% of its max supply of 45.00 billion. According to our data, the current market cap ranking for ADA is #11 at $12.71 billion.
This article was generated by Benzinga’s automated content engine and reviewed by an editor.
Market News and Data brought to you by Benzinga APIs
© 2024 Benzinga.com. Benzinga does not provide investment advice. All rights reserved.
CENTENE SUBSIDIARY BUCKEYE HEALTH PLAN AWARDED CONTRACT TO SERVE DUAL ELIGIBILE MEDICARE AND MEDICAID MEMBERS IN OHIO
ST. LOUIS, Nov. 1, 2024 /PRNewswire/ — Centene Corporation CNC, a leading healthcare enterprise committed to helping people live healthier lives, announced today that its subsidiary, Buckeye Health Plan (Buckeye), has been selected by the Ohio Department of Medicaid (ODM) to continue providing Medicare and Medicaid services for dually eligible individuals through a Fully Integrated Dual Eligible Special Needs Plan (FIDE SNP). FIDE SNPs fully integrate care for dually eligible beneficiaries under a single managed care organization, allowing enrollees to receive all of their medical, behavioral and long-term services and supports through one plan.
MyCare Ohio members will not have any change at this time. Current MyCare Ohio providers will continue to serve MyCare Ohio members as they do today until the transition to the Next Generation MyCare plans in January 2026. At that time, the selected plans will be responsible for supporting Ohioans who are eligible for both Medicare and Medicaid healthcare coverage in the 29 counties where MyCare Ohio is currently available. Statewide expansion of the program will follow as quickly as possible.
“We are proud to be working with ODM to connect Ohio communities with the personal, specialized care they need and deserve,” said Centene Chief Executive Officer, Sarah M. London. “With our FIDE SNP program, we will continue to make sure our members get everything they need – under one plan – so they can focus on their health.”
Buckeye is among four health plans selected by ODM to deliver high-quality healthcare to Medicare-Medicaid eligible members through the state’s new FIDE SNP product. Buckeye’s current MMP program serves more than 9,000 members across 12 counties. With the FIDE SNP product offered through the Next Generation MyCare Ohio Program, Buckeye has the potential to expand its reach statewide when the program expands in 2027. Under the new contract, Buckeye will deploy innovative initiatives to meet members’ unique needs, addressing barriers to healthcare and critical social drivers of health, and improving care to promote independence.
“As your guide to better health, Buckeye is honored to continue to serve dually eligible Ohioans,” said Buckeye Health Plan President and CEO, Steve Province. “After serving this dual-eligible population for over a decade, Buckeye understands the importance of providing innovative solutions to meet the needs of Ohioans with complex healthcare challenges and advocating for support to help them thrive. We look forward to continuing our partnerships with members, providers, caregivers and the State of Ohio under the new contract.”
For more information about Buckeye’s current MyCare Ohio product, visit mmp.buckeyehealthplan.com.
Meridian Health Plan of Michigan, Inc., a Centene Corporation company, was also recently selected by the Michigan Department of Health and Human Services to provide highly integrated Medicare and Medicaid services for dually eligible Michiganders through a Highly Integrated Dual Eligible Special Needs Plan.
About Centene Corporation
Centene Corporation, a Fortune 500 company, is a leading healthcare enterprise that is committed to helping people live healthier lives. The Company takes a local approach – with local brands and local teams – to provide fully integrated, high-quality and cost-effective services to government-sponsored and commercial healthcare programs, focusing on under-insured and uninsured individuals. Centene offers affordable and high-quality products to more than 1 in 15 individuals across the nation, including Medicaid and Medicare members (including Medicare Prescription Drug Plans) as well as individuals and families served by the Health Insurance Marketplace and the TRICARE program.
Centene uses its investor relations website to publish important information about the Company, including information that may be deemed material to investors. Financial and other information about Centene is routinely posted and is accessible on Centene’s investor relations website, http://investors.centene.com/.
About Buckeye Health Plan
Buckeye Health Plan offers managed healthcare for Ohioans on Medicaid, Medicare, integrated Medicaid-Medicare (called MyCare Ohio) and the Health Insurance Exchange. Since 2004, Buckeye has been dedicated to improving the health of Ohioans, many with low incomes, by providing coordinated healthcare and other essential support that individuals and families need to grow and thrive. Buckeye Health Plan is a Centene Corporation company. Follow Buckeye on Twitter @Buckeye_Health and on Facebook at http://www.facebook.com/BuckeyeHealthPlan.
Forward-Looking Statements
All statements, other than statements of current or historical fact, contained in this press release are forward-looking statements. Without limiting the foregoing, forward-looking statements often use words such as “believe,” “anticipate,” “plan,” “expect,” “estimate,” “intend,” “seek,” “target,” “goal,” “may,” “will,” “would,” “could,” “should,” “can,” “continue” and other similar words or expressions (and the negative thereof). Centene Corporation and its subsidiaries (Centene, the Company, our or we) intends such forward-looking statements to be covered by the safe-harbor provisions for forward-looking statements contained in the Private Securities Litigation Reform Act of 1995, and we are including this statement for purposes of complying with these safe-harbor provisions. In particular, these statements include, without limitation, statements about our expected contract start dates and terms, our future operating or financial performance, market opportunity, competition, expected activities in connection with completed and future acquisitions and dispositions, our investments and the adequacy of our available cash resources. These forward-looking statements reflect our current views with respect to future events and are based on numerous assumptions “ and assessments made by us in light of our experience and perception of historical trends, current conditions, business strategies, operating environments, future developments and other factors we believe appropriate. By their nature, forward-looking statements involve known and unknown risks and uncertainties and are subject to change because they relate to events and depend on circumstances that will occur in the future, including economic, regulatory, competitive and other factors that may cause our or our industry’s actual results, levels of activity, performance or achievements to be materially different from any future results, levels of activity, performance, or achievements expressed or implied by these forward-looking statements. These statements are not guarantees of future performance and are subject to risks, uncertainties and assumptions. All forward-looking statements included in this press release are based on information available to us on the date hereof. Except as may be otherwise required by law, we undertake no obligation to update or revise the forward-looking statements included in this press release, whether as a result of new information, future events, or otherwise, after the date hereof. You should not place undue reliance on any forward-looking statements, as actual results may differ materially from projections, estimates, or other forward-looking statements due to a variety of important factors, variables and events including, but not limited to: our ability to design and price products that are competitive and/or actuarially sound including but not limited to any impacts resulting from Medicaid redeterminations; our ability to maintain or achieve improvement in the Centers for Medicare and Medicaid Services (CMS) Star ratings and maintain or achieve improvement in other quality scores in each case that can impact revenue and future growth; our ability to accurately predict and effectively manage health benefits and other operating expenses and reserves, including fluctuations in medical utilization rates; competition, including for providers, broker distribution networks, contract reprocurements and organic growth; our ability to adequately anticipate demand and provide for operational resources to maintain service level requirements; our ability to manage our information systems effectively; disruption, unexpected costs, or similar risks from business transactions, including acquisitions, divestitures, and changes in our relationships with third parties; impairments to real estate, investments, goodwill, and intangible assets; changes in senior management, loss of one or more key personnel or an inability to attract, hire, integrate and retain skilled personnel; membership and revenue declines or unexpected trends; rate cuts or other payment reductions or delays by governmental payors and other risks and uncertainties affecting our government businesses; changes in healthcare practices, new technologies, and advances in medicine; our ability to effectively and ethically use artificial intelligence and machine learning in compliance with applicable laws; increased healthcare costs; inflation and interest rates; the effect of social, economic, and political conditions and geopolitical events, including as a result of changes in U.S. presidential administrations or Congress; changes in market conditions; changes in federal or state laws or regulations, including changes with respect to income tax reform or government healthcare programs as well as changes with respect to the Patient Protection and Affordable Care Act and the Health Care and Education Affordability Reconciliation Act (collectively referred to as the ACA) and any regulations enacted thereunder; uncertainty concerning government shutdowns, debt ceilings or funding; tax matters; disasters, climate-related incidents, acts of war or aggression or major epidemics; changes in expected contract start dates and terms; changes in provider, broker, vendor, state, federal, and other contracts and delays in the timing of regulatory approval of contracts, including due to protests; the expiration, suspension, or termination of our contracts with federal or state governments (including, but not limited to, Medicaid, Medicare or other customers); the difficulty of predicting the timing or outcome of legal or regulatory audits, investigations, proceedings or matters, including, but not limited to, our ability to resolve claims and/or allegations made by states with regard to past practices on acceptable terms, or at all, or whether additional claims, reviews or investigations will be brought by states, the federal government or shareholder litigants, or government investigations; challenges to our contract awards; cyber-attacks or other data security incidents or our failure to comply with applicable privacy, data or security laws and regulations; the exertion of management’s time and our resources, and other expenses incurred and business changes required in connection with complying with the terms of our contracts and the undertakings in connection with any regulatory, governmental, or third party consents or approvals for acquisitions or dispositions; any changes in expected closing dates, estimated purchase price, or accretion for acquisitions or dispositions; losses in our investment portfolio; restrictions and limitations in connection with our indebtedness; a downgrade of our corporate family rating, issuer rating or credit rating of our indebtedness; the availability of debt and equity financing on terms that are favorable to us and risks and uncertainties discussed in the reports that Centene has filed with the Securities and Exchange Commission (SEC). This list of important factors is not intended to be exhaustive. We discuss certain of these matters more fully, as well as certain other factors that may affect our business operations, financial condition, and results of operations, in our filings with the SEC, including our annual report on Form 10-K, quarterly reports on Form 10-Q and current reports on Form 8-K. Due to these important factors and risks, we cannot give assurances with respect to our future performance, including without limitation our ability to maintain adequate premium levels or our ability to control our future medical and selling, general and administrative costs.
![]() View original content to download multimedia:https://www.prnewswire.com/news-releases/centene-subsidiary-buckeye-health-plan-awarded-contract-to-serve-dual-eligibile-medicare-and-medicaid-members-in-ohio-302294532.html
View original content to download multimedia:https://www.prnewswire.com/news-releases/centene-subsidiary-buckeye-health-plan-awarded-contract-to-serve-dual-eligibile-medicare-and-medicaid-members-in-ohio-302294532.html
SOURCE CENTENE CORPORATION
© 2024 Benzinga.com. Benzinga does not provide investment advice. All rights reserved.
Pinnacle Partners and Trilogy Investment Co. Launch Build-to-Rent OZ Fund
New BTR OZ Fund Fosters Development in Underserved Markets
ATLANTA, Nov. 1, 2024 /PRNewswire/ — Pinnacle Partners and Trilogy Investment Company launched a new Build-to-Rent (BTR) Opportunity Zone Fund to capitalize three shovel ready BTR communities in Decatur, GA, Augusta, GA and Huntsville, AL. With nearly 500 homes planned across these projects in Qualified Opportunity Zones, the Fund aims to revitalize these communities with new housing, while also intending to offer substantial tax incentives to investors.
“This tax-advantaged real estate fund is targeting strong risk-adjusted returns, fueled by long-term positive trends in these markets with an exciting in-demand asset class,” said Jeff Feinstein, Managing Partner, Pinnacle Partners. “In fact, the Fund’s launch is timely for investors looking for more tax-efficient strategies as they complete their year-end tax planning. We believe this is a great opportunity for investors who can manage the risk and liquidity.”
“The Pinnacle/Trilogy BTR OZ Fund is a groundbreaking initiative that will channel significant investments into underserved areas, foster community development and seek to offer attractive returns to investors,” comments Jason Joseph, CEO of Trilogy Investment Company.
The Pinnacle/Trilogy BTR OZ Fund launch follows Pinnacle Partners’ successful closing of two BTR projects with Trilogy Investment Company through Pinnacle Partners OZ Fund VIII. This closing includes a townhome development in the NoDa submarket of Charlotte, NC, and Avondale Station, a single-family home development in Avondale, AZ.
“This growing relationship with Trilogy has allowed us to be their co-GP investment partner for their upcoming pipeline of BTR projects,” states Feinstein. “We collectively have such conviction of the BTR asset class, moving forward with three curated projects in a new Opportunity Zone fund is the perfect next step.”
The Pinnacle/Trilogy BTR OZ Fund is now open to accredited investors seeking to take advantage of tax benefits of investing in Qualified Opportunity Zones while diversifying their investment portfolio.
For more information, visit Build-to-Rent OZ Fund.
About Trilogy Investment Company
Led by a team of investment, development, and construction professionals, Trilogy Investment Company provides Build-To-Rent communities for residents seeking the stability and social benefits of home ownership but rent by choice or have been priced out of the competitive housing market. Located in desirable neighborhoods near good schools and major economic drivers, these communities offer luxurious finishes and coveted amenities for like-minded families and young professionals desiring rental opportunities beyond traditional apartments. Created with targeted demographics in mind, these communities provide the flexibility of rentals with the stability, privacy, and social benefits of homeownership. Trilogy Investment Company was named the 37th fastest-growing private company in Atlanta for 2023 by the Atlanta Business Chronicle. To learn more about Trilogy Investment Company, visit www.trilogyic.com and follow the company on LinkedIn.
About Pinnacle Partners
Pinnacle Partners is an early mover and leader in Opportunity Zone (OZ) real estate investing. The firm and its subsidiaries have invested over $270 million of equity across 13 projects, consisting of approximately 2,400 multifamily units and two historic adaptive reuse office buildings. Pinnacle seeks best-in-class development partners in target markets across the U.S. with track records of delivering and operating successful projects. For more information, visit www.pinnacleoz.com.
Past performance of Pinnacle Partners OZ Funds is not indicative of future results. There can be no assurance that the fund’s objectives will be achieved or that cash distributions will, in fact, be made or, if made, whether those distributions will be made when or in the amount anticipated or that certain tax benefits will be available to investors. An investment in the fund is illiquid, speculative, and will involve significant risks. Full details about the fund and its associated risks can be found in the fund offering documents.
MEDIA CONTACT:
Denim Marketing
Carol Morgan
404-626-1978
Carol@DenimMarketing.com
www.DenimMarketing.com
![]() View original content:https://www.prnewswire.com/news-releases/pinnacle-partners-and-trilogy-investment-co-launch-build-to-rent-oz-fund-302294133.html
View original content:https://www.prnewswire.com/news-releases/pinnacle-partners-and-trilogy-investment-co-launch-build-to-rent-oz-fund-302294133.html
SOURCE Trilogy Investment Co
Market News and Data brought to you by Benzinga APIs
© 2024 Benzinga.com. Benzinga does not provide investment advice. All rights reserved.
Helport AI Reports Fiscal Full Year 2024 Financial Results
FY 2024 Revenue up 132% to $29.6 Million Year over Year
Net Income up 53% to $7.4 Million Year over Year
Completed Merger and Began Trading as a Public Company on Nasdaq Under Ticker Symbol “HPAI” on August 5, 2024
Management to Host Business Update Conference Call on Wednesday, November 6, 2024 at 5:30 pm ET
SINGAPORE and SAN DIEGO, Nov. 01, 2024 (GLOBE NEWSWIRE) — Helport AI Limited HPAI (“Helport AI” or the “Company”), an AI technology company serving enterprise clients with intelligent software, services and solutions, today announced financial results for its fiscal full year ended June 30, 2024.
Helport AI Highlights:
- A pioneering AI technology company dedicated to empowering enterprises with intelligent software, services and solutions, aimed at accelerating sales growth, driving operational excellence and reducing cost in customer engagement.
- Established global presence, with offices in the United States, Singapore, and the Philippines. supporting 30,000+ active users around the world.
- Helport AI’s products and services have been applied across various industries, including banking, insurance, mortgage sales, wealth management, government services, and real estate.
- Helport AI Assist – a SaaS software launched in 2022, which has become a key business focus, and provides AI-powered real-time speech guidance for customer communications, dedicated to enhancing sales performance and driving operational excellence, with functions including Agent Assistant, Quality Assurance Assistant, Supervisor Assistant, and Knowledge Base Assistant.
- Our AI+BPO service provides worldwide 24/7 customer engagement with AI-driven monitoring, compliance, and knowledge tools. Through global BPO partners, clients could access flexible, multilingual support, boosting performance and reducing costs.
- HDE (Helport AI Developer Ecosystem) – An in-development ecosystem-based developer platform that packages Helport AI’s core underlying technologies and algorithms for different industries through open APIs, allowing for the rapid creation of industry-specific applications.
Fiscal 2024 Year & Subsequent Operational Highlights:
- Helport AI Assist Software is officially approved and available on Google Cloud Marketplace.
- On August 2, 2024, the Company closed its business combination with Tristar Acquisition I Corp. (“Tristar”) TRIS
- Upon closing, an aggregate of $10.4 million in gross proceeds was raised to support its operations, including $5.5 million private placement financing (“PIPE Investment”) and the rest in the form of convertible notes.
- Revenue for the fiscal year ended June 30, 2024 was $29.6 million, an increase of 132% from $12.7 million in the prior year.
- Gross profit for fiscal year 2024 was $18.6 million, an increase of 137% from $7.8 million in fiscal year 2023.
- Net income was $7.4 million in fiscal year 2024 compared to $4.8 million in fiscal year 2023, an increase of 53%.
- Net cash provided by operating activities was $5.0 million for the fiscal year ended June 30, 2024.
- Cash was $2.6 million as of June 30, 2024. Subsequently consummated the PIPE Investment referenced above.
- As of August 8, 2024, there were 37,132,968 ordinary shares and 18,844,987 warrants issued and outstanding.
Management Commentary
“Fiscal 2024 was highlighted by laying the foundation for a global expansion, our Nasdaq listing in August, and rising demand for our AI software and services for enterprise clients,” said Guanghai Li, Chief Executive Officer of Helport AI. “The transition from a private to public company was an incredibly proud moment and milestone for our company, our employees and our shareholders, one that we expect will catalyze our product development and service improvements, enhance our brand awareness in the U.S., and provide opportunities for growth outside of our traditional organically funded operations.
“Helport AI aspires to be a global leader in AI-enhanced customer contact software and services, dedicated to empowering businesses with scalable and intelligent customer engagement. Our mission is to empower everyone to work as an expert through AI solutions. We believe that we are at the forefront of transforming how businesses engage with their customers, enhancing sales, optimizing operations and driving success across industries.
“Our proprietary software, Helport AI Assist, provides AI-powered real time speech guidance for customer contact. Our self-developed AI technologies include real-time communication assistance, real-time sales guidance, real-time quality assurance, efficient knowledge base construction, voice cloning, and more. Our fully independent architecture, where the AI engine is separated from the knowledge base, allows for seamless flexibility, while keeping knowledge bases straightforward. This simplicity allows for faster deployment and adoption, and we intend that it would enable our customers to exceed their goals, particularly in the areas of sales, quality control, and compliance.
“Looking ahead, we will continue to strengthen our capabilities in more industries, including insurance, mortgage, wealth management, banking, government services, telecommunications, real estate, e-commerce, and more. We believe that we have made great strides in the financial services sector, securing partnerships in mortgage, insurance, and wealth management. These partnerships underscore our adaptability in catering to complex industries, where accurate interpretation and communication are critical.
“Our San Diego office will serve as our growth engine for the U.S. market and innovation, while our Singapore office will continue to be the center for global operations. This is expected to strengthen our presence in North America, especially as we see major breakthroughs with developing partnerships such as Google and eWorld Enterprise Solutions in supporting U.S. government sectors.
“We are pleased to announce Helport AI’s official listing on Google Cloud Marketplace, a milestone that we believe will enhance our global reach and strengthen our technology and data security credibility. We trust that this presence will enable us to deliver scalable, high-performance AI solutions across industries, advancing operational efficiency and customer engagement. Looking forward, we will focus on expanding U.S. partnerships and strengthening our ecosystem to drive the next wave of intelligent customer interactions.
“In the mid-term we plan to launch our Helport AI Developer Ecosystem (HDE). Inspired by NVIDIA’s CUDA platform, we are developing an open API interface that aims to enable thirty-party developers to create their own applications using our AI engine. This will allow any developers to innovate within our ecosystem, making it increasingly easy for anyone to innovate on our platform. By fostering this ecosystem, we aim to solidify our position as the go-to platform for AI-driven solutions across industries.
“Taken together, we expect our revenue growth will sustain in 2025, driven by the full impact of our new partnerships and expanded U.S. presence. In addition, we will continue to prioritize R&D investments, particularly in the development of HDE, to support long-term innovation and expansion. We look forward to providing updates in the months to come, including those attending our Business Update Conference Call next Wednesday, November 6th,” concluded Li.
2024 Fiscal Year Financial Results
Revenue for the fiscal year ended June 30, 2024 increased by 132% to $29.6 million compared to $12.7 million in the fiscal year ended June 30, 2023. The increase was primarily attributable to an average monthly subscribed seats increase from 2,192 for the fiscal year ended June 30, 2023 to 5,475 for the fiscal year ended June 30, 2024, which was driven by (i) efforts in continuous optimization and development in service offerings and platform, (ii) capabilities to increase overall cost performance for customers in their business management process, and (iii) the growing demands in professional technology services market.
Gross Profit for the fiscal year ended June 30, 2024 increased to $18.6 million compared to a gross profit of $7.8 million in the fiscal year ended June 30, 2023. Gross margin was 62.8% in the fiscal year ended June 30, 2024 as compared to 61.6% in the fiscal year ended June 30, 2023. The increases indicate that as sales increased, the Company was also able to optimize cost structure and achieve economic scale effect in the improvement of gross profit margin performance.
General and administrative expenses increased to $5.0 million in the fiscal year ended June 30, 2024 from $1.6 million in the fiscal year ended June 30, 2023, primarily attributable to an increase in withholding tax incurred from AI service provided to customers in the PRC subject to a 10% withholding tax rate.
Research and development expenses increased to $4.3 million in the fiscal year ended June 30, 2024, compared to $0.4 million in the fiscal year ended June 30, 2023, primarily due to the addition of AI training service fees and product development fees incurred during the year in order to enhance core competence to differentiate and diversify in products and service offerings with competitive technology, especially related to the development of AI technology application scenarios.
Net income for the fiscal year ended June 30, 2024 was $7.4 million as compared with $4.8 million in the fiscal year ended June 30, 2023, an increase of 53%.
Cash was $2.6 million as of June 30, 2024, as compared to $0.1 million on June 30, 2023.
Net cash provided by operating activities was $5.0 million in fiscal year ended June 30, 2024 compared to net cash used of $0.5 million in fiscal year 2023.
Business Update Conference Call
Guanghai Li, Chief Executive Officer, and Tao Ke, Chief Financial Officer, will host the conference call, followed by a question-and-answer session. The conference call will be accompanied by a presentation, which can be viewed during the webcast or accessed via the investor relations section of the Company’s website here.
To access the call, please use the following information:
| Date: | Wednesday, November 6, 2024 |
| Time: | 5:30 p.m. Eastern Time, 2:30 p.m. Pacific Time |
| Toll-free dial-in number: | 1-800-445-7795 |
| International dial-in number: | 1-203-518-9848 |
| Conference ID (Required for Entry): | HELPORT |
Please call the conference telephone number 5-10 minutes prior to the start time. An operator will register your name and organization. If you have any difficulty connecting with the conference call, please contact MZ Group at 1-949-491-8235.
The conference call will be broadcast live and available for replay at https://viavid.webcasts.com/starthere.jsp?ei=1695608&tp_key=0c8510f685 and via the investor relations section of the Company’s website here.
A replay of the webcast will be available after 9:30 p.m. Eastern Time through February 6, 2025.
| Toll-free replay number: | 1-844-512-2921 |
| International replay number: | 1-412-317-6671 |
| Replay ID: | 11157509 |
About Helport AI
Helport AI HPAI is a provider of AI-driven solutions, specializing in providing products and services aimed at enhancing professional capabilities across industries. Focused on delivering measurable outcomes, Helport AI is set to transform the way businesses operate by ensuring that professionals have the tools they need to succeed. The company serves enterprise-level customer contact services through intelligent products, solutions, and a digital platform, and is dedicated to helping businesses optimize their operations and improve customer engagement. Our mission is to empower everyone to work as an expert. For more information, please visit Helport AI’s website: https://ir.helport.ai/.
Forward-Looking Statements
Certain statements in this announcement are forward-looking statements, including, but not limited to, Helport AI’s business plan and outlook. These forward-looking statements involve known and unknown risks and uncertainties and are based on Helport AI’s current expectations and projections about future events that Helport AI believes may affect its financial condition, results of operations, business strategy and financial needs. Investors can identify these forward-looking statements by words or phrases such as “approximates,” “believes,” “hopes,” “expects,” “anticipates,” “estimates,” “projects,” “intends,” “plans,” “will,” “would,” “should,” “could,” “may” or other similar expressions. Helport AI undertakes no obligation to update or revise publicly any forward-looking statements to reflect subsequent occurring events or circumstances, or changes in its expectations, except as may be required by law. Although Helport AI believes that the expectations expressed in these forward-looking statements are reasonable, it cannot assure you that such expectations will turn out to be correct, and Helport AI cautions investors that actual results may differ materially from the anticipated results and encourages investors to review other factors that may affect its future results in Helport AI’s registration statement and other filings with the U.S. Securities and Exchange Commission.
Investor Relations Contact:
Chris Tyson
Executive Vice President
MZ North America
Direct: 949-491-8235
HPAI@mzgroup.us
www.mzgroup.us
| HELPORT AI LIMITED COMBINED BALANCE SHEETS (Amounts in and U.S. dollars (“US$”), except share data) |
|||||||
| As of June 30, | |||||||
| 2024 | 2023 | ||||||
| Cash | $ | 2,581,086 | $ | 142,401 | |||
| Accounts receivable | 21,313,735 | 14,545,921 | |||||
| Deferred offering costs | 817,871 | – | |||||
| Prepaid expenses and other receivables | 41,966 | – | |||||
| Total current assets | 24,754,658 | 14,688,322 | |||||
| Intangible assets, net | 2,425,694 | 4,083,333 | |||||
| Total non-current asset | 2,425,694 | 4,083,333 | |||||
| Total assets | $ | 27,180,352 | $ | 18,771,655 | |||
| Accounts payable | $ | 284,067 | $ | 10,158,729 | |||
| Income tax payable | 2,724,998 | 1,123,065 | |||||
| Amount due to related parties | 965,776 | 592,797 | |||||
| Convertible promissory notes | 4,889,074 | – | |||||
| Accrued expenses and other liabilities | 5,263,239 | 1,212,985 | |||||
| Total current liabilities | 14,127,154 | 13,087,576 | |||||
| Total liabilities | 14,127,154 | 13,087,576 | |||||
| Commitments and contingencies | |||||||
| Ordinary shares (US$1 par value per share; 50,000 authorized as of June 30, 2024, and 2023; 156 issued and outstanding as of June 30, 2024 and 2023, respectively)* | 156 | 156 | |||||
| Additional paid-in capital | 7,556 | 7,556 | |||||
| Subscription receivables | (156 | ) | (156 | ) | |||
| Retained earnings | 13,045,642 | 5,676,523 | |||||
| Shareholders’ equity | 13,053,198 | 5,684,079 | |||||
| Total liabilities and shareholders’ equity | $ | 27,180,352 | $ | 18,771,655 | |||
| * | The shares and per share information are presented on a retroactive basis to reflect the shares reorganization (Note 10). |
| HELPORT AI LIMITED COMBINED STATEMENTS OF OPERATIONS AND COMPREHENSIVE INCOME (Amounts in and U.S. dollars (“US$”), except share data) |
|||||||||||
| For the years ended June 30, | |||||||||||
| 2024 | 2023 | 2022 | |||||||||
| Revenues | $ | 29,575,625 | $ | 12,728,313 | $ | 2,667,914 | |||||
| Cost of revenues | (10,998,011 | ) | (4,882,792 | ) | (1,246,701 | ) | |||||
| Gross profit | 18,577,614 | 7,845,521 | 1,421,213 | ||||||||
| Selling expenses | (97,984 | ) | (50,830 | ) | (99,817 | ) | |||||
| General and administrative expenses | (4,979,382 | ) | (1,625,887 | ) | (340,625 | ) | |||||
| Research and development expenses | (4,303,490 | ) | (375,410 | ) | – | ||||||
| Total operating expenses | (9,380,856 | ) | (2,052,127 | ) | (440,442 | ) | |||||
| Income from operation | 9,196,758 | 5,793,394 | 980,771 | ||||||||
| Financial expenses, net | (226,713 | ) | (7,936 | ) | (5,894 | ) | |||||
| Other income, net | 1,007 | – | – | ||||||||
| Income before income tax expense | 8,971,052 | 5,785,458 | 974,877 | ||||||||
| Income tax expense | (1,601,933 | ) | (970,755 | ) | (152,917 | ) | |||||
| Net income | $ | 7,369,119 | $ | 4,814,703 | $ | 821,960 | |||||
| Total comprehensive income | $ | 7,369,119 | $ | 4,814,703 | $ | 821,960 | |||||
| Earnings per ordinary share | |||||||||||
| Basic | 47,238 | 30,863 | 5,269 | ||||||||
| Diluted | 47,238 | 30,863 | 5,269 | ||||||||
| Weighted average number of ordinary shares outstanding* | |||||||||||
| Basic | 156 | 156 | 156 | ||||||||
| Diluted | 156 | 156 | 156 | ||||||||
| * | The shares and per share information are presented on a retroactive basis to reflect the shares reorganization (Note 10). |
| HELPORT AI LIMITED COMBINED STATEMENTS OF CASH FLOWS (Amounts in and U.S. dollars (“US$”), except share data) |
|||||||||||
| For the years ended June 30, | |||||||||||
| 2024 | 2023 | 2022 | |||||||||
| CASH FLOWS FROM OPERATING ACTIVITIES: | |||||||||||
| Net income | $ | 7,369,119 | $ | 4,814,703 | $ | 821,960 | |||||
| Adjustments to reconcile net income to net cash provided by operating activities: | |||||||||||
| Amortization of intangible assets | 2,352,639 | 2,333,334 | 583,333 | ||||||||
| Changes in operating assets and liabilities: | |||||||||||
| Accounts receivable | (6,813,674 | ) | (12,079,780 | ) | (2,463,761 | ) | |||||
| Prepaid expenses and other receivables | (41,966 | ) | – | – | |||||||
| Accounts payable | (3,158,729 | ) | 2,547,916 | 610,813 | |||||||
| Amount due to related parties | 21,640 | 7,626 | 16,450 | ||||||||
| Accrued expenses and other liabilities | 3,702,668 | 951,932 | 194,508 | ||||||||
| Income tax payable | 1,601,933 | 970,148 | 152,917 | ||||||||
| Net cash provided by/(used in) operating activities | 5,033,630 | (454,121 | ) | (83,780 | ) | ||||||
| CASH FLOWS FORM INVESTING ACTIVITY | |||||||||||
| Purchase of intangible assets | (7,410,933 | ) | – | – | |||||||
| Net cash used in investing activity | (7,410,933 | ) | – | – | |||||||
| CASH FLOWS FORM FINANCING ACTIVITIES | |||||||||||
| Payment for listing costs | (817,871 | ) | – | – | |||||||
| Proceeds from convertible promissory notes | 4,889,074 | – | – | ||||||||
| Loan from a third party | 977,156 | 66,545 | – | ||||||||
| Repayment of loan from a third party | (629,570 | ) | – | – | |||||||
| Loan from related parties | 354,977 | 569,059 | 196,388 | ||||||||
| Repayment of loan from related parties | (3,638 | ) | (45,102 | ) | (114,465 | ) | |||||
| Net cash provided by financing activities | 4,770,128 | 590,502 | 81,923 | ||||||||
| Effect of exchange rate changes | 45,860 | (2,380 | ) | – | |||||||
| Net change in cash | 2,438,685 | 134,001 | (1,857 | ) | |||||||
| Cash at the beginning of the year | 142,401 | 8,400 | 10,257 | ||||||||
| Cash at the end of the year | $ | 2,581,086 | $ | 142,401 | $ | 8,400 | |||||

© 2024 Benzinga.com. Benzinga does not provide investment advice. All rights reserved.
Cryptocurrency Aptos Falls More Than 3% In 24 hours
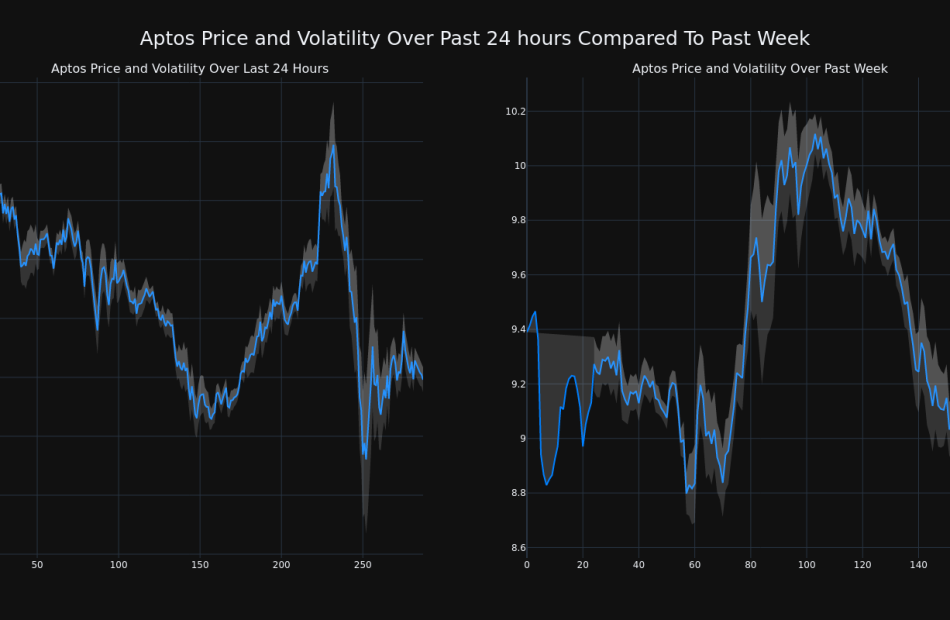
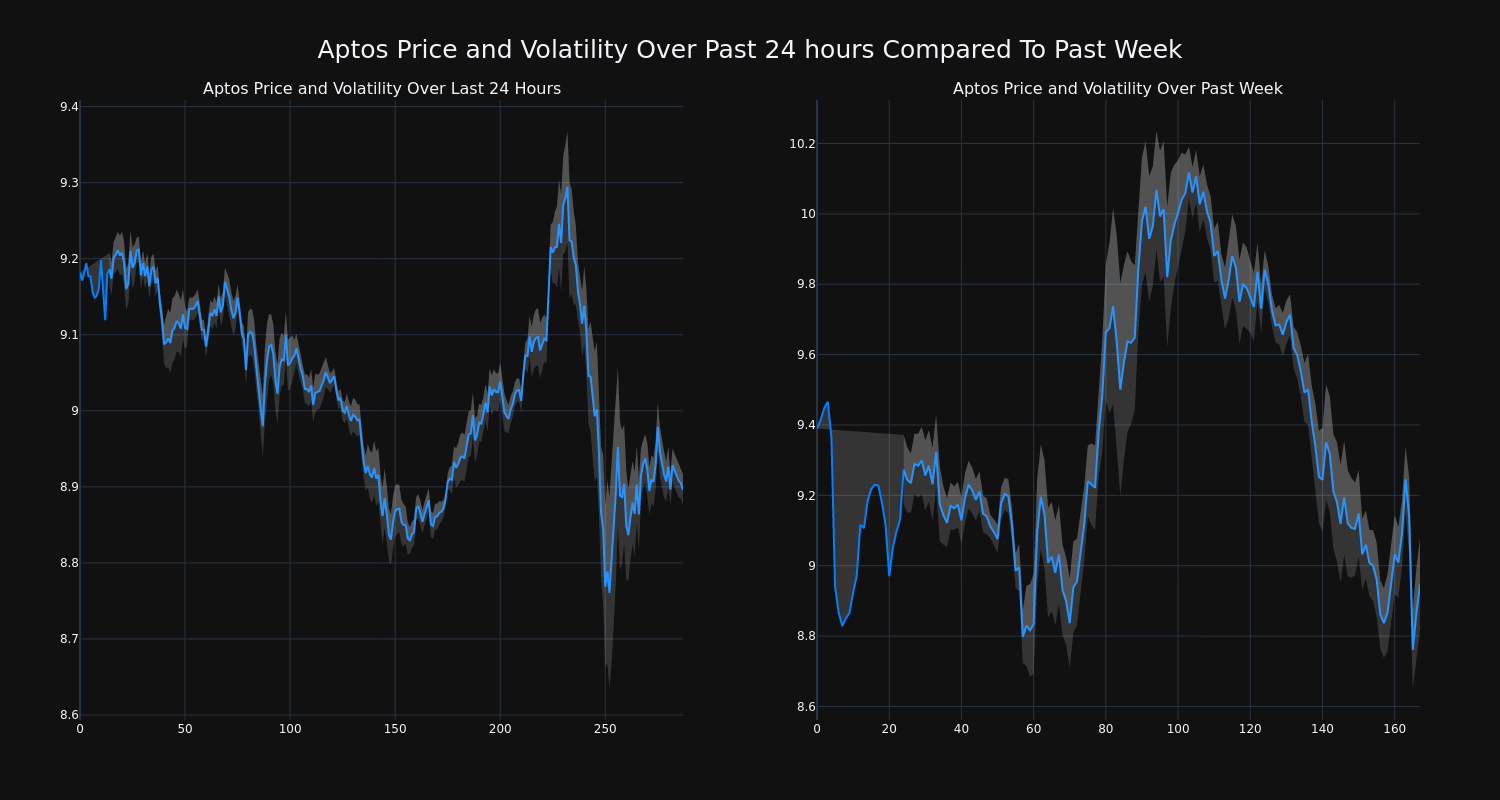
Aptos’s APT/USD price has decreased 3.11% over the past 24 hours to $8.9, continuing its downward trend over the past week of -5.0%, moving from $9.39 to its current price.
The chart below compares the price movement and volatility for Aptos over the past 24 hours (left) to its price movement over the past week (right). The gray bands are Bollinger Bands, measuring the volatility for both the daily and weekly price movements. The wider the bands are, or the larger the gray area is at any given moment, the larger the volatility.
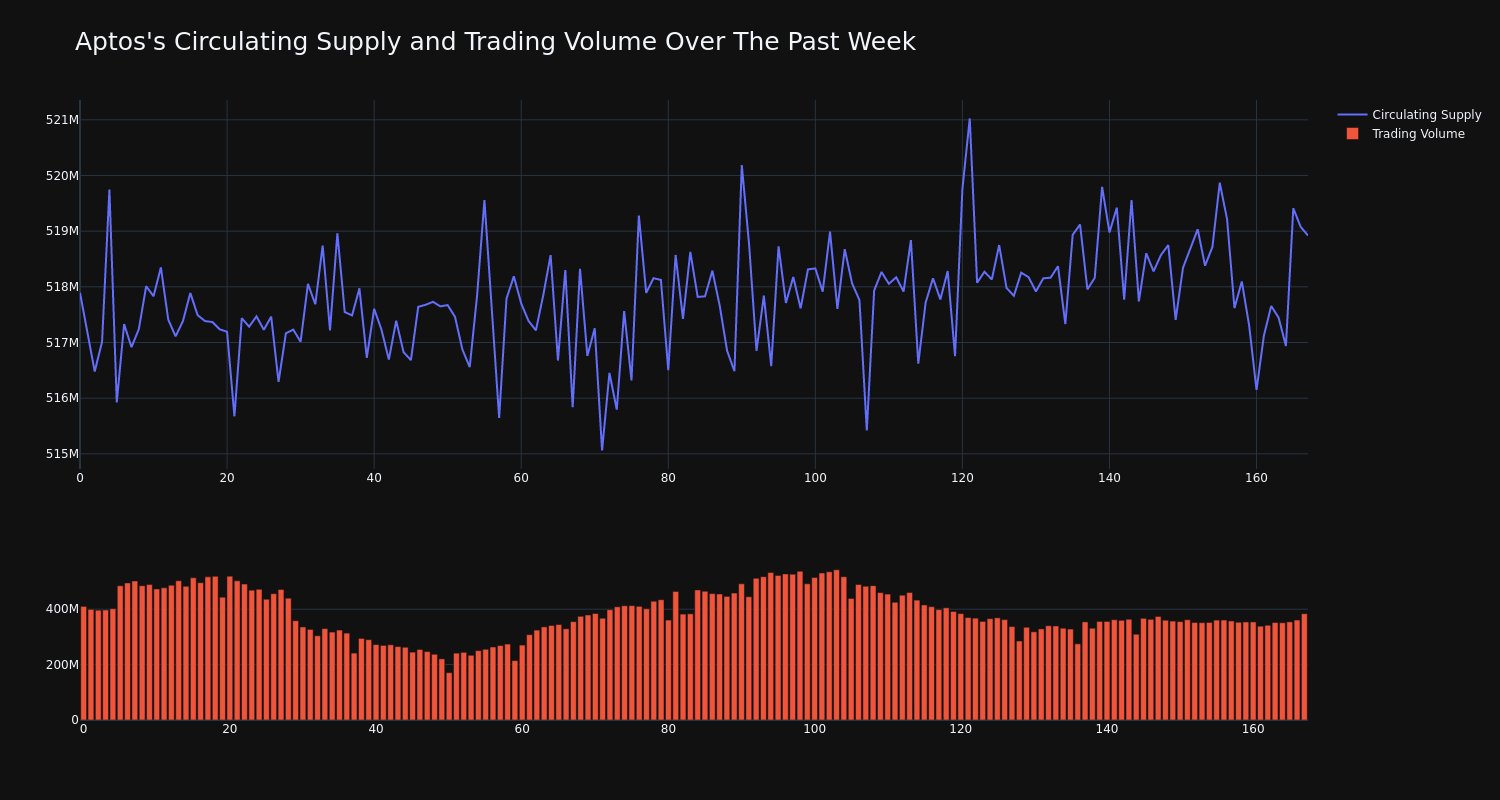
The trading volume for the coin has tumbled 6.0% over the past week while the circulating supply of the coin has risen 0.2%. This brings the circulating supply to 518.44 million. According to our data, the current market cap ranking for APT is #26 at $4.61 billion.
This article was generated by Benzinga’s automated content engine and reviewed by an editor.
Market News and Data brought to you by Benzinga APIs
© 2024 Benzinga.com. Benzinga does not provide investment advice. All rights reserved.
Nvidia Set to Replace Intel in the Dow Jones Industrial Average
(Bloomberg) — Nvidia Corp., the chipmaker at the heart of the artificial intelligence boom, is joining the oldest of Wall Street’s three main equity benchmarks.
Most Read from Bloomberg
The company will replace rival Intel Corp. in the 128-year-old Dow Jones Industrial Average prior to the start of trading on Nov. 8, S&P Dow Jones Indices said in a statement late Friday. Sherwin-Williams Co. is also joining, replacing Dow Inc.
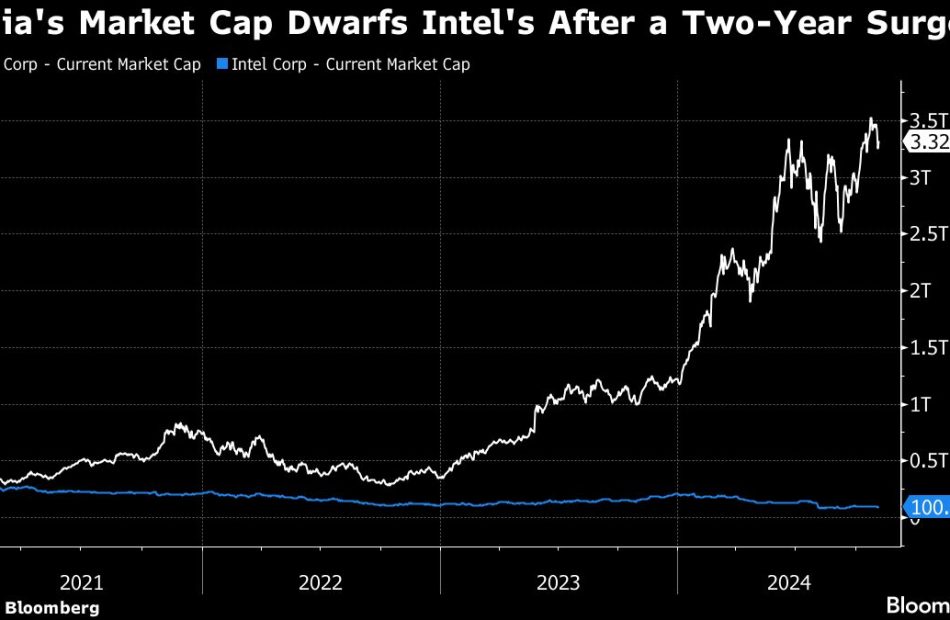
The addition of Nvidia to the blue-chip index is a testament to the power of the AI-driven rally that’s pushed the chipmaker up 900% in the past 24 months. The Dow Jones Industrial Average was the only major US equity benchmark that didn’t hold Nvidia — until now.
“Nvidia is a well-run company and joining the Dow demonstrates just how powerful its rally has been in recent years after it was at the right place at the right time when no one else was,” said Scott Colyer, chief executive at Advisors Asset Management.
The Santa Clara, California-based company has been the poster child of the euphoria surrounding AI and the biggest driver of stock market gains. The chipmaker ended the week with a market value of $3.32 trillion, about $50 billion shy of Apple Inc. Shares were up 3.2% in post-market trading, putting Nvidia in a position to dethrone Apple as the world’s most valuable company as soon as Monday if the gains hold.
Intel joined the gauge in November 1999 when it was added along with Microsoft Corp., SBC Communications and Home Depot Inc. Once the industry leader in computer processors, Intel has been recently struggling under a turnaround plan. The company has slashed spending in 2024, cut jobs and suspended investor payouts. Shares have lost 54% this year, and sank another 2% after the bell.
“Intel has lagged in a huge way,” said Adam Sarhan, founder of 50 Park Investments. “Now, the Dow is evolving. You don’t want to see stocks that were there 30 years ago. You want to see what’s the strongest that survive today.”
Midland, Michigan-based Dow Inc. has been in the blue-chip index since 2019, when it was spun off by former parent DowDuPont.
The Dow Jones Industrial Average, which first started as an index of 12 industrial stocks that included General Electric Co., has faced criticism for being a much narrower equities gauge than the S&P 500 Index or the Nasdaq 100 and lacking technology stocks that have dominated markets in recent years.
Tech Stocks Surge But S&P 500 Faces Second Weekly Decline, Amazon Rallies, Bitcoin Drops Below $70,000: What's Driving Markets Friday?
Wall Street rebounded Friday following Thursday’s selloff, yet midday gains were still insufficient to prevent a second consecutive weekly decline for the S&P 500, currently down 1% for the week.
Concerns over tech earnings eased after Amazon.com Inc. AMZN outperformed expectations, restoring some risk appetite and supporting the sector rebound.
Amazon shares surged over 6%, heading for their best session since February.
The Nasdaq 100, up by 1.1%, outperformed the S&P 500, up 0.8%.
In economic data, the U.S. economy added just 12,000 jobs in October, a steep drop from the 223,000 gain in September and well below the forecast of 113,000, as hurricanes and strikes led to hiring freezes nationwide.
Despite the weak job figures, the unemployment rate held steady at 4.1%, indicating companies chose to retain workers rather than downsize.
The ISM Manufacturing PMI signaled contraction for the seventh consecutive month in October, with the index missing estimates.
Oil prices experienced a volatile session, initially spiking on reports of an imminent retaliatory attack by Iran on Israel before pulling back as those concerns faded. Gold edged down 0.1%.
Bitcoin BTC/USD dipped 0.3%, slipping below the $70,000 mark.
Friday’s Performance In Major US Indices, ETFs
| Major Indices | Price | 1-day % change |
| Nasdaq 100 | 20,123.15 | 1.2% |
| Dow Jones | 42,161.88 | 1.0% |
| S&P 500 | 5,751.05 | 0.8% |
| Russell 2000 | 2,209.70 | 0.6% |
According to Benzinga Pro data:
- The SPDR S&P 500 ETF Trust SPY rose 0.9% to $573.75.
- The SPDR Dow Jones Industrial Average DIA rose 1.1% to $422.09.
- The tech-heavy Invesco QQQ Trust Series QQQ rallied 1.2% to $489.80.
- The iShares Russell 2000 ETF IWM rose 0.8% to $219.26.
- The Consumer Discretionary Select Sector SPDR Fund XLY outperformed, rising 2%. The Utilities Select Sector SPDR Fund XLU lagged, down 1.4%.
Friday’s Stock Movers
Stocks reacting to earnings reports included:
- Apple Inc. AAPL, down 1.6%.
- Intel Corp. INTC, up over 6%.
- Atlassian Corp. TEAM, up 20%.
- Exxon Mobil Corp. XOM, down 0.7%.
- Chevron Corp. CVX, up 2.8%.
- Charter Communications Inc. CHTR, up 13%.
- Dominon Energy Inc. D, down 0.2%.
- Cardinal Health Inc. CAH, up 6%.
- CBOE Global Markets Inc. CBOE, down 2.9%.
- Waters Corp. WAT, up 17%.
Read Next:
Image created using artificial intelligence via Midjourney.
Market News and Data brought to you by Benzinga APIs
© 2024 Benzinga.com. Benzinga does not provide investment advice. All rights reserved.
Cryptocurrency Bittensor Down More Than 3% Within 24 hours
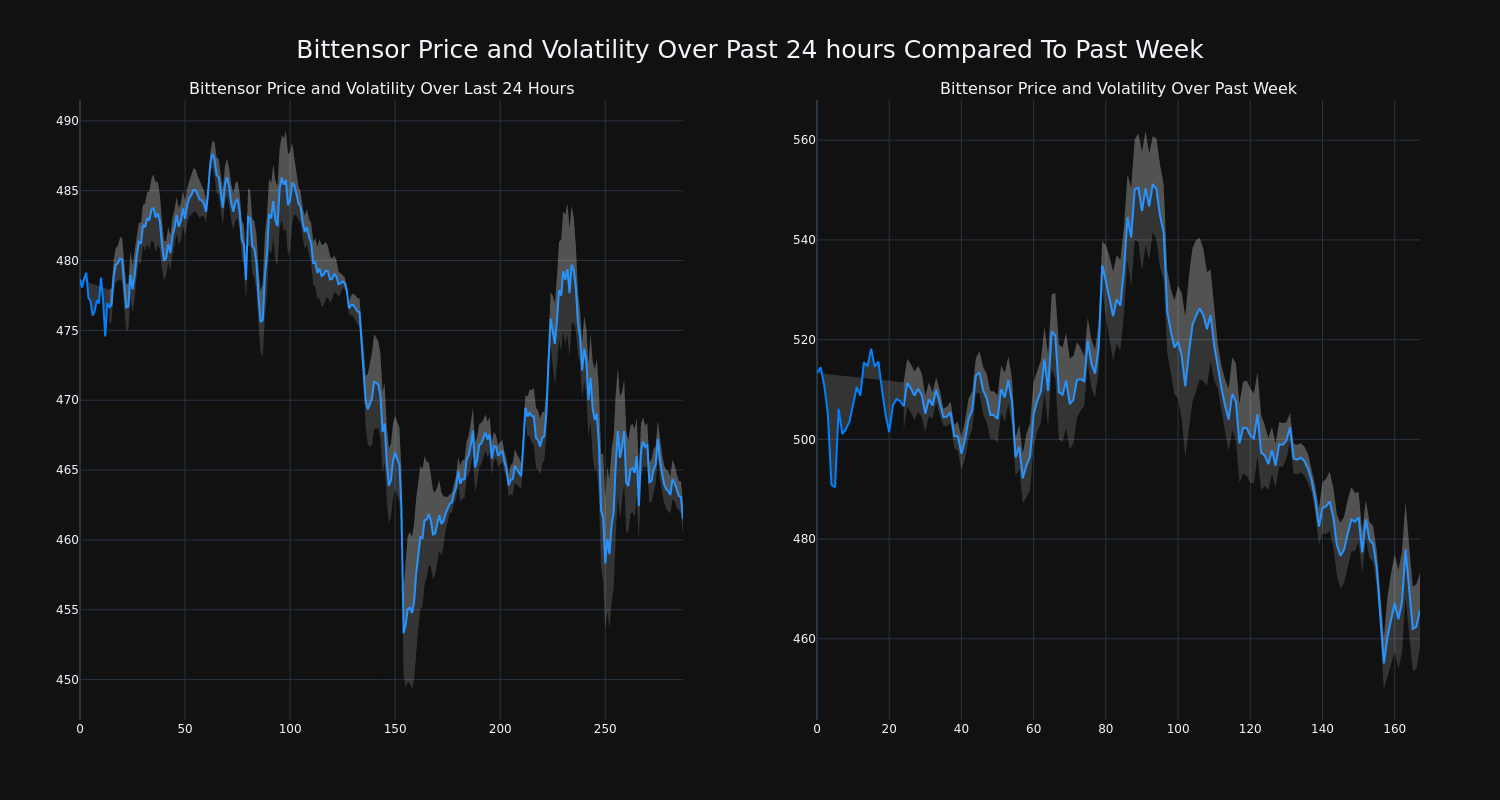
Bittensor’s TAO/USD price has decreased 3.49% over the past 24 hours to $461.95, continuing its downward trend over the past week of -9.0%, moving from $513.3 to its current price.
The chart below compares the price movement and volatility for Bittensor over the past 24 hours (left) to its price movement over the past week (right). The gray bands are Bollinger Bands, measuring the volatility for both the daily and weekly price movements. The wider the bands are, or the larger the gray area is at any given moment, the larger the volatility.
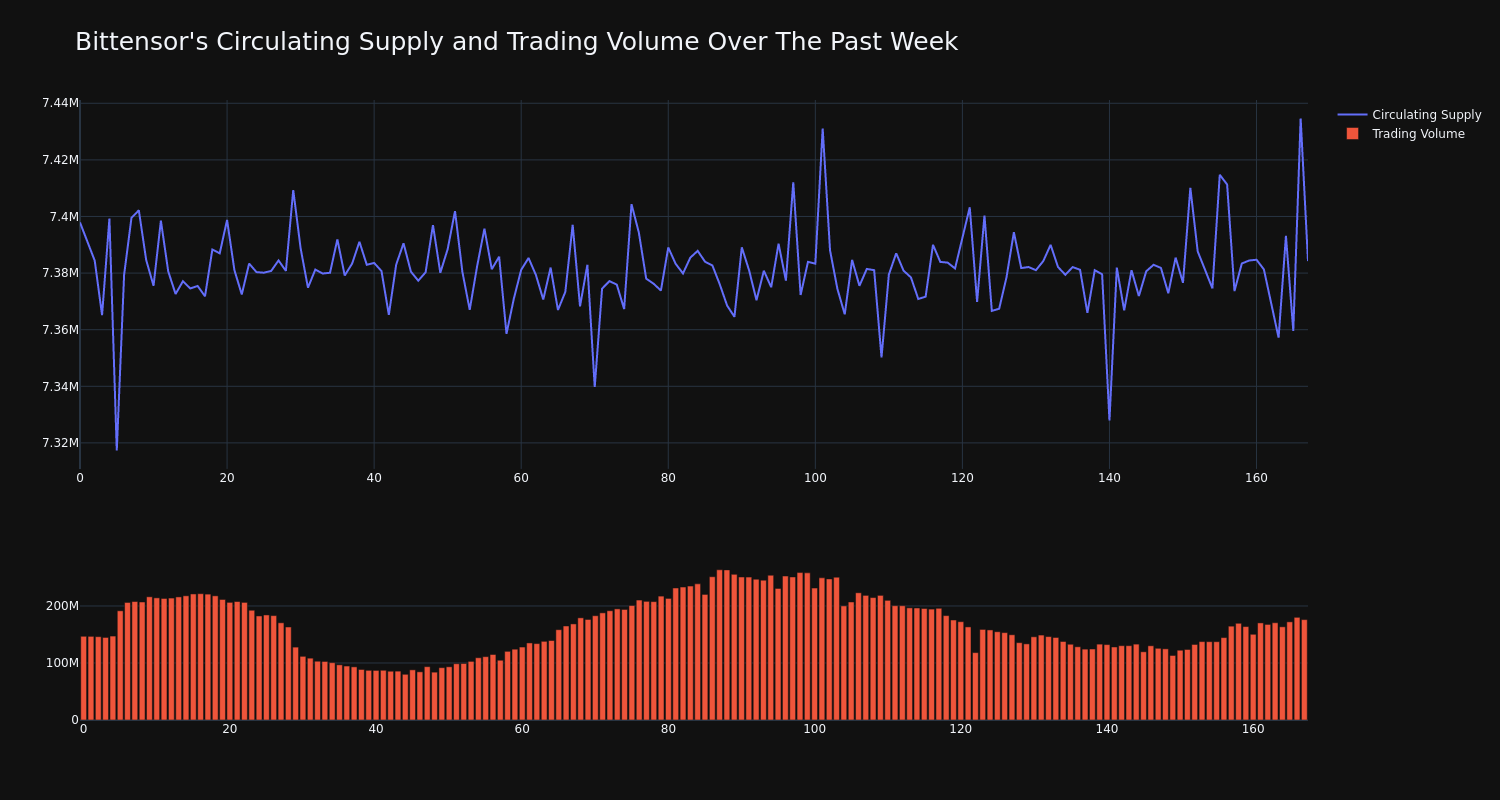
The trading volume for the coin has risen 20.0% over the past week diverging from the circulating supply of the coin, which has decreased 0.18%. This brings the circulating supply to 7.38 million, which makes up an estimated 35.15% of its max supply of 21.00 million. According to our data, the current market cap ranking for TAO is #31 at $3.41 billion.
This article was generated by Benzinga’s automated content engine and reviewed by an editor.
Market News and Data brought to you by Benzinga APIs
© 2024 Benzinga.com. Benzinga does not provide investment advice. All rights reserved.
Liberty Northwest Bancorp, Inc. Reports Third Quarter 2024 Earnings
2024 Third Quarter Financial Highlights:
- Total assets were $183.7 million at quarter end.
- Net interest income of $1.01 million for the third quarter.
- Net interest margin of 2.37% for the third quarter.
- Total deposits increased 2% to $146.4 million at September 30, 2024, compared to $143.1 million a year ago.
- Net loans increased 1% to $140.0 million at September 30, 2024, compared to $139.2 million a year ago.
- Asset quality remains pristine.
- Non-interest bearing demand deposits represent 27% of total deposits.
- Tangible book value per share was $7.67 at quarter end.
POULSBO, Wash., Nov. 01, 2024 (GLOBE NEWSWIRE) — Liberty Northwest Bancorp, Inc. LBNW (the “Company”) and its wholly-owned subsidiary Liberty Bank today announced net income of $25 thousand for the third quarter ended September 30, 2024, compared to $7 thousand for the second quarter ended June 30, 2024, and $6 thousand for the third quarter ended September 30, 2023. In the first nine months of 2024, net income increased 41% to $47 thousand, compared to $33 thousand the same period in 2023.
Total assets were $183.7 million as of September 30, 2024, compared to $188.3 million at September 30, 2023. Net loans totaled $140.0 million as of September 30, 2024, a 2% decrease compared to $143.2 million at June 30, 2024, and a 1% increase compared to $139.2 million a year ago. Loan demand was muted during the quarter largely due to the high interest rate environment.
Asset quality remained pristine during the quarter. The allowance for credit losses totaled $1.17 million as of September 30, 2024, and was 0.83% of total loans outstanding. The Company recorded net loan charge-offs of $4 thousand during the quarter. The Company has one non-performing loan of $235 thousand as of September 30, 2024.
Due to strong credit quality metrics and muted loan growth, the Company recorded a $95 thousand reversal to its provision for credit losses in the third quarter of 2024. This compared to a $90 thousand reversal to its provision for credit losses in the second quarter of 2024 and a $25 thousand reversal to its provision for credit losses in the third quarter of 2023.
Total deposits increased 2% to $146.4 million at September 30, 2024, compared to $143.1 million at September 30, 2023, and increased modestly compared to $145.8 million three months earlier. Non-interest bearing demand accounts represented 27%, interest bearing demand represented 28%, money market and savings accounts comprised 19%, and certificates of deposit made up 26% of the total deposit portfolio at September 30, 2024.
“We continue to take advantage of our strong local economy, with a growing deposit base and loan pipeline,” said Rick Darrow, Liberty Northwest Bancorp, Inc. President and Chief Executive Officer. “While the high-interest rate environment continues to be a challenge, we believe we are well positioned with a strong balance sheet and ample capital to continue to grow.”
Net interest income, before the provision for loan losses, was $1.01 million for the third quarter of 2024, compared to $1.14 million in the third quarter of 2023. The decrease in net interest income year-over-year was primarily due to the increase in interest expense on deposits and other borrowings resulting from the higher interest rate environment. For the first nine months of 2024, net interest income was $3.11 million, compared to $3.35 million for the first nine months of 2023.
“Higher yields on earning assets during the quarter were more than offset by the increase in cost of funds, resulting in net interest margin compression during the quarter,” said Darrow. The Company’s net interest margin was 2.37% for the third quarter of 2024, compared to 2.45% for the preceding quarter, and 2.64% for the third quarter of 2023. For the first nine months of 2024, the net interest margin was 2.40%, compared to 2.62% for the first nine months of 2023.
Total non-interest income was $74 thousand for the third quarter of 2024, compared to $111 thousand for the third quarter a year ago. The decrease compared to the year ago quarter was primarily due to higher referral fee income during the third quarter of 2023, compared to the third quarter of 2024. For the first nine months of 2024, non-interest income was $226 thousand, compared to $371 thousand for the first nine months of 2023.
Total noninterest expense was $1.14 million for the third quarter of 2024, a decrease of $121 thousand, or 10%, from the third quarter a year ago. Compensation and benefits costs decreased by $69 thousand, or 9%, over the year ago quarter, while occupancy costs decreased by $57 thousand, or 40% from the same quarter a year ago. Year-to-date, total noninterest expense decreased $228 thousand, or 6%, to $3.50 million, over the same period in 2023.
“We have done a good job of managing operating expenses over the last several quarters, reducing total noninterest expense by 10% over the third quarter a year ago,” said Darrow. “Our operating performance is expected to continue to improve, as we improve our margin, and continue to keep operating expenses in check. We are well positioned for continued growth in our core business operations and remain focused on creating value for all of our customers, employees and shareholders.”
Capital ratios continue to exceed regulatory requirements, with a total risk-based capital ratio at 15.97% at quarter end, substantially above well-capitalized regulatory requirements. The tangible book value per share was $7.67 at quarter end, compared to $7.71 a year earlier.
Near the end of the second quarter of 2024, the Company completed the issuance of $1.2 million of Preferred Stock. Under the terms of the transaction, the Preferred Stock will convert to Common Stock within a 2 year time period.
“The proceeds from this offering will be used to further strengthen our capital position and to support continued loan growth in our vibrant Pacific Northwest markets,” said Darrow.
About Liberty Northwest Bancorp, Inc.
Liberty Northwest Bancorp, Inc. is the bank holding company for Liberty Bank, a commercial bank chartered in the State of Washington. The Bank began operations June 11, 2009, and operates a full-service branch in Poulsbo, WA. The Bank provides loan and deposit services to predominantly small and middle-sized businesses and individuals in and around Kitsap and King counties. The Bank is subject to regulation by the State of Washington Department of Financial Institutions and the Federal Deposit Insurance Corporation (FDIC). For more information, please visit www.libertybanknw.com. Liberty Northwest Bancorp, Inc. LBNW, qualified to trade on the OTCQX® Best Market in June 2022. For information related to the trading of LBNW, please visit www.otcmarkets.com.
Forward-Looking Statement Safe Harbor: This news release contains comments or information that constitutes forward-looking statements (within the meaning of the Private Securities Litigation Reform Act of 1995) that are based on current expectations that involve a number of risks and uncertainties. Forward-looking statements describe Liberty Northwest Bancorp, Inc.’s projections, estimates, plans and expectations of future results and can be identified by words such as “believe,” “intend,” “estimate,” “likely,” “anticipate,” “expect,” “looking forward,” and other similar expressions. They are not guarantees of future performance. Actual results may differ materially from the results expressed in these forward-looking statements, which because of their forward-looking nature, are difficult to predict. Investors should not place undue reliance on any forward-looking statement, and should consider factors that might cause differences including but not limited to the degree of competition by traditional and nontraditional competitors, declines in real estate markets, an increase in unemployment or sustained high levels of unemployment; changes in interest rates; greater than expected costs to integrate acquisitions, adverse changes in local, national and international economies; changes in the Federal Reserve’s actions that affect monetary and fiscal policies; changes in legislative or regulatory actions or reform, including without limitation, the Dodd-Frank Wall Street Reform and Consumer Protection Act; demand for products and services; changes to the quality of the loan portfolio and our ability to succeed in our problem-asset resolution efforts; the impact of technological advances; changes in tax laws; and other risk factors. Liberty Northwest Bancorp, Inc. undertakes no obligation to publicly update or clarify any forward-looking statement to reflect the impact of events or circumstances that may arise after the date of this release.
| STATEMENTS OF INCOME (Unaudited) | |||||||||||||||||||||||||||||||
| (Dollars in thousands) | |||||||||||||||||||||||||||||||
| Quarter Ended Sept 30, 2024 |
Quarter Ended June 30, 2024 |
Three Month Change |
Quarter Ended Sept 30, 2023 |
One Year Change |
Year to Date Sept 30, 2024 |
Year to Date Sept 30, 2023 |
One Year Change |
||||||||||||||||||||||||
| Interest Income | |||||||||||||||||||||||||||||||
| Loans | $ | 1,994 | $ | 1,920 | 4 | % | $ | 1,814 | 10 | % | $ | 5,875 | $ | 5,283 | 11 | % | |||||||||||||||
| Interest bearing deposits in banks | 83 | 61 | 38 | % | 99 | -16 | % | 223 | 222 | 0 | % | ||||||||||||||||||||
| Securities | 114 | 119 | -4 | % | 119 | -4 | % | 352 | 343 | 3 | % | ||||||||||||||||||||
| Total interest income | 2,192 | 2,100 | 4 | % | 2,032 | 8 | % | 6,451 | 5,848 | 10 | % | ||||||||||||||||||||
| Interest Expense | |||||||||||||||||||||||||||||||
| Deposits | 903 | 785 | 15 | % | 544 | 66 | % | 2,370 | 1,484 | 60 | % | ||||||||||||||||||||
| Other Borrowings | 283 | 261 | 9 | % | 352 | -20 | % | 975 | 1,012 | -4 | % | ||||||||||||||||||||
| Total interest expense | 1,186 | 1,046 | 13 | % | 896 | 32 | % | 3,345 | 2,497 | 34 | % | ||||||||||||||||||||
| Net Interest Income | 1,005 | 1,053 | -5 | % | 1,136 | -11 | % | 3,106 | 3,352 | -7 | % | ||||||||||||||||||||
| Provision for Loan Losses | (95 | ) | (90 | ) | 6 | % | (25 | ) | 280 | % | (225 | ) | (45 | ) | 400 | % | |||||||||||||||
| Net interest income after provision for loan losses | 1,100 | 1,143 | -4 | % | 1,161 | -5 | % | 3,331 | 3,397 | -2 | % | ||||||||||||||||||||
| Non-Interest Income | |||||||||||||||||||||||||||||||
| Service charges on deposit accounts | 28 | 28 | -3 | % | 17 | 60 | % | 77 | 50 | 53 | % | ||||||||||||||||||||
| Other non-interest income | 46 | 51 | -9 | % | 94 | -51 | % | 149 | 321 | -54 | % | ||||||||||||||||||||
| Total non-interest income | 74 | 79 | -7 | % | 111 | -34 | % | 226 | 371 | -39 | % | ||||||||||||||||||||
| Non-Interest Expense | |||||||||||||||||||||||||||||||
| Salaries and employee benefits | 668 | 673 | -1 | % | 737 | -9 | % | 1,946 | 2,149 | -9 | % | ||||||||||||||||||||
| Occupancy and equipment expenses | 88 | 96 | -9 | % | 145 | -40 | % | 329 | 444 | -26 | % | ||||||||||||||||||||
| Other operating expenses | 387 | 445 | -13 | % | 382 | 1 | % | 1,223 | 1,133 | 8 | % | ||||||||||||||||||||
| Total non-interest expenses | 1,143 | 1,214 | -6 | % | 1,264 | -10 | % | 3,498 | 3,726 | -6 | % | ||||||||||||||||||||
| Net Income Before Income Tax | 31 | 9 | 268 | % | 8 | 311 | % | 59 | 42 | 41 | % | ||||||||||||||||||||
| Provision for Income Tax | 7 | 2 | 268 | % | 2 | 311 | % | 12 | 9 | 41 | % | ||||||||||||||||||||
| Net Income | $ | 25 | $ | 7 | 268 | % | $ | 6 | 311 | % | $ | 47 | $ | 33 | 41 | % | |||||||||||||||
| BALANCE SHEETS (Unaudited) | ||||||||||||||||||||
| (Dollars in thousands) | ||||||||||||||||||||
| Sept 30, 2024 |
June 30, 2024 |
Three Month Change |
Sept 30, 2023 |
One Year Change |
||||||||||||||||
| Assets | ||||||||||||||||||||
| Cash and due from Banks | $ | 2,408 | $ | 2,124 | 13 | % | $ | 3,359 | -28 | % | ||||||||||
| Interest bearing deposits in banks | 11,262 | 14,625 | -23 | % | 11,635 | -3 | % | |||||||||||||
| Securities | 21,225 | 21,664 | -2 | % | 24,316 | -13 | % | |||||||||||||
| Loans | 141,206 | 144,477 | -2 | % | 140,467 | 1 | % | |||||||||||||
| Allowance for loan losses | (1,167 | ) | (1,266 | ) | -8 | % | (1,227 | ) | -5 | % | ||||||||||
| Net Loans | 140,038 | 143,210 | -2 | % | 139,240 | 1 | % | |||||||||||||
| Premises and fixed assets | 6,161 | 6,219 | -1 | % | 6,512 | -5 | % | |||||||||||||
| Accrued Interest receivable | 668 | 678 | -2 | % | 678 | -2 | % | |||||||||||||
| Intangible assets | 19 | 26 | -27 | % | 46 | -58 | % | |||||||||||||
| Other assets | 1,897 | 2,262 | -16 | % | 2,534 | -25 | % | |||||||||||||
| Total Assets | $ | 183,678 | $ | 190,808 | -4 | % | $ | 188,320 | -2 | % | ||||||||||
| Liabilities and Shareholders’ Equity | ||||||||||||||||||||
| Deposits | ||||||||||||||||||||
| Demand, non-interest bearing | $ | 39,669 | $ | 44,092 | -10 | % | $ | 43,702 | -9 | % | ||||||||||
| Interest Bearing Demand | 40,764 | 40,171 | 1 | % | 30,865 | 32 | % | |||||||||||||
| Money Market and Savings | 27,419 | 24,534 | 12 | % | 27,207 | 1 | % | |||||||||||||
| Certificates of Deposit | 38,507 | 36,989 | 4 | % | 41,317 | -7 | % | |||||||||||||
| Total Deposits | 146,359 | 145,786 | 0 | % | 143,091 | 2 | % | |||||||||||||
| Total Borrowing | 22,454 | 30,446 | -26 | % | 31,923 | -30 | % | |||||||||||||
| Accrued interest payable | 238 | 244 | -2 | % | 303 | -21 | % | |||||||||||||
| Other liabilities | 704 | 212 | 233 | % | 316 | 123 | % | |||||||||||||
| Total Liabilities | 169,756 | 176,687 | -4 | % | 175,633 | -3 | % | |||||||||||||
| Shareholders’ Equity | ||||||||||||||||||||
| Preferred Stock | 1,242 | 1,242 | 0 | % | *** | |||||||||||||||
| Common Stock | 1,650 | 1,650 | 0 | % | 1,644 | 0 | % | |||||||||||||
| Additional paid in capital | 13,138 | 13,147 | -0 | % | 13,095 | 0 | % | |||||||||||||
| Retained Earnings | (1,447 | ) | (1,471 | ) | 2 | % | (1,495 | ) | 3 | % | ||||||||||
| Other Comprehensive Income | (661 | ) | (447 | ) | -48 | % | (557 | ) | -19 | % | ||||||||||
| Total Shareholders’ Equity | 13,922 | 14,121 | -1 | % | 12,687 | 10 | % | |||||||||||||
| Total Liabilities and Shareholders’ Equity | $ | 183,678 | $ | 190,808 | -4 | % | $ | 188,320 | -2 | % | ||||||||||
| Quarter Ended Sept 30, 2024 |
Quarter Ended June 30, 2024 |
Quarter Ended Sept 30, 2023 |
YTD 2024 | YTD 2023 | ||||||||||||||||
| Financial Ratios | ||||||||||||||||||||
| Return on Average Assets | 0.06 | % | 0.01 | % | 0.01 | % | 0.03 | % | 0.02 | % | ||||||||||
| Return on Average Equity | 0.70 | % | 0.21 | % | 0.19 | % | 0.47 | % | 0.35 | % | ||||||||||
| Efficiency Ratio | 105.9 | % | 107.2 | % | 101.4 | % | 105.0 | % | 99.7 | % | ||||||||||
| Net Interest Margin | 2.37 | % | 2.45 | % | 2.64 | % | 2.40 | % | 2.62 | % | ||||||||||
| Loan to Deposits | 96.5 | % | 99.1 | % | 97.3 | % | ||||||||||||||
| Tangible Book Value per Share | $ | 7.67 | $ | 7.79 | $ | 7.71 | ||||||||||||||
| Book Value per Share | $ | 7.68 | $ | 7.80 | $ | 7.74 | ||||||||||||||
| Earnings per Share | $ | 0.01 | $ | 0.00 | $ | 0.00 | $ | 0.03 | $ | 0.02 | ||||||||||
| Asset Quality | ||||||||||||||||||||
| Net Loan Charge-offs (recoveries) | $ | 4 | $ | (228 | ) | $ | – | |||||||||||||
| Nonperforming Loans | $ | 235 | $ | 235 | $ | – | ||||||||||||||
| Nonperforming Assets to Total Assets | 0.13 | % | 0.12 | % | 0.00 | % | ||||||||||||||
| Allowance for Loan Losses to Total Loans | 0.83 | % | 0.88 | % | 0.87 | % | ||||||||||||||
| Other Real Estate Owned | – | – | – | |||||||||||||||||
| CAPITAL (Bank only) | ||||||||||||||||||||
| Tier 1 leverage ratio | 10.23 | % | 9.86 | % | 9.63 | % | ||||||||||||||
| Tier 1 risk-based capital ratio | 15.00 | % | 14.24 | % | 14.46 | % | ||||||||||||||
| Total risk based capital ratio | 15.97 | % | 15.26 | % | 15.48 | % | ||||||||||||||

For further discussion, please contact:
Rick Darrow, Chief Executive Officer | 360-394-4750
© 2024 Benzinga.com. Benzinga does not provide investment advice. All rights reserved.
Cryptocurrency Optimism Down More Than 3% Within 24 hours
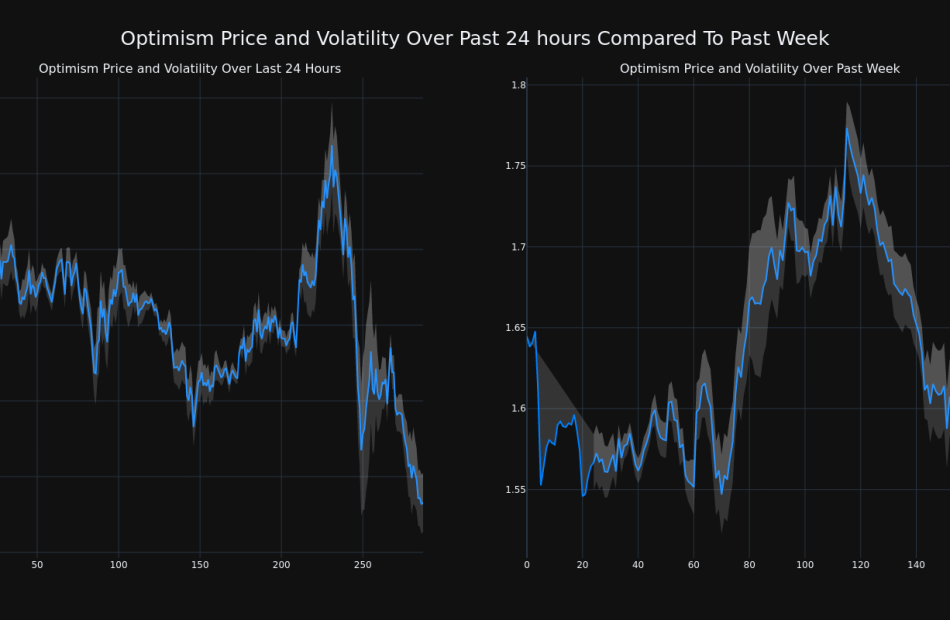
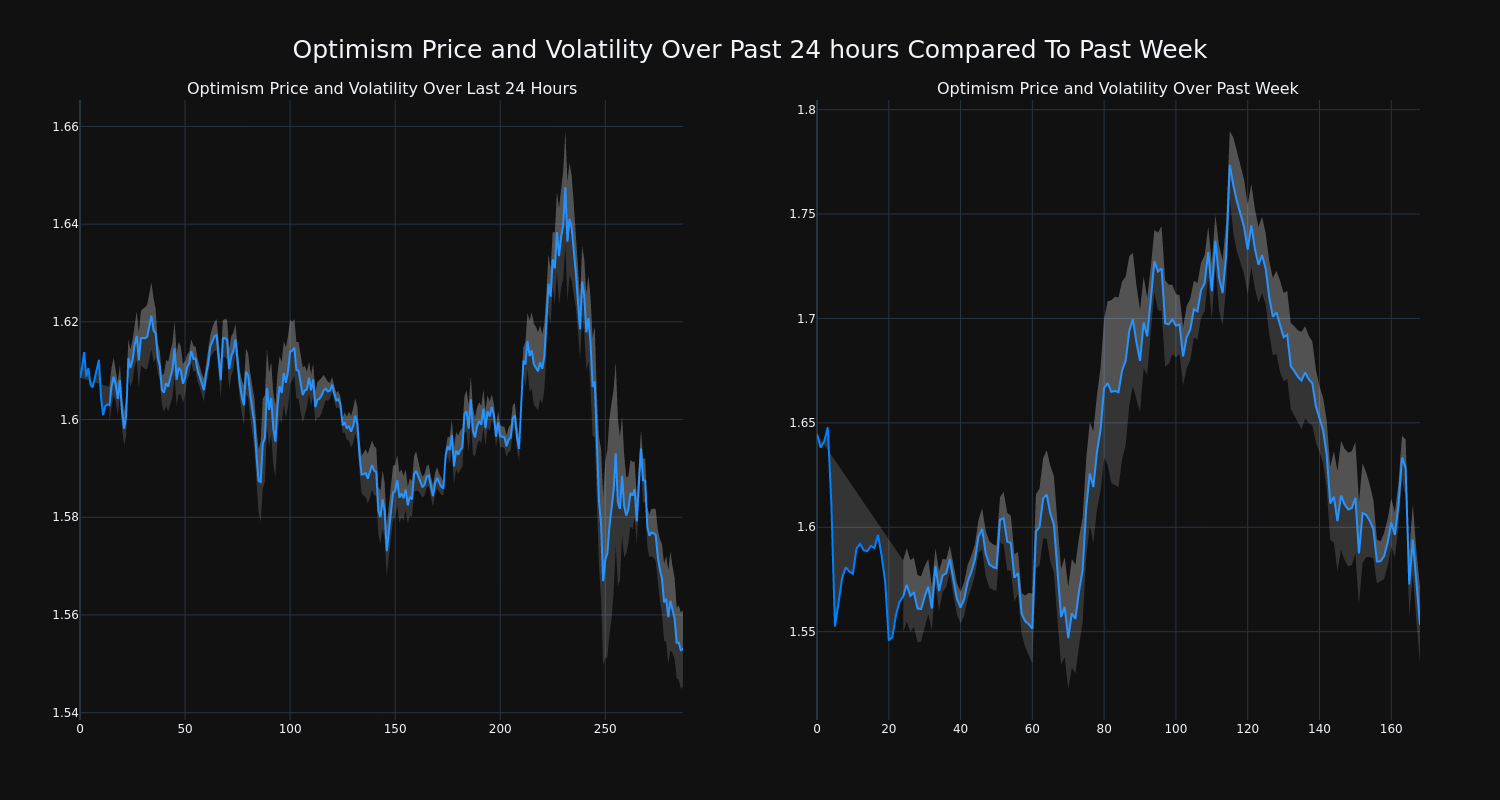
Over the past 24 hours, Optimism’s OP/USD price has fallen 3.44% to $1.55. This continues its negative trend over the past week where it has experienced a 6.0% loss, moving from $1.64 to its current price.
The chart below compares the price movement and volatility for Optimism over the past 24 hours (left) to its price movement over the past week (right). The gray bands are Bollinger Bands, measuring the volatility for both the daily and weekly price movements. The wider the bands are, or the larger the gray area is at any given moment, the larger the volatility.
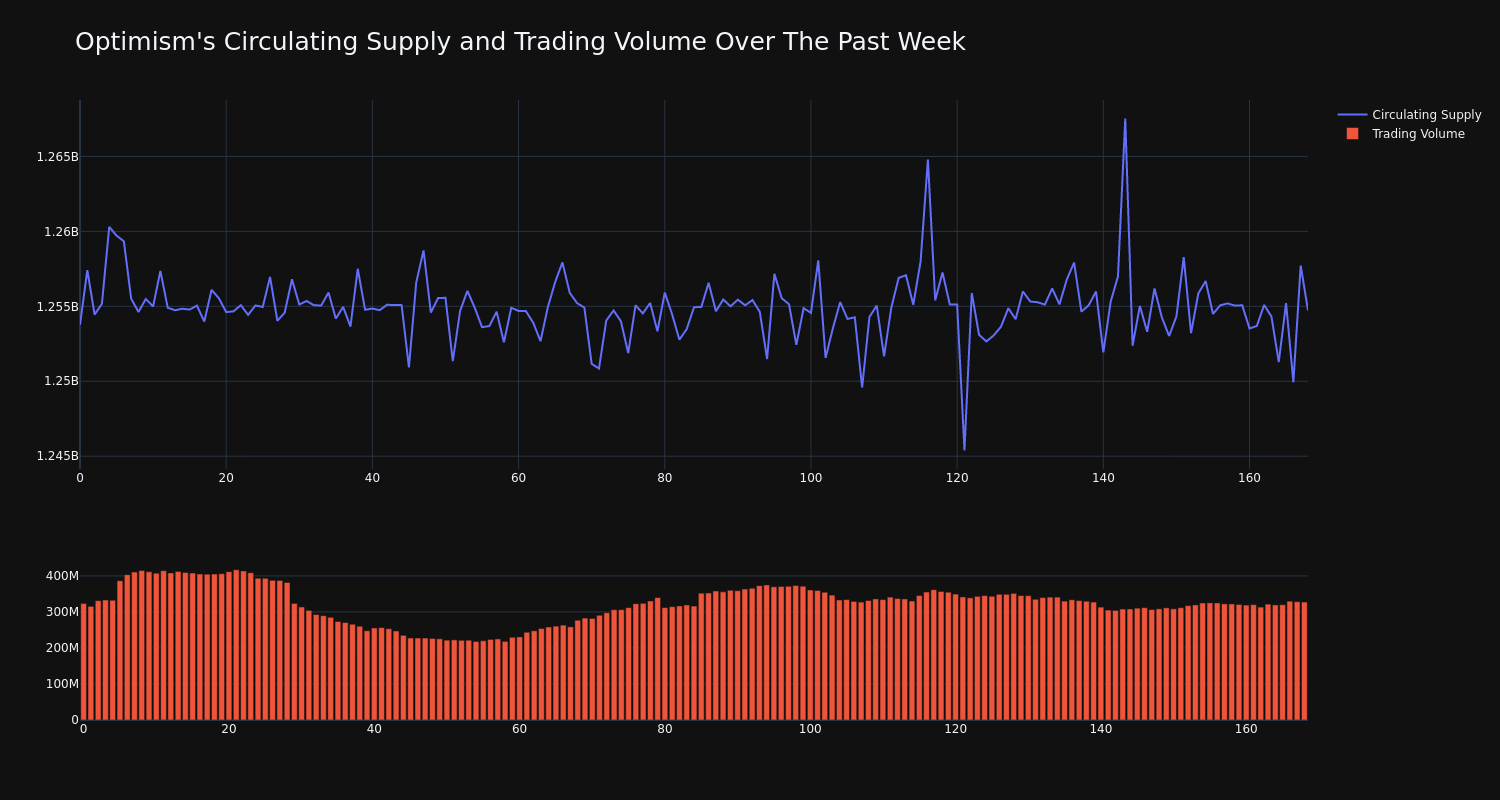
Optimism’s trading volume has climbed 1.0% over the past week along with the circulating supply of the coin, which has increased 0.08%. This brings the circulating supply to 1.26 billion, which makes up an estimated 29.22% of its max supply of 4.29 billion. According to our data, the current market cap ranking for OP is #49 at $1.95 billion.
This article was generated by Benzinga’s automated content engine and reviewed by an editor.
Market News and Data brought to you by Benzinga APIs
© 2024 Benzinga.com. Benzinga does not provide investment advice. All rights reserved.

