A Look Ahead: Ambarella's Earnings Forecast
Ambarella AMBA is gearing up to announce its quarterly earnings on Tuesday, 2024-11-26. Here’s a quick overview of what investors should know before the release.
Analysts are estimating that Ambarella will report an earnings per share (EPS) of $0.04.
The market awaits Ambarella’s announcement, with hopes high for news of surpassing estimates and providing upbeat guidance for the next quarter.
It’s important for new investors to understand that guidance can be a significant driver of stock prices.
Past Earnings Performance
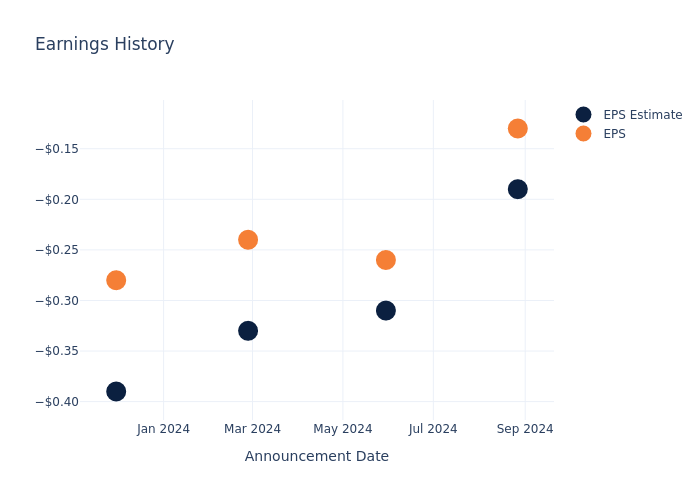
Last quarter the company beat EPS by $0.06, which was followed by a 10.63% increase in the share price the next day.
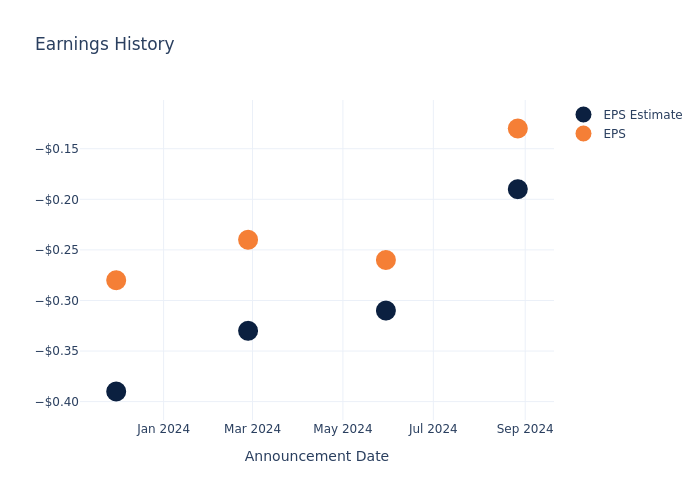
Here’s a look at Ambarella’s past performance and the resulting price change:
| Quarter | Q2 2025 | Q1 2025 | Q4 2024 | Q3 2024 |
|---|---|---|---|---|
| EPS Estimate | -0.19 | -0.31 | -0.33 | -0.39 |
| EPS Actual | -0.13 | -0.26 | -0.24 | -0.28 |
| Price Change % | 11.0% | 21.0% | 0.0% | -0.0% |
Market Performance of Ambarella’s Stock
Shares of Ambarella were trading at $63.62 as of November 22. Over the last 52-week period, shares are up 19.48%. Given that these returns are generally positive, long-term shareholders are likely bullish going into this earnings release.
Analyst Observations about Ambarella
For investors, staying informed about market sentiments and expectations in the industry is paramount. This analysis provides an exploration of the latest insights on Ambarella.
The consensus rating for Ambarella is Buy, derived from 9 analyst ratings. An average one-year price target of $75.0 implies a potential 17.89% upside.
Analyzing Ratings Among Peers
The analysis below examines the analyst ratings and average 1-year price targets of Diodes, Synaptics and Silicon Laboratories, three significant industry players, providing valuable insights into their relative performance expectations and market positioning.
- Diodes is maintaining an Buy status according to analysts, with an average 1-year price target of $68.5, indicating a potential 7.67% upside.
- Analysts currently favor an Buy trajectory for Synaptics, with an average 1-year price target of $101.75, suggesting a potential 59.93% upside.
- The consensus outlook from analysts is an Neutral trajectory for Silicon Laboratories, with an average 1-year price target of $111.4, indicating a potential 75.1% upside.
Key Findings: Peer Analysis Summary
The peer analysis summary provides a snapshot of key metrics for Diodes, Synaptics and Silicon Laboratories, illuminating their respective standings within the industry. These metrics offer valuable insights into their market positions and comparative performance.
| Company | Consensus | Revenue Growth | Gross Profit | Return on Equity |
|---|---|---|---|---|
| Ambarella | Buy | 2.58% | $38.74M | -6.33% |
| Diodes | Buy | -13.49% | $118.01M | 0.77% |
| Synaptics | Buy | 8.41% | $120.90M | -1.57% |
| Silicon Laboratories | Neutral | -18.34% | $90.31M | -2.62% |
Key Takeaway:
Ambarella is positioned at the top for Revenue Growth with 2.58%. It is at the bottom for Gross Profit with $38.74M. Ambarella is at the bottom for Return on Equity with -6.33%.
All You Need to Know About Ambarella
Ambarella Inc is a developer of semiconductor processing solutions for high-definition video capture, sharing, and display. The firm’s solutions are sold to original design manufacturers and original equipment manufacturers to be designed for use in infrastructure broadcast encoders, wearable device cameras, automotive cameras, and security cameras. Ambarella’s system-on-a-chip designs, based on its proprietary technology platform, are highly configurable to applications in various end markets. Geographical presence in Taiwan, Asia Pacific, Europe, North America, and the United States. The firm derives the majority of its revenue from Taiwan.
Ambarella’s Economic Impact: An Analysis
Market Capitalization Analysis: The company exhibits a lower market capitalization profile, positioning itself below industry averages. This suggests a smaller scale relative to peers.
Revenue Growth: Ambarella displayed positive results in 3 months. As of 31 July, 2024, the company achieved a solid revenue growth rate of approximately 2.58%. This indicates a notable increase in the company’s top-line earnings. As compared to competitors, the company surpassed expectations with a growth rate higher than the average among peers in the Information Technology sector.
Net Margin: Ambarella’s net margin is below industry standards, pointing towards difficulties in achieving strong profitability. With a net margin of -54.75%, the company may encounter challenges in effective cost control.
Return on Equity (ROE): Ambarella’s ROE falls below industry averages, indicating challenges in efficiently using equity capital. With an ROE of -6.33%, the company may face hurdles in generating optimal returns for shareholders.
Return on Assets (ROA): Ambarella’s ROA is below industry standards, pointing towards difficulties in efficiently utilizing assets. With an ROA of -5.41%, the company may encounter challenges in delivering satisfactory returns from its assets.
Debt Management: Ambarella’s debt-to-equity ratio is below the industry average at 0.01, reflecting a lower dependency on debt financing and a more conservative financial approach.
To track all earnings releases for Ambarella visit their earnings calendar on our site.
This article was generated by Benzinga’s automated content engine and reviewed by an editor.
© 2024 Benzinga.com. Benzinga does not provide investment advice. All rights reserved.
Industry Comparison: Evaluating Amazon.com Against Competitors In Broadline Retail Industry
In today’s rapidly changing and highly competitive business world, it is vital for investors and industry enthusiasts to carefully assess companies. In this article, we will perform a comprehensive industry comparison, evaluating Amazon.com AMZN against its key competitors in the Broadline Retail industry. By analyzing important financial metrics, market position, and growth prospects, we aim to provide valuable insights for investors and shed light on company’s performance within the industry.
Amazon.com Background
Amazon is the leading online retailer and marketplace for third party sellers. Retail related revenue represents approximately 75% of total, followed by Amazon Web Services’ cloud computing, storage, database, and other offerings (15%), advertising services (5% to 10%), and other the remainder. International segments constitute 25% to 30% of Amazon’s non-AWS sales, led by Germany, the United Kingdom, and Japan.
| Company | P/E | P/B | P/S | ROE | EBITDA (in billions) | Gross Profit (in billions) | Revenue Growth |
|---|---|---|---|---|---|---|---|
| Amazon.com Inc | 42.12 | 8 | 3.40 | 6.19% | $32.08 | $31.0 | 11.04% |
| Alibaba Group Holding Ltd | 17.09 | 1.51 | 1.55 | 4.64% | $54.02 | $92.47 | 5.21% |
| PDD Holdings Inc | 9.85 | 3.61 | 2.86 | 9.38% | $29.18 | $59.65 | 44.33% |
| MercadoLibre Inc | 71.12 | 25.40 | 5.56 | 10.37% | $0.72 | $2.44 | 35.27% |
| JD.com Inc | 11.14 | 1.59 | 0.35 | 5.22% | $15.92 | $45.04 | 5.12% |
| Coupang Inc | 42.75 | 10.44 | 1.51 | 1.74% | $0.28 | $2.27 | 27.2% |
| eBay Inc | 15.93 | 5.59 | 3.14 | 11.59% | $0.95 | $1.85 | 3.04% |
| Vipshop Holdings Ltd | 6.30 | 1.31 | 0.47 | 2.76% | $1.47 | $4.96 | -9.18% |
| Dillard’s Inc | 11.51 | 3.61 | 1.08 | 6.37% | $0.15 | $0.58 | -4.19% |
| Ollie’s Bargain Outlet Holdings Inc | 28.84 | 3.65 | 2.64 | 3.14% | $0.08 | $0.22 | 12.41% |
| MINISO Group Holding Ltd | 16.76 | 3.89 | 2.73 | 6.26% | $0.79 | $1.77 | 24.08% |
| Macy’s Inc | 25.08 | 1.05 | 0.19 | 3.53% | $0.44 | $2.16 | -3.48% |
| Nordstrom Inc | 13.43 | 4.03 | 0.26 | 13.68% | $0.4 | $1.49 | 3.23% |
| Kohl’s Corp | 6.68 | 0.49 | 0.11 | 1.73% | $0.35 | $1.6 | -4.18% |
| Savers Value Village Inc | 19.85 | 3.37 | 1 | 5.09% | $0.07 | $0.22 | 0.53% |
| Groupon Inc | 13.51 | 9.27 | 0.69 | 34.72% | $0.03 | $0.1 | -9.48% |
| Average | 20.66 | 5.25 | 1.61 | 8.01% | $6.99 | $14.45 | 8.66% |
By analyzing Amazon.com, we can infer the following trends:
-
The current Price to Earnings ratio of 42.12 is 2.04x higher than the industry average, indicating the stock is priced at a premium level according to the market sentiment.
-
The elevated Price to Book ratio of 8.0 relative to the industry average by 1.52x suggests company might be overvalued based on its book value.
-
The Price to Sales ratio of 3.4, which is 2.11x the industry average, suggests the stock could potentially be overvalued in relation to its sales performance compared to its peers.
-
With a Return on Equity (ROE) of 6.19% that is 1.82% below the industry average, it appears that the company exhibits potential inefficiency in utilizing equity to generate profits.
-
The company exhibits higher Earnings Before Interest, Taxes, Depreciation, and Amortization (EBITDA) of $32.08 Billion, which is 4.59x above the industry average, implying stronger profitability and robust cash flow generation.
-
The gross profit of $31.0 Billion is 2.15x above that of its industry, highlighting stronger profitability and higher earnings from its core operations.
-
The company’s revenue growth of 11.04% is notably higher compared to the industry average of 8.66%, showcasing exceptional sales performance and strong demand for its products or services.
Debt To Equity Ratio
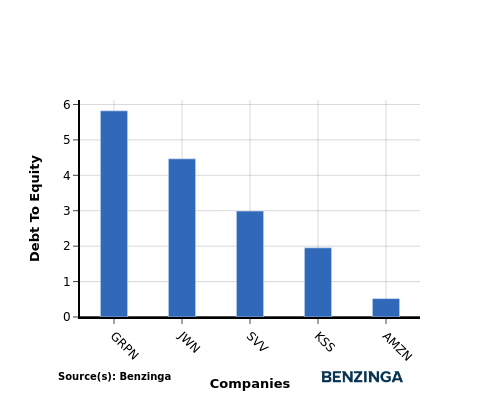
The debt-to-equity (D/E) ratio assesses the extent to which a company relies on borrowed funds compared to its equity.
Considering the debt-to-equity ratio in industry comparisons allows for a concise evaluation of a company’s financial health and risk profile, aiding in informed decision-making.
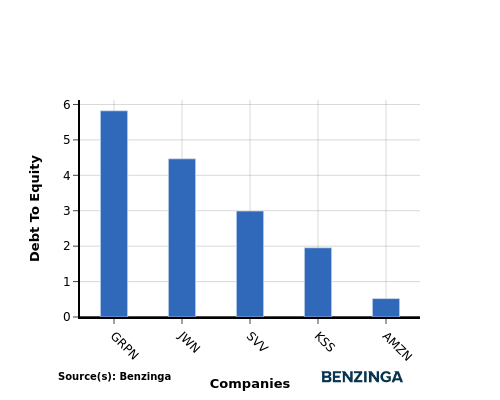
When assessing Amazon.com against its top 4 peers using the Debt-to-Equity ratio, the following comparisons can be made:
-
Amazon.com is in a relatively stronger financial position compared to its top 4 peers, as evidenced by its lower debt-to-equity ratio of 0.52.
-
This implies that the company relies less on debt financing and has a more favorable balance between debt and equity.
Key Takeaways
For Amazon.com, the PE, PB, and PS ratios are all high compared to its peers in the Broadline Retail industry, indicating that the stock may be overvalued. The low ROE suggests that Amazon.com is not generating significant returns on shareholder equity. However, the high EBITDA, gross profit, and revenue growth show that the company is performing well in terms of operational efficiency and revenue generation compared to its industry peers.
This article was generated by Benzinga’s automated content engine and reviewed by an editor.
Market News and Data brought to you by Benzinga APIs
© 2024 Benzinga.com. Benzinga does not provide investment advice. All rights reserved.
Billionaire Ray Dalio Sold Nvidia Stock. Should You Follow?
Investors get a peek into what hedge funds are doing with their money every quarter. The SEC requires institutional investors to file a 13F once they pass $100 million in assets. These reports are released 45 days after the end of the calendar quarter and disclose current positions.
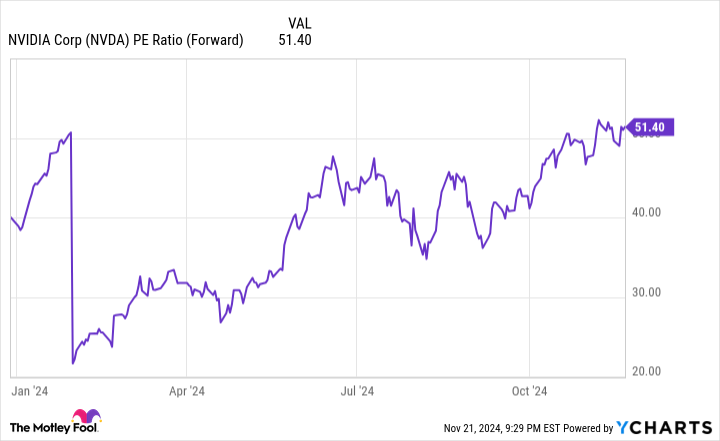
Billionaire hedge fund manager Ray Dalio and his firm Bridgewater Associates made an interesting move during the third quarter. They sold Nvidia (NASDAQ: NVDA) stock. They reduced their position sizing by about a quarter, selling 1.8 million shares, worth around $212 million if the average price for Q3 is used.
Are You Missing The Morning Scoop? Breakfast News delivers it all in a quick, Foolish, and free daily newsletter. Sign Up For Free »
Should investors follow in Dalio’s footsteps and sell off some of their Nvidia positions? Or is this move being made for different reasons?
Bridgewater Associates’ trend of selling Nvidia stock isn’t isolated to just the third quarter. The firm owned more than seven million Nvidia shares at the end of 2023 and have steadily decreased their holdings each quarter of 2024. This activity is fairly common for hedge funds: They want to realize gains.
Unlike individual investors who can watch their portfolios rise and fall with little repercussions, fund managers are graded on their quarterly performance. Individual investors can buy great companies and hold until they’re no longer great, with little care of day-to-day movements. This strategy has made the Foolish style of investing successful, but it doesn’t work for fund managers.
However, it does remind us that gains aren’t realized until you actually sell the stock, which can be difficult when all Nvidia seems to do is go up. Still, even after the sales, Nvidia is Bridgewater’s fourth-largest holding. So, Dalio and his firm are trimming a stock that has continued to run so that they are comfortable with the position sizing.
Many investors should consider this, too, as Nvidia has been on a legendary run over the past two years. Nvidia’s stock won’t keep going up in a near-straight line forever, and realizing some of the gains may not be the worst idea, even if Nvidia continues to excel.
Although I don’t know when it will happen, Nvidia is going to run into some headwinds eventually. Nvidia’s graphics processing units (GPUs) are powering the artificial intelligence (AI) arms race, and companies are buying them by the truckload to give themselves all the computing power they need to train the best model possible.
Insights into Kohl's's Upcoming Earnings
Kohl’s KSS is gearing up to announce its quarterly earnings on Tuesday, 2024-11-26. Here’s a quick overview of what investors should know before the release.
Analysts are estimating that Kohl’s will report an earnings per share (EPS) of $0.31.
Investors in Kohl’s are eagerly awaiting the company’s announcement, hoping for news of surpassing estimates and positive guidance for the next quarter.
It’s worth noting for new investors that stock prices can be heavily influenced by future projections rather than just past performance.
Performance in Previous Earnings
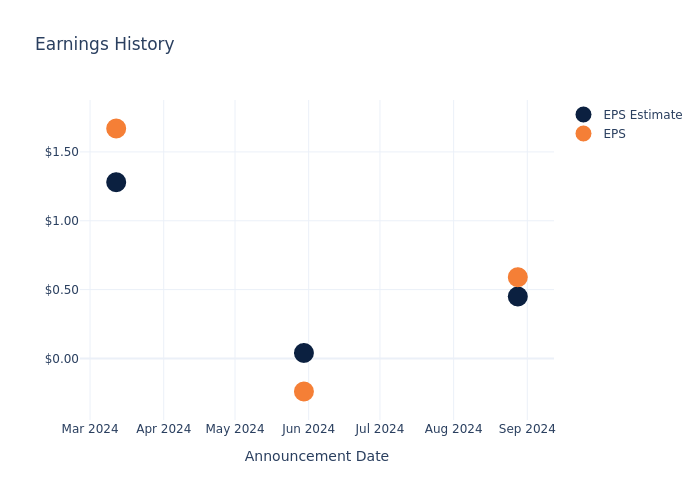
During the last quarter, the company reported an EPS beat by $0.14, leading to a 0.61% increase in the share price on the subsequent day.
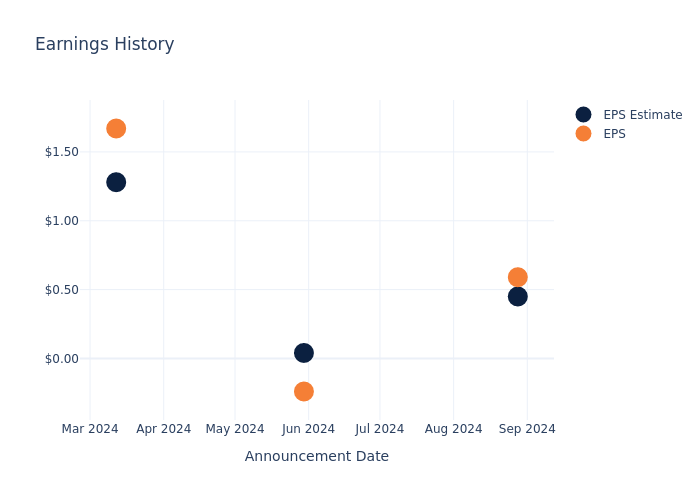
Here’s a look at Kohl’s’s past performance and the resulting price change:
| Quarter | Q2 2024 | Q1 2024 | Q4 2023 | Q3 2023 |
|---|---|---|---|---|
| EPS Estimate | 0.45 | 0.04 | 1.28 | 0.33 |
| EPS Actual | 0.59 | -0.24 | 1.67 | 0.53 |
| Price Change % | 1.0% | 7.000000000000001% | -0.0% | 2.0% |
Kohl’s Share Price Analysis
Shares of Kohl’s were trading at $17.03 as of November 22. Over the last 52-week period, shares are down 27.62%. Given that these returns are generally negative, long-term shareholders are likely unhappy going into this earnings release.
Analyst Views on Kohl’s
For investors, grasping market sentiments and expectations in the industry is vital. This analysis explores the latest insights regarding Kohl’s.
Analysts have provided Kohl’s with 6 ratings, resulting in a consensus rating of Neutral. The average one-year price target stands at $21.0, suggesting a potential 23.31% upside.
Comparing Ratings with Peers
In this comparison, we explore the analyst ratings and average 1-year price targets of and Savers Value Village, three prominent industry players, offering insights into their relative performance expectations and market positioning.
- Savers Value Village received a Neutral consensus from analysts, with an average 1-year price target of $10.0, implying a potential 41.28% downside.
Peer Analysis Summary
The peer analysis summary presents essential metrics for and Savers Value Village, unveiling their respective standings within the industry and providing valuable insights into their market positions and comparative performance.
| Company | Consensus | Revenue Growth | Gross Profit | Return on Equity |
|---|---|---|---|---|
| Kohl’s | Neutral | -4.18% | $1.60B | 1.73% |
| Savers Value Village | Neutral | 0.53% | $224.02M | 5.09% |
Key Takeaway:
Kohl’s ranks higher than its peers in terms of revenue growth, with a negative growth rate compared to a positive growth rate for its peers. However, it lags behind in gross profit, with a lower figure compared to its peers. In return on equity, Kohl’s also falls short, with a lower percentage compared to its peers. Overall, Kohl’s is positioned in the middle among its peers based on these metrics.
All You Need to Know About Kohl’s
Kohl’s operates about 1,176 department stores in 49 states that sell moderately priced private-label and national brand clothing, shoes, accessories, cosmetics, and home furnishings. Most of these stores are in strip centers. Kohl’s also operates a large digital sales business. Women’s apparel is Kohl’s largest category, having generated 26% of its 2023 sales. The retailer, headquartered in Menomonee Falls, Wisconsin, opened its first department store in 1962.
Kohl’s: Delving into Financials
Market Capitalization Analysis: Falling below industry benchmarks, the company’s market capitalization reflects a reduced size compared to peers. This positioning may be influenced by factors such as growth expectations or operational capacity.
Negative Revenue Trend: Examining Kohl’s’s financials over 3 months reveals challenges. As of 31 July, 2024, the company experienced a decline of approximately -4.18% in revenue growth, reflecting a decrease in top-line earnings. As compared to its peers, the revenue growth lags behind its industry peers. The company achieved a growth rate lower than the average among peers in Consumer Discretionary sector.
Net Margin: The company’s net margin is below industry benchmarks, signaling potential difficulties in achieving strong profitability. With a net margin of 1.77%, the company may need to address challenges in effective cost control.
Return on Equity (ROE): The company’s ROE is below industry benchmarks, signaling potential difficulties in efficiently using equity capital. With an ROE of 1.73%, the company may need to address challenges in generating satisfactory returns for shareholders.
Return on Assets (ROA): Kohl’s’s ROA falls below industry averages, indicating challenges in efficiently utilizing assets. With an ROA of 0.46%, the company may face hurdles in generating optimal returns from its assets.
Debt Management: With a below-average debt-to-equity ratio of 1.95, Kohl’s adopts a prudent financial strategy, indicating a balanced approach to debt management.
To track all earnings releases for Kohl’s visit their earnings calendar on our site.
This article was generated by Benzinga’s automated content engine and reviewed by an editor.
© 2024 Benzinga.com. Benzinga does not provide investment advice. All rights reserved.
More Paid Holidays For Cannabis Workers At Zen Leaf Dispensary Through Agreement With Teamsters
Cannabis advisors and agents-in-charge at the Zen Leaf cannabis dispensary in Evanston, Illinois unanimously ratified their first collective bargaining agreement with Teamsters Local 777. Zen Leaf is a subsidiary of the multi-state operator Verano Holdings VRNOF.
“We successfully negotiated and ratified this collective bargaining agreement in less than three months, which is probably the fastest turnaround we’ve had for a first contract in this industry,” stated Jim Glimco, president of Local 777. “We’re organizing and winning contracts faster than ever before because everyone in this field recognizes we’re a force to be reckoned with. Congratulations to all of the workers who stuck together to demand a contract with the same high standards we’ve secured for other multi-state cannabis operators in Illinois.”
Read Also: Illinois Launches Cannabis Research Institute With $7M In Funding
Get Benzinga’s exclusive analysis and the top news about the cannabis industry and markets daily in your inbox for free. Subscribe to our newsletter here. If you’re serious about the business, you can’t afford to miss out.
The three-year contract includes a number of changes including more paid holidays, a minimum 14% wage increase over the lifetime of the agreement, due process during disciplinary matters, and a guarantee that a successor employer will assume the contract if another company buys the dispensary. Workers also receive retirement benefits, something that is only available to union members at the company.
“Cannabis workers are organizing and bargaining better contracts faster because they know a Teamsters contract brings stability to their jobs and respect from the industry for the work they do,” said Jesse Case, Teamsters food processing division director.
The news comes after workers at PharmaCann, one of the largest vertically integrated cannabis companies in the U.S., joined Teamsters Local 337 following an overwhelming unionization vote at the company’s Michigan facility.
In recent years, Teamsters have worked to unionize workers in the emerging cannabis industry. Efforts included the Cannabist Company CBSTF in California, Cresco Labs CRLBF in Illinois, Grassdoor in California, Nabis in California and Verano Holdings inChicago.
Read Next:
Photo: Benzinga edit with images by lexandros Michailidisand Oleksandrum via Shutterstock
Market News and Data brought to you by Benzinga APIs
© 2024 Benzinga.com. Benzinga does not provide investment advice. All rights reserved.
Cannabis is evolving – don’t get left behind!
Curious about what’s next for the industry and how to leverage California’s unique market?
Join top executives, policymakers, and investors at the Benzinga Cannabis Market Spotlight in Anaheim, CA, at the House of Blues on November 12. Dive deep into the latest strategies, investment trends, and brand insights that are shaping the future of cannabis!
Get your tickets now to secure your spot and avoid last-minute price hikes.
Decoding Boeing's Options Activity: What's the Big Picture?
Investors with a lot of money to spend have taken a bullish stance on Boeing BA.
And retail traders should know.
We noticed this today when the positions showed up on publicly available options history that we track here at Benzinga.
Whether these are institutions or just wealthy individuals, we don’t know. But when something this big happens with BA, it often means somebody knows something is about to happen.
Today, Benzinga’s options scanner spotted 8 options trades for Boeing.
This isn’t normal.
The overall sentiment of these big-money traders is split between 50% bullish and 50%, bearish.
Out of all of the options we uncovered, there was 1 put, for a total amount of $102,820, and 7, calls, for a total amount of $570,701.
Expected Price Movements
Based on the trading activity, it appears that the significant investors are aiming for a price territory stretching from $125.0 to $160.0 for Boeing over the recent three months.
Analyzing Volume & Open Interest
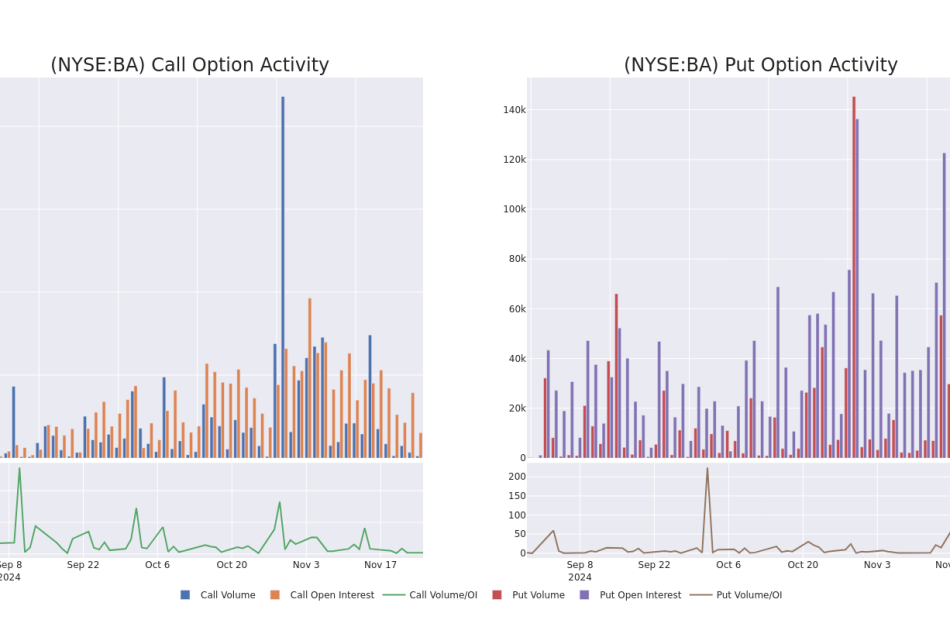
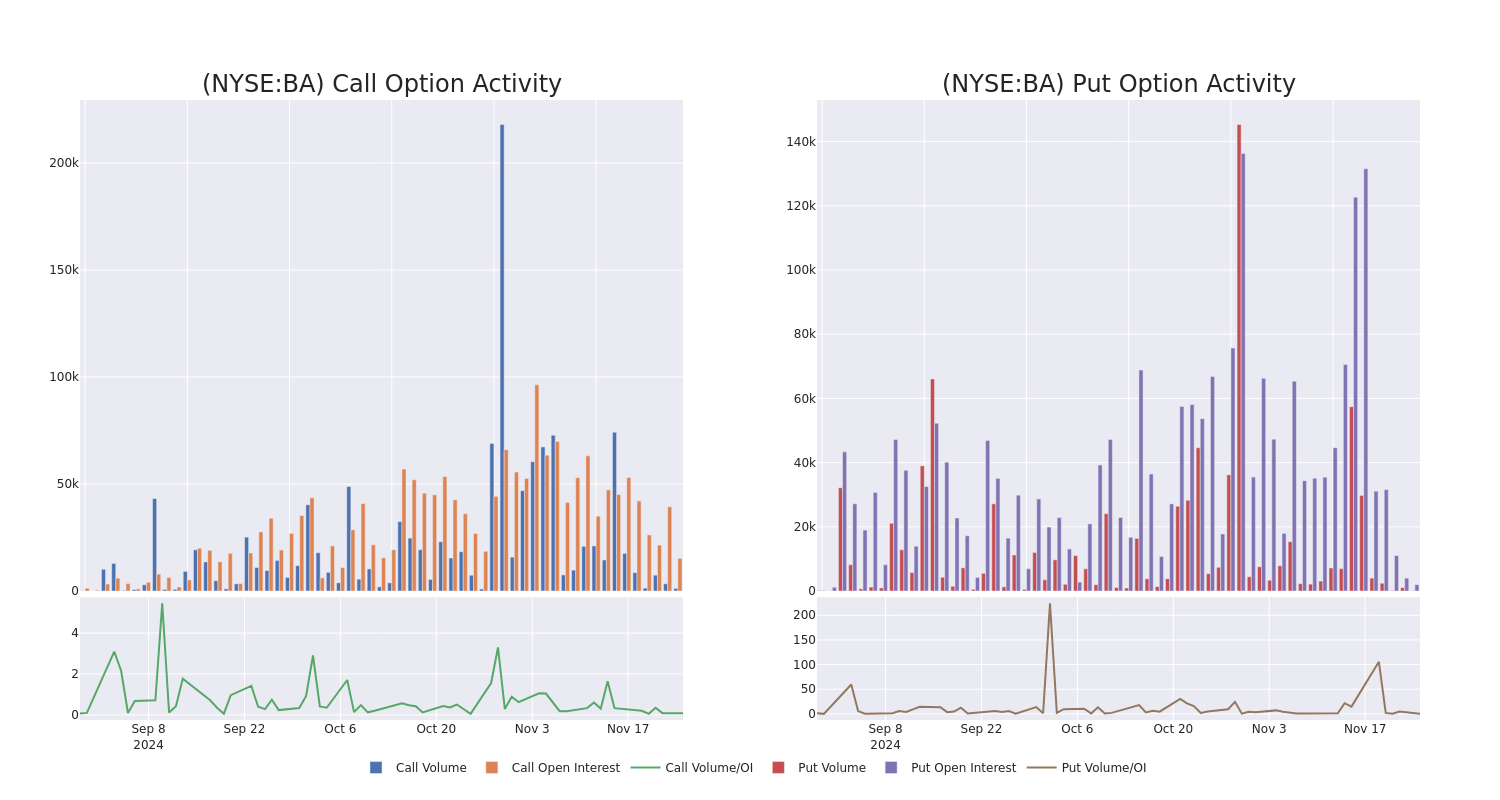
Looking at the volume and open interest is a powerful move while trading options. This data can help you track the liquidity and interest for Boeing’s options for a given strike price. Below, we can observe the evolution of the volume and open interest of calls and puts, respectively, for all of Boeing’s whale trades within a strike price range from $125.0 to $160.0 in the last 30 days.
Boeing Call and Put Volume: 30-Day Overview
Noteworthy Options Activity:
| Symbol | PUT/CALL | Trade Type | Sentiment | Exp. Date | Ask | Bid | Price | Strike Price | Total Trade Price | Open Interest | Volume |
|---|---|---|---|---|---|---|---|---|---|---|---|
| BA | CALL | TRADE | BULLISH | 12/19/25 | $28.3 | $26.65 | $28.3 | $150.00 | $141.5K | 1.0K | 202 |
| BA | CALL | SWEEP | BEARISH | 12/19/25 | $29.1 | $28.1 | $28.1 | $150.00 | $140.5K | 1.0K | 202 |
| BA | PUT | SWEEP | BULLISH | 12/20/24 | $11.7 | $10.55 | $10.6 | $160.00 | $102.8K | 1.9K | 129 |
| BA | CALL | TRADE | BULLISH | 04/17/25 | $33.85 | $33.65 | $33.85 | $125.00 | $84.6K | 44 | 25 |
| BA | CALL | SWEEP | BEARISH | 12/06/24 | $3.8 | $3.75 | $3.75 | $150.00 | $75.0K | 2.0K | 7 |
About Boeing
Boeing is a major aerospace and defense firm. It operates in three segments: commercial airplanes; defense, space, and security; and Global services. Boeing’s commercial airplanes segment competes with Airbus in the production of aircraft that can carry more than 130 passengers. Boeing’s defense, space, and security segment competes with Lockheed, Northrop, and several other firms to create military aircraft, satellites, and weaponry. Global services provides aftermarket support to airlines.
Following our analysis of the options activities associated with Boeing, we pivot to a closer look at the company’s own performance.
Present Market Standing of Boeing
- Currently trading with a volume of 357,062, the BA’s price is up by 1.43%, now at $151.43.
- RSI readings suggest the stock is currently may be approaching overbought.
- Anticipated earnings release is in 65 days.
What The Experts Say On Boeing
A total of 4 professional analysts have given their take on this stock in the last 30 days, setting an average price target of $161.0.
Turn $1000 into $1270 in just 20 days?
20-year pro options trader reveals his one-line chart technique that shows when to buy and sell. Copy his trades, which have had averaged a 27% profit every 20 days. Click here for access.
* An analyst from RBC Capital has revised its rating downward to Outperform, adjusting the price target to $200.
* Consistent in their evaluation, an analyst from Wells Fargo keeps a Underweight rating on Boeing with a target price of $85.
* An analyst from Bernstein downgraded its action to Market Perform with a price target of $169.
* An analyst from JP Morgan has decided to maintain their Overweight rating on Boeing, which currently sits at a price target of $190.
Options are a riskier asset compared to just trading the stock, but they have higher profit potential. Serious options traders manage this risk by educating themselves daily, scaling in and out of trades, following more than one indicator, and following the markets closely.
If you want to stay updated on the latest options trades for Boeing, Benzinga Pro gives you real-time options trades alerts.
Market News and Data brought to you by Benzinga APIs
© 2024 Benzinga.com. Benzinga does not provide investment advice. All rights reserved.
EMD-Batimo Group celebrates 30 years of innovation and excellence in the construction and real estate industry
Company renews its commitment to diversified housing solutions, technological innovation and sustainability best practices
MONTRÉAL, Nov. 25, 2024 /CNW/ – EMD-Batimo Group, a leader in Québec’s construction and real estate industry, is proud to celebrate its 30th anniversary this year. The company, founded in 1994 by Marc Dubuc, with Francis Charron joining early on, has long stood out for its vertically integrated, innovative approach, with a portfolio of more than 60 residential projects that today represents some $3.2 billion in property value. Earlier this year, EMD-Batimo reached the milestone figure of 10 000 housing units built or under development, including multi-residential complexes and retirement residences, as well as social and affordable housing.
“We are extremely proud, as a company, of how far we’ve come over the last 30 years,” says Francis Charron, President, EMD-Batimo Group. “Our success is built on our capacity to anticipate market needs, to continually innovate, and forge strong relationships with partners and clients. We are more committed than ever to developing housing solutions of the highest quality, while embracing best practices in sustainability to meet the challenges of the future.” He adds: “We look forward to the next steps in our growth journey and to helping deliver sustainable and affordable housing. With Québec facing a housing deficit of the order of 860 000 units to be built by 2030, we are determined to play a leading role in fulfilling that vital need.”
The company’s vertically integrated structure, whereby it combines the roles of developer, builder and operator, gives it complete control over projects while optimizing returns and minimizing risk. This approach enables EMD-Batimo to cater precisely to its customers’ needs, creating distinctive living environments adapted to the communities it serves, while ensuring exceptional standards of quality at every stage.
Strategic partnerships consolidating recognized expertise
Over the years, EMD-Batimo has surrounded itself with financial and institutional partners with thorough knowledge of the industry, enabling it to successfully complete large-scale projects. These partnerships have helped it strengthen its leadership position and expand into new areas. This year, for example, marks the 10th anniversary of the company’s partnership with Chartwell. Together, the two organizations have completed 15 projects with a total of 4 025 units and a market value of $1.1 billion.
Steering growth through a commitment to innovation and sustainability
EMD-Batimo stands out as a pioneer thanks to its data-driven approach, which delivers in-depth predictive market analyses and incorporates artificial intelligence (AI) technologies in decision-making processes. Thanks to this strategy, the company can optimize every step in the project process, from design to operation, minimizing risks and maximizing returns.
“Bringing AI into the construction equation means we can make more informed decisions based on data,” explains Marc Dubuc, President, EMD Construction. “By optimizing design, handling energy simulations and making project analyses easier, AI is enhancing our efficiency while enriching the work that our people do.”
Embracing ESG principles
EMD-Batimo has pledged to adhere to environmental, social and governance (ESG) standards. By adopting sustainability best practices, the company is reducing its carbon footprint and improving the energy efficiency of its projects, and in so doing helping to build more resilient and inclusive communities.
Future outlook
Over the next ten years, the company intends to continue its expansion, notably in Ontario, targeting completion of 2 000 new housing units annually. It is leveraging its data-driven approach to tackle industry challenges and meet the pressing need for housing in Canada. Twenty years ago, EMD-Batimo developed a turnkey concept for construction of some 50 daycare centres, meeting budgets and deadlines. Today, it is applying that same approach to build affordable housing, responding to a critical need.
About EMD-Batimo Group
EMD-Batimo has been a leading player in the Québec construction and real estate industry since 1994, specializing in multi-residential complexes (conventional and 55+) and retirement residences as well as social and affordable housing. Attentive to the needs of its customers, the group offers them unique, distinctive products that meet their needs. With more than 10 000 units built or under development, EMD-Batimo stands out for its vertical integration, the use of AI, and its commitment to responsible ESG practices.
SOURCE EMD-Batimo

![]() View original content to download multimedia: http://www.newswire.ca/en/releases/archive/November2024/25/c2601.html
View original content to download multimedia: http://www.newswire.ca/en/releases/archive/November2024/25/c2601.html
© 2024 Benzinga.com. Benzinga does not provide investment advice. All rights reserved.
MicroStrategy spends $5.4 billion buying another 55,000 bitcoins, stock slips
MicroStrategy (MSTR) said Monday it purchased another 55,000 bitcoins (BTC-USD) last week for $5.4 billion as the world’s largest cryptocurrency was trading at all-time highs.
Shares of the company were trading on both sides of the flat line following the news, gaining as much as 2% before falling more than 2% in early trade.
In a filing with the SEC, MicroStrategy said it spent $5.4 billion to acquire these bitcoins between Nov. 18 and Nov. 24, buying the bitcoin at an average price of $97,862.
The company said it used proceeds from convertible notes and share sales to fund the purchase.
The application software company, which has become a bitcoin proxy, has been buying tokens since 2020.
In recent weeks, it has intensified its purchases as bitcoin has rallied to highs above $99,000 following Donald Trump’s presidential win earlier this month.
The company’s prior weekly purchase included 51,780 bitcoins for an average price of just over $88,500 per token.
As of Sunday, MicroStrategy held approximately 386,700 bitcoins, acquired for an aggregate purchase price of about $21.9 billion and an average purchase price of approximately $56,761 per bitcoin.
MicroStrategy stock has been on a wild run this year, up more than 515% year to date, though shares fell over 15% last week after short seller Citron Research said they were betting against the stock.
The short seller said in an X post that while the firm remains bullish on bitcoin — and was bullish on MicroStrategy’s bitcoin play years ago — the company’s stock has “completely detached from BTC fundamentals.”
Wall Street analysts, however, have been increasingly bullish on the stock given bitcoin’s run and where bulls say it could be headed.
Bitcoin has been flirting with $100,000 since last Friday, reaching highs of more than $99,400.
Read more: Bitcoin clears another record: Is this a good time to invest?
Analysts at Bernstein raised their price target on the stock to $600 from $290, while Benchmark raised its target to a Street high of $640, up from $450.
In an interview on Yahoo Finance’s Opening Bid podcast, Benchmark’s Mark Palmer said, “We assume in our analysis of MicroStrategy, that the price of bitcoin will reach $225,000 by the end of 2026.”
Ines Ferre is a senior business reporter for Yahoo Finance. Follow her on X at @ines_ferre.
Click here for in-depth analysis of the latest stock market news and events moving stock prices
Cannara Biotech Inc. Reports Q4 and Fiscal Year 2024 Results: Achieves Record Sales Growth and Operating Cash Flow, Solidifying Leadership in Canada's Cannabis Market
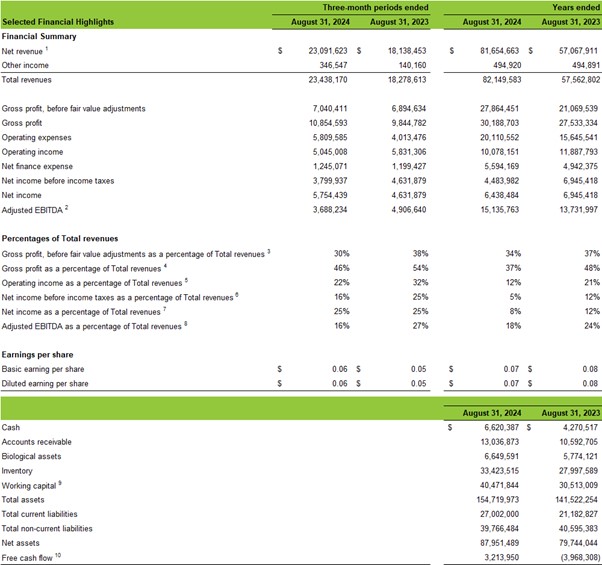
- Record Q4 and year-end total revenues of $23.4 million and $82.2 million, representing a 28% and 43% increase compared to the same periods in 2023.
- Robust growth in Q4 over Q3 2024, with total revenues increasing by 20%, operating income by 42%, Adjusted EBITDA1 by 33%, net income by 184% and free cash flow1 by 117%.
- Delivered a fourteenth consecutive quarter of positive Adjusted EBITDA1 of $3.7 million.
- Operating cash flow surged 81% year-over-year to $10.7 million for fiscal 2024, while free cash flow1 reached $3.2 million, reflecting a $7.2 million improvement from the prior year.
- Reached a national market share of 3.2% in Q4 20242, a 39% increase from the prior year, with a leading 11.9% market share in Québec, marking the Company as top 3rd in the province3.
- Two Valleyfield grow zones planned for fiscal 2025, activating an additional 50,000 square feet of canopy, bringing its estimated total annual cannabis production to just under 40,000 kg.
- Annual General Meeting of shareholders scheduled for January 30, 2025, at 11:00 a.m. EST.
All financial results are reported in Canadian dollars, unless otherwise stated.
MONTREAL, Nov. 25, 2024 (GLOBE NEWSWIRE) — Cannara Biotech Inc. (“Cannara“, “the Company“, “us” or “we“) LOVE LOVFF (FRA: 8CB0), a vertically integrated producer of premium-grade cannabis and derivative product offerings at affordable prices with two mega facilities based in Québec spanning over 1,650,000 sq. ft., today announced its fiscal fourth quarter 2024 financial and operating results for the three and twelve-month periods ended August 31, 2024. The full set of Consolidated Financial Statements for the year ended August 31, 2024, and the accompanying Management’s Discussion and Analysis can be accessed by visiting the Company’s website at investors.cannara.ca, or by accessing the Company’s SEDAR+ profile at www.sedarplus.ca. The Company’s latest investor presentation is available at www.cannara.ca/investors/investor-deck/.
“Fiscal 2024 was a transformative year for Cannara, showcasing the resilience of our business model and the strength of our execution strategy,” said Zohar Krivorot, President & CEO. “With a 3.2% national market share and a leading position in Québec, we have proven our ability to deliver sustained growth in a challenging cannabis market. By investing in our state-of-the-art production facilities, powered by the lowest-cost electricity in the country, we continue to produce premium cannabis products at an unmatched value. Our three flagship brands—Tribal, Nugz, and Orchid CBD—launched in 2021, have not only endured the challenges of this competitive industry but continue to thrive, achieving quarter-over-quarter growth.”
“Cannara’s fiscal 2024 results demonstrate the financial strength and consistency that investors seek in today’s profit-focused marketplace,” added Nicholas Sosiak, Chief Financial Officer. “With Adjusted EBITDA of $3.7 million for the fourth quarter, marking our 14th consecutive quarter of positive results, and a remarkable turnaround in free cash flow from negative $4.0 million to positive $3.2 million for the year, we have built a solid financial foundation for future growth. Our disciplined approach to capital allocation and operational efficiency continues to drive strong cash generation, while our revenue growth of 43% reflects the increasing demand for our products. As we enter fiscal 2025, we are focused on accelerating market share gains and executing strategies that position Cannara as a dominant force in the cannabis market. For investors, Cannara is delivering results today and building momentum for an even brighter future.”
_________________
1 Please refer to the Non-GAAP and Other Financial Measures section of this news release for corresponding definitions.
2 As reported by Hifyre data for the periods of June 2023 to August 2023 and June 2024 to August 2024.
3 Based on estimated sales data provided by Weed Crawler, for the period of June 2024 to August 2024.
FISCAL 2024 FINANCIAL HIGHLIGHTS
- 2024 total revenues rose by 43% from $57.6 million in 2023 to $82.2 million.
- Gross profit before fair value adjustments for 2024 was $27.9 million, a 32% increase compared to the twelve-month period of 2023. Gross profit percentage before fair value adjustments was 34% while Gross profit after fair value adjustments was 37% for 2024.
- Operating income was $10.1 million for 2024, compared to operating income of $11.9 million for 2023, reflecting increased marketing and administrative expenses to support the growth of the Company’s operations.
- Adjusted EBITDA for 2024 amounted to $15.1 million, a 10% increase compared to the prior year.
- 2024 net income was $6.4 million, compared to $6.9 million in 2023, reflecting the impact of a larger fair value adjustment in 2023 as a result of activating 3 growing zones and increased marketing and administrative costs in 2024 as the Company continues to expand.
- Earnings per share was $0.07 for 2024 compared to $0.08 in 2023.
- Posted positive operating cash flows of $10.7 million in 2024 compared to $5.9 million in 2023, an 81% increase over prior year.
- Free cash flow improved to $3.2 million compared to negative free cash flow of $4.0 million in 2023, representing a $7.2 million turnaround.
- The Company has $40.5 million in working capital4 as of August 31, 2024.
Q4 2024 FINANCIAL HIGHLIGHTS
- Q4 2024 total revenues increased by 28% to $23.4 million compared to Q4 2023.
- Gross profit before fair value adjustments for Q4 2024 was $7.0 million, a 2% increase compared to the same period in 2023. Gross profit percentage before fair value adjustments was 30% and Gross profit after fair value adjustments was 46% for Q4 2024.
- Operating income was $5.0 million for Q4 2024 compared to operating income of $5.8 million in Q4 2023, reflecting increased sales and marketing costs geared towards capturing more market share.
- Delivered the Company’s 14th straight quarter of positive Adjusted EBITDA, totaling $3.7 million for Q4 2024 or 16% of net revenues. This compares to $4.9 million of Adjusted EBITDA generated in the same period of prior year.
- Q4 2024 net income totaled $5.8 million compared to $4.6 million in Q4 2023.
- Earnings per share was $0.06 and $0.05 for Q4 2024 and 2023.
- Posted positive operating cash flows of $3.2 million for Q4 2024 compared to $2.9 million in the same period of the prior year.
- Free cash flow for Q4 2024 increased to $2.7 million from $1.1 million in Q4 2023, a 143% increase.
FISCAL 2024 OPERATIONAL HIGHLIGHTS & FISCAL 2025 OUTLOOK
Scaling Production to Meet Growing Consumer Demand
Cannara has seen strong consumer demand since launching its retail products, prompting expanded production at its Valleyfield Facility. In fiscal 2023, three new growing zones (25,000 sq. ft. each) were activated, with a 10th zone added in January 2024, bringing total cultivation to 250,000 sq. ft. (approximately 100,000 plants). For fiscal 2025, the Company aims to activate two more zones, adding 50,000 sq. ft. of active canopy, while its 24-zone facility allows scalable production in lockstep with demand. To promote demand for continued expansion, Cannara plans to maintain its investments in sales and marketing to boost market share and strengthen loyalty for its flagship brands—Tribal, Nugz, and Orchid CBD.
_________________
4 Please refer to the Non-GAAP and Other Financial Measures section of this news release for corresponding definitions.
FISCAL 2024 OPERATIONAL HIGHLIGHTS & FISCAL 2025 OUTLOOK
Innovating for Market Leadership
In fiscal 2024, Cannara achieved significant growth by refining its product portfolio and targeting high-growth categories such as dried flower, pre-rolls, infused pre-rolls, milled flower, and vapes. Highlights include Tribal’s #1 Live Resin Vape line in Canada (35% category sales)5, Nugz’s #1 Rosin line in Ontario (25% wholesale sales)5, and Québec’s top Infused Pre-roll line under Nugz (63% of category sales)6.
For fiscal 2025, Cannara plans to launch over 20 new products in high volume categories, including innovative formats like all-in-one vape devices under Tribal and Nugz, and premium infused pre-rolls under Tribal. A rigorous pheno-hunting program underpins these developments, unlocking unique genetics tailored to brand fit, potency, structure, and market appeal. In April 2024, Cannara introduced three new genetics: Neon Sunshine and Bubble Up (Tribal) and Guava Jam (Nugz).
Expanding Market Share and Strengthening Leadership Across Canada
Cannara continues to strengthen its position in the Canadian cannabis market, achieving significant growth in national and provincial market share. Nationally, Cannara increased its market share by over 35%, reaching 3.2% in Q4 2024, up from 2.3% in Q4 20235. In Québec, its largest market, Cannara saw a notable 22.7% quarter-over-quarter growth, rising from 9.7% in Q3 2024 to 11.9% in Q4 2024, and further increasing to 12.6% in October 2024, marking Cannara as top 3 largest producer by sales in the province6.
Additionally, Cannara entered Nova Scotia and Manitoba, introducing popular products like Tribal Cuban Linx pre-rolls, which transitioned from limited-time offerings to permanent SKUs. Manitoba saw the addition of 35 SKUs in May 2024, reinforcing Cannara’s market presence.
The expanding Canadian cannabis market, projected to reach US $6.58 billion by 20297, presents further opportunities for Cannara in 2025 and beyond. Leveraging consumer insights from strongholds like Québec, the Company is strategically positioned to grow revenue in existing provinces and expand into smaller provinces, solidifying its footprint as a leader in Canada’s evolving cannabis landscape.
Driving Profitability Through Strategic Efficiency
Cannara aims to build a strategic cannabis platform that generates growth in positive Adjusted EBITDA and operating cash flow by focusing on premium cannabis products at disruptive pricing, leveraging Québec’s low electricity and labor costs, and maintaining a lean operational model. The Company’s in-house pre-roll manufacturing, solventless hash lab, and BHO extraction lab provide a competitive edge through vertical integration and efficient raw material use. By developing high-demand SKUs with strong margins, Cannara has demonstrated its commitment to profitability. Year-to-date 2024 results show a 10.2% increase in Adjusted EBITDA to $15.1 million and an 80.7% increase in operating cash flow to $10.7 million, compared to 2023.
_________________
5 As reported by Hifyre data for the periods of June 2023 to August 2023 and June 2024 to August 2024.
6 Based on estimated sales data provided by Weed Crawler, for the period of June 2024 to August 2024.
7 Statista Market Insights, March 2024, US Dollars
CAPITAL TRANSACTIONS AND OTHER EVENTS
Capital Transactions
- Purchased 286,900 common shares during fiscal 2024, reducing outstanding shares and strengthening shareholder value.
- Granted 625,000 stock options at $1.20, 124,000 stock options at $1.80, and 715,000 RSUs to employees and board members.
- Extended the terms of 2,435,000 stock options at $1.80 and 750,000 stock options at $1.00 by two years.
- Subsequent to year-end, granted 525,000 stock options at $1.00, 115,000 stock options at $1.80, and 625,000 RSUs with performance conditions to align incentives with long-term growth objectives and 90,000 RSUs without performance conditions to employees and board members subject to certain vesting conditions in accordance with the Company’s employee share option plan and RSU plan.
- As of the date of this release, Cannara has 90,018,952 common shares, 5,166,600 stock options, and 2,219,183 RSUs issued and outstanding.
Other Events
- Completed the sale of a parcel of land at the Valleyfield site in April 2024, generating a $2.0 million gain. Additional assets, including a building under construction, remain actively marketed for sale.
- On August 16, 2024, Cannara announced KPMG LLP’s decision to resign as auditor on its own initiative upon the completion of the 2024 year-end audit. MNP LLP has been appointed as the successor auditor, pending shareholder approval at the 2025 Annual General Meeting.
ANNUAL GENERAL MEETING OF SHAREHOLDERS AND ANNUAL INFORMATION FORM
Cannara announced that its Annual General Meeting of shareholders scheduled for January 30, 2025, at 11:00 a.m. EST and will be held via live webcast online and teleconference. The Company also announced that its 2025 Annual Information Form and its Notice of Annual Meeting are now posted on Cannara’s website at www.cannara.ca and filed on SEDAR+ at www.sedarplus.ca.
Shareholders are encouraged to vote on the matters before the meeting by proxy and to join the meeting by webcast. Those who attend the meeting by teleconference are requested to read the notes to form of proxy and then to, complete, sign and mail the enclosed form of proxy in accordance with the instructions set out in the proxy and in the management proxy circular to be posted on Cannara’s website at www.cannara.ca and filed on SEDAR+ at www.sedarplus.ca.
Shareholders will be able to join the annual general meeting by clicking on the link below:
To join the meeting via teleconference, please dial 1-650-479-3208 and use meeting code 2636 952 9781 and passcode LOVE2025 (56832025 when dialing from a phone or video system). Shareholders accessing the Meeting via Teleconference will not be able to vote or speak at the Meeting. To vote or speak at the Meeting, Shareholders will need to join the webcast and utilize the chat function during the Meeting. A moderator will be present to allow Shareholders to vote or speak at the Meeting at the appropriate time.
SELECTED FINANCIAL HIGHLIGHTS
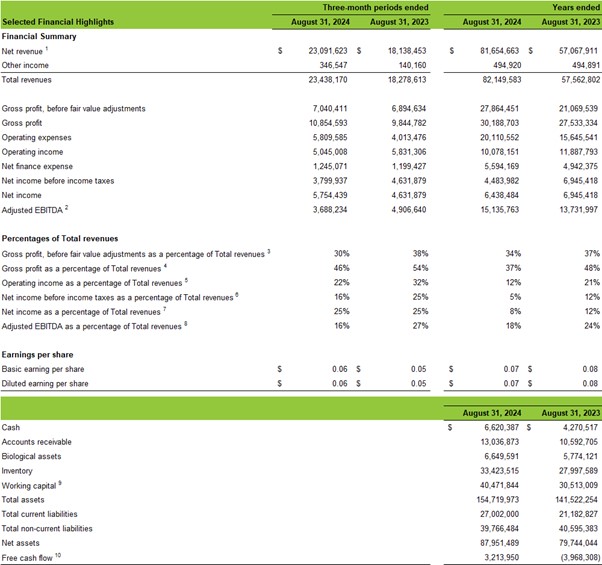
| 1 | Gross revenue included revenue from sale of goods, net of excise taxes, services revenues and lease revenues. |
| 2 | Adjusted EBITDA is a non-GAAP financial measure. |
| 3 | Gross profit before fair value adjustments as a percentage of Total revenues is a supplementary financial ratio. For more details see the Non-GAAP and Other Financial Measures section of this news release. |
| 4 | Gross profit as a percentage of Total revenues is a supplementary financial ratio. For more details see the Non-GAAP and Other Financial Measures section of this news release. |
| 5 | Operating income as a percentage of Total revenues is a supplementary financial ratio. For more details see the Non-GAAP and Other Financial Measures section of this news release. |
| 6 | Net income before income taxes as a percentage of Total revenues is a supplementary financial ratio. For more details see the Non-GAAP and Other Financial Measures section of this news release. |
| 7 | Net income as a percentage of Total revenues is a supplementary financial ratio. For more details see the Non-GAAP and Other Financial Measures section of this news release. |
| 8 | Adjusted EBITDA as a percentage of Total revenues is a non-GAAP financial ratio. For more details see the Non-GAAP and Other Financial Measures section of this news release. |
| 9 | Working capital is a non-GAAP financial measure. For more details see the Non-GAAP and Other Financial Measures section of this news release. |
| 10 | Free cash flow is a non-GAAP financial measure. For more details see the Non-GAAP and Other Financial Measures section of this news release. |
NON-GAAP MEASURES AND OTHER FINANCIAL MEASURES
The Company reports its financial results in accordance with International Financial Reporting Standards (“IFRS“). Cannara uses a number of financial measures when assessing its results and measuring overall performance. Some of these financial measures are not calculated in accordance with IFRS. National Instrument 52-112 respecting Non-GAAP and Other Financial Measures Disclosure (“NI 52-112“) prescribes disclosure requirements that apply to the following types of measures used by the Company: (i) non-GAAP financial measures and (ii) non-GAAP and other supplementary financial ratios. In this news release, the following non-GAAP measures, non-GAAP and other supplementary financial ratios are used by the Company: adjusted EBITDA, free cash flow, working capital, segment gross profit before fair value adjustments as a percentage of segment total revenues, segment gross profit as a percentage of segment total revenues, segment operating income as a percentage of segment total revenues, gross profit as a percentage of total revenues and adjusted EBITDA as a percentage of total revenues. Additional details for these non-GAAP and other financial measures can be found in the section entitled “Non-GAAP and Other Financial Measures” of Cannara’s MD&A for the year ended August 31, 2024, which is posted on Cannara’s website at www.cannara.ca and filed on SEDAR+ at www.sedarplus.ca. Reconciliations of non-GAAP financial measures and non-GAAP and supplementary financial ratios to the most directly comparable IFRS measures are provided below. Management believes that these non-GAAP financial measures and non-GAAP and supplementary financial ratios provide useful information to investors regarding the Company’s financial condition and results of operations as they provide key metrics of its performance. These measures are not recognized under IFRS, do not have any standardized meanings prescribed under IFRS and may differ from similar computations as reported by other issuers, and accordingly may not be comparable. These measures should not be viewed as a substitute for the related financial information prepared in accordance with IFRS.
Reconciliation of Adjusted EBITDA
Adjusted EBITDA is a non-GAAP Measure and can be reconciled with net income, the most directly comparable IFRS financial measure, as detailed below.
Adjusted EBITDA as a percentage of total revenues is a non-GAAP financial ratio, determined as adjusted EBITDA divided by total revenues.
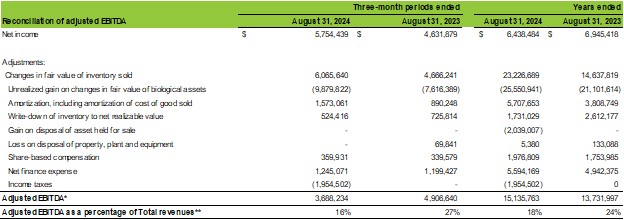
*Non-GAAP financial measure
**Non-GAAP financial ratio
NON-GAAP MEASURES AND OTHER FINANCIAL MEASURES
Reconciliation of free cash flow
Free cash flow is a non-GAAP measure and can be reconciled with Cash from operating activities, the most directly comparable IFRS financial measure, as detailed below.

*Non-GAAP financial measure
Reconciliation of working capital
Working capital is a non-GAAP Measure and can be reconciled with total current assets and total current liabilities, the most directly comparable IFRS financial measure, as detailed below.

*Non-GAAP financial measure
CONTACT
Neither the TSX Venture Exchange nor its Regulation Services Provider (as that term is defined in the policies of the TSX Venture Exchange) accepts responsibility for the adequacy or accuracy of this release.
ABOUT CANNARA
Cannara Biotech Inc. LOVE LOVFF (FRA: 8CB0), is a vertically integrated producer of affordable premium-grade cannabis and cannabis-derivative products for the Canadian markets. Cannara owns two mega facilities based in Québec spanning over 1,650,000 sq. ft., providing the Company with 100,000 kg of potential annualized cultivation output. Leveraging Québec’s low electricity costs, Cannara’s facilities produce premium-grade cannabis products at an affordable price. For more information, please visit cannara.ca.
CAUTIONARY STATEMENT REGARDING “FORWARD-LOOKING” INFORMATION
This news release may contain “forward-looking information” within the meaning of Canadian securities legislation (“forward-looking statements“). These forward-looking statements are made as of the date of this MD&A and the Company does not intend, and does not assume any obligation, to update these forward-looking statements, except as required under applicable securities legislation. Forward-looking statements relate to future events or future performance and reflect Company management’s expectations or beliefs regarding future events and include, but are not limited to, the Company and its operations, its projections or estimates about its future business operations, its planned expansion activities, anticipated product offerings, the adequacy of its financial resources, the ability to adhere to financial and other covenants under lending agreements, future economic performance, and the Company’s ability to become a leader in the field of cannabis cultivation, production, and sales.
In certain cases, forward-looking statements can be identified by the use of words such as “plans,” “expects” or “does not expect,” “is expected,” “budget,” “scheduled,” “estimates,” “forecasts,” “intends,” “anticipates” or “does not anticipate,” or “believes,” or variations of such words and phrases or statements that certain actions, events or results “may,” “could,” “would,” “might” or “will be taken,” “occur” or “be achieved” or the negative of these terms or comparable terminology. In this document, certain forward-looking statements are identified by words including “may,” “future,” “expected,” “intends” and “estimates.” By their very nature, forward-looking statements involve known and unknown risks, uncertainties and other factors which may cause the actual results, performance, or achievements of the Company to be materially different from any future results, performance or achievements expressed or implied by the forward-looking statements.
Forward-looking information is based upon a number of assumptions and is subject to a number of risks and uncertainties, many of which are beyond our control, which could cause actual results to differ materially from those that are disclosed in, or implied by, such forward-looking information. These risks and uncertainties include, but are not limited to, the risk factors which are discussed in greater detail under “Risk Factors” in the Company’s AIF available on SEDAR+ at www.sedarplus.ca and under the “Investor Area” section of our website at https://www.cannara.ca/en/investor-area.
Other risks not presently known to the Company or that the Company believes are not significant could also cause actual results to differ materially from those expressed in its forward-looking statements. Although the forward-looking information contained herein is based upon what we believe are reasonable assumptions, readers are cautioned against placing undue reliance on this information since actual results may vary from the forward-looking information. Certain assumptions were made in preparing the forward-looking information concerning the availability of capital resources, business performance, market conditions, as well as customer demand. Consequently, all of the forward-looking information contained herein is qualified by the foregoing cautionary statements, and there can be no guarantee that the results or developments that we anticipate will be realized or, even if substantially realized, that they will have the expected consequences or effects on our business, financial condition or results of operation. Unless otherwise noted or the context otherwise indicates, the forward-looking information contained herein is provided as of the date hereof, and we do not undertake to update or amend such forward-looking information whether as a result of new information, future events or otherwise, except as may be required by applicable law.
A Media Snippet accompanying this announcement is available by clicking on this link.
Figures accompanying this announcement are available at
https://www.globenewswire.com/NewsRoom/AttachmentNg/3f77c62c-8b07-45a8-a032-f68ffbe910c9
https://www.globenewswire.com/NewsRoom/AttachmentNg/6d3a1a37-df5b-4f6a-86fd-f3f3325d2579
https://www.globenewswire.com/NewsRoom/AttachmentNg/7f178e3c-4f26-4d6e-be80-26163a53c130
https://www.globenewswire.com/NewsRoom/AttachmentNg/210dfde3-4532-4497-902a-d67722be0887

© 2024 Benzinga.com. Benzinga does not provide investment advice. All rights reserved.
Supermicro Price Levels to Watch After Stock Surged Nearly 80% Last Week
-
Supermicro shares gained ground in premarket trading on Monday after rising nearly 80% last week, as the embattled server maker rebounded from a turbulent stretch.
-
The recent gains follow the filing of a compliance plan last Monday to avoid a potential Nasdaq delisting, as well as a mention from partner and AI favorite Nvidia in the chipmaker’s earnings call on Wednesday.
-
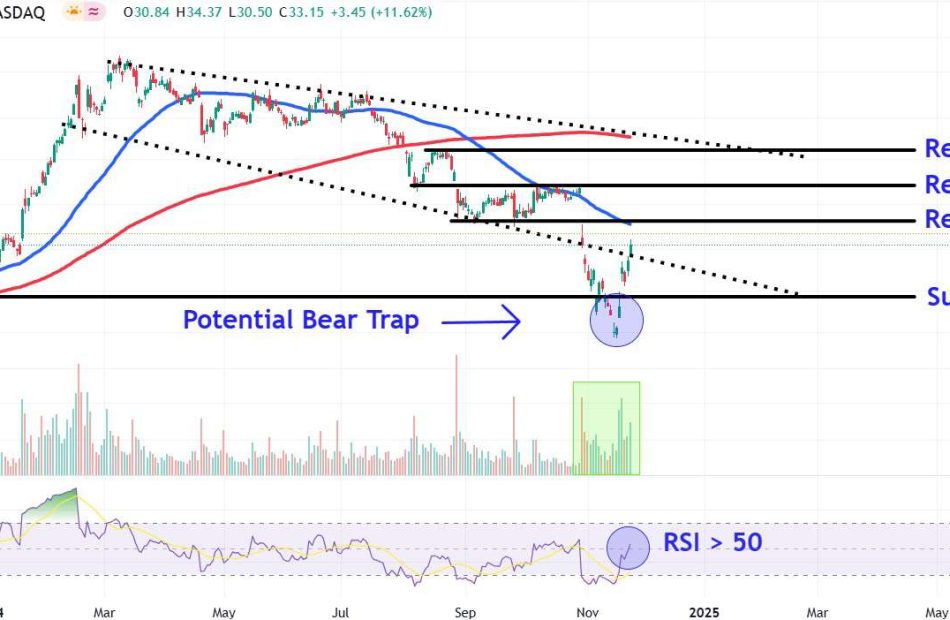
Supermicro shares broke down below support earlier this month before promptly reversing direction to create a potential bear trap.
-
The relative strength index has crossed above 50 to confirm improving momentum, but sits below overbought territory, giving the price ample room to test higher prices.
-
Investors should monitor important resistance areas on Supermicro’s chart around $39, $50, and $64, while also watching a key support level near $23.
Super Micro Computer (SMCI) shares gained ground in premarket trading on Monday after rising nearly 80% last week, as the embattled server maker rebounded from a turbulent stretch.
The recent gains follow the filing of a compliance plan last Monday to avoid a potential Nasdaq delisting, as well as a mention from partner and AI favorite Nvidia (NVDA) in the chipmaker’s earnings call on Wednesday.
Even after last week’s surge which saw the shares record their best five day return on record, the stock still trades more than 70% below its March peak. The stock had slumped in the wake of several accounting and corporate governance issues that, in part, led to the resignation of the company’s auditor and delayed filing of several financial reports.
The stock was up 7% at $35.50 in recent premarket trading.
Below, we take a closer look at Supermicro’s chart and use technical analysis to identify important price levels worth watching.
Supermicro shares broke down below support earlier this month before promptly reversing direction to reclaim the key technical level. Such a move creates a potential bear trap, a chart event that lures investors into selling or opening a short position before the market rebounds to cause a loss.
It’s also worth pointing out that above-average trading volume has backed the stock’s recent recovery, indicating strong buying conviction. Moreover, the relative strength index (RSI) has crossed above 50 to confirm improving momentum, but sits below overbought territory, giving the price ample room to test higher prices.
Looking ahead, let’s identify three important resistance areas on Supermicro’s chart to monitor if the stock continues its move higher and also call out an important support level to watch during retracements.

