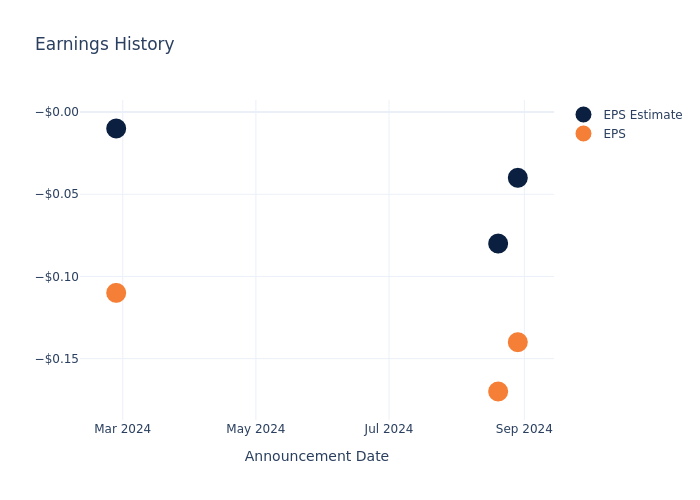
A Look Ahead: United Maritime's Earnings Forecast
United Maritime USEA is preparing to release its quarterly earnings on Tuesday, 2024-11-26. Here’s a brief overview of what investors should keep in mind before the announcement.
Analysts expect United Maritime to report an earnings per share (EPS) of $-0.05.
The announcement from United Maritime is eagerly anticipated, with investors seeking news of surpassing estimates and favorable guidance for the next quarter.
It’s worth noting for new investors that guidance can be a key determinant of stock price movements.
Here’s a look at United Maritime’s past performance and the resulting price change:
| Quarter | Q2 2024 | Q1 2024 | Q4 2023 | Q3 2023 |
|---|---|---|---|---|
| EPS Estimate | ||||
| EPS Actual | 0.09 | -0.13 | -0.07 | 0.95 |
| Price Change % | 0.0% | 3.0% | -1.0% | 1.0% |
United Maritime Share Price Analysis
Shares of United Maritime were trading at $2.08 as of November 22. Over the last 52-week period, shares are down 13.33%. Given that these returns are generally negative, long-term shareholders are likely unhappy going into this earnings release.
To track all earnings releases for United Maritime visit their earnings calendar on our site.
This article was generated by Benzinga’s automated content engine and reviewed by an editor.
Market News and Data brought to you by Benzinga APIs
© 2024 Benzinga.com. Benzinga does not provide investment advice. All rights reserved.
Spotlight on Datadog: Analyzing the Surge in Options Activity
High-rolling investors have positioned themselves bullish on Datadog DDOG, and it’s important for retail traders to take note.
This activity came to our attention today through Benzinga’s tracking of publicly available options data. The identities of these investors are uncertain, but such a significant move in DDOG often signals that someone has privileged information.
Today, Benzinga’s options scanner spotted 16 options trades for Datadog. This is not a typical pattern.
The sentiment among these major traders is split, with 37% bullish and 37% bearish. Among all the options we identified, there was one put, amounting to $28,125, and 15 calls, totaling $1,025,159.
Projected Price Targets
Based on the trading activity, it appears that the significant investors are aiming for a price territory stretching from $100.0 to $185.0 for Datadog over the recent three months.
Insights into Volume & Open Interest
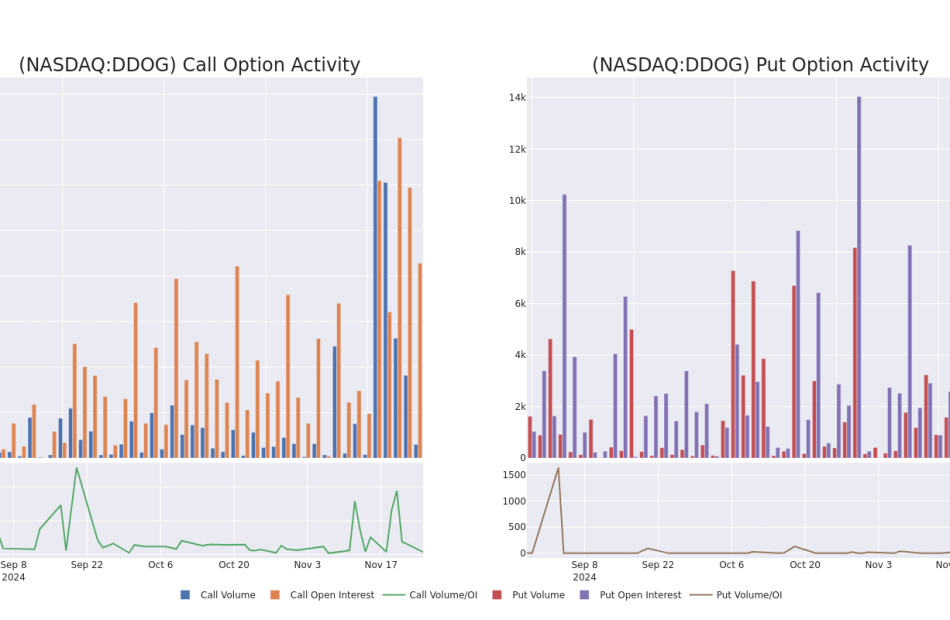
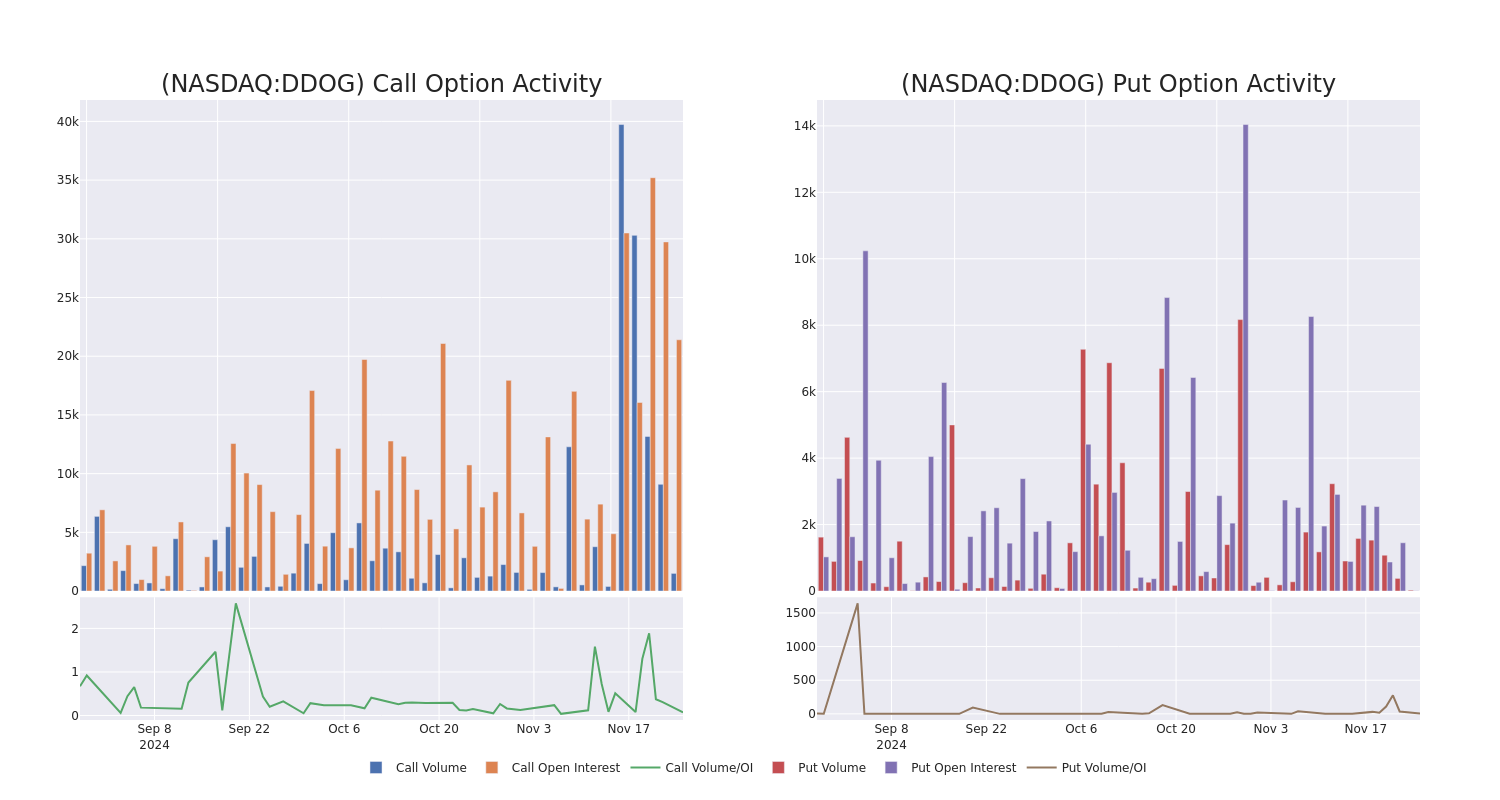
Assessing the volume and open interest is a strategic step in options trading. These metrics shed light on the liquidity and investor interest in Datadog’s options at specified strike prices. The forthcoming data visualizes the fluctuation in volume and open interest for both calls and puts, linked to Datadog’s substantial trades, within a strike price spectrum from $100.0 to $185.0 over the preceding 30 days.
Datadog 30-Day Option Volume & Interest Snapshot
Largest Options Trades Observed:
| Symbol | PUT/CALL | Trade Type | Sentiment | Exp. Date | Ask | Bid | Price | Strike Price | Total Trade Price | Open Interest | Volume |
|---|---|---|---|---|---|---|---|---|---|---|---|
| DDOG | CALL | TRADE | BEARISH | 01/03/25 | $15.55 | $13.75 | $13.75 | $144.00 | $137.5K | 100 | 100 |
| DDOG | CALL | TRADE | BULLISH | 01/16/26 | $65.4 | $62.95 | $64.45 | $100.00 | $128.9K | 141 | 27 |
| DDOG | CALL | SWEEP | BEARISH | 01/17/25 | $27.65 | $26.35 | $26.74 | $130.00 | $120.0K | 6.9K | 108 |
| DDOG | CALL | SWEEP | BEARISH | 01/17/25 | $27.55 | $26.4 | $26.75 | $130.00 | $106.7K | 6.9K | 148 |
| DDOG | CALL | TRADE | BULLISH | 01/16/26 | $27.5 | $27.35 | $27.5 | $160.00 | $74.2K | 677 | 0 |
About Datadog
Datadog is a cloud-native company that focuses on analyzing machine data. The firm’s product portfolio, delivered via software as a service, allows a client to monitor and analyze its entire IT infrastructure. Datadog’s platform can ingest and analyze large amounts of machine-generated data in real time, allowing clients to utilize it for a variety of applications throughout their businesses.
In light of the recent options history for Datadog, it’s now appropriate to focus on the company itself. We aim to explore its current performance.
Present Market Standing of Datadog
- Currently trading with a volume of 2,695,586, the DDOG’s price is up by 0.89%, now at $156.22.
- RSI readings suggest the stock is currently may be overbought.
- Anticipated earnings release is in 78 days.
What Analysts Are Saying About Datadog
In the last month, 5 experts released ratings on this stock with an average target price of $150.2.
Turn $1000 into $1270 in just 20 days?
20-year pro options trader reveals his one-line chart technique that shows when to buy and sell. Copy his trades, which have had averaged a 27% profit every 20 days. Click here for access.
* An analyst from Rosenblatt persists with their Buy rating on Datadog, maintaining a target price of $148.
* An analyst from Barclays persists with their Overweight rating on Datadog, maintaining a target price of $155.
* Consistent in their evaluation, an analyst from TD Cowen keeps a Buy rating on Datadog with a target price of $165.
* An analyst from Scotiabank persists with their Sector Outperform rating on Datadog, maintaining a target price of $133.
* Consistent in their evaluation, an analyst from Baird keeps a Outperform rating on Datadog with a target price of $150.
Options are a riskier asset compared to just trading the stock, but they have higher profit potential. Serious options traders manage this risk by educating themselves daily, scaling in and out of trades, following more than one indicator, and following the markets closely.
If you want to stay updated on the latest options trades for Datadog, Benzinga Pro gives you real-time options trades alerts.
Market News and Data brought to you by Benzinga APIs
© 2024 Benzinga.com. Benzinga does not provide investment advice. All rights reserved.
Uncovering Potential: Embecta's Earnings Preview
Embecta EMBC is preparing to release its quarterly earnings on Tuesday, 2024-11-26. Here’s a brief overview of what investors should keep in mind before the announcement.
Analysts expect Embecta to report an earnings per share (EPS) of $0.36.
The announcement from Embecta is eagerly anticipated, with investors seeking news of surpassing estimates and favorable guidance for the next quarter.
It’s worth noting for new investors that guidance can be a key determinant of stock price movements.
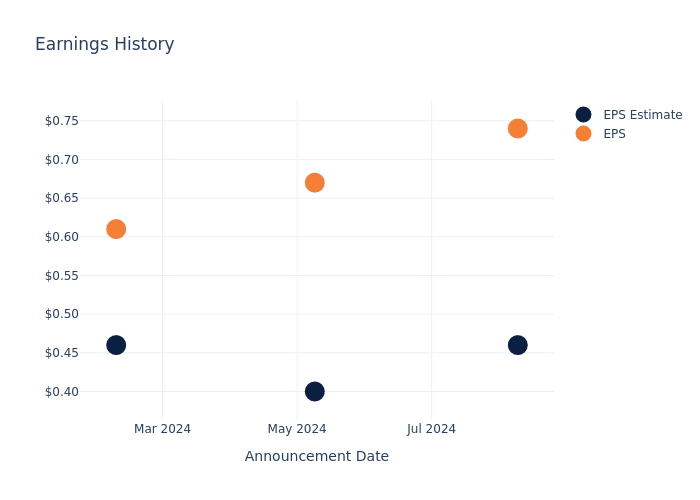
Historical Earnings Performance
Last quarter the company beat EPS by $0.28, which was followed by a 0.0% drop in the share price the next day.
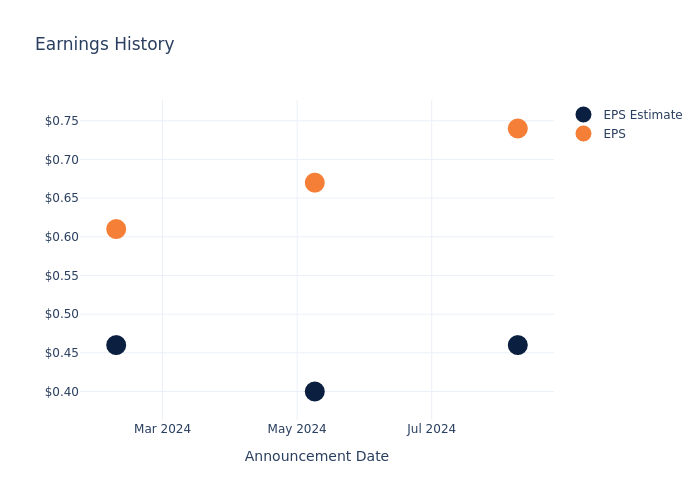
Here’s a look at Embecta’s past performance and the resulting price change:
| Quarter | Q3 2024 | Q2 2024 | Q1 2024 | Q4 2023 |
|---|---|---|---|---|
| EPS Estimate | 0.46 | 0.40 | 0.46 | 0.40 |
| EPS Actual | 0.74 | 0.67 | 0.61 | 0.59 |
| Price Change % | 7.000000000000001% | 1.0% | -8.0% | 3.0% |
Tracking Embecta’s Stock Performance
Shares of Embecta were trading at $13.82 as of November 22. Over the last 52-week period, shares are down 19.65%. Given that these returns are generally negative, long-term shareholders are likely upset going into this earnings release.
To track all earnings releases for Embecta visit their earnings calendar on our site.
This article was generated by Benzinga’s automated content engine and reviewed by an editor.
Market News and Data brought to you by Benzinga APIs
© 2024 Benzinga.com. Benzinga does not provide investment advice. All rights reserved.
Price Over Earnings Overview: Walt Disney
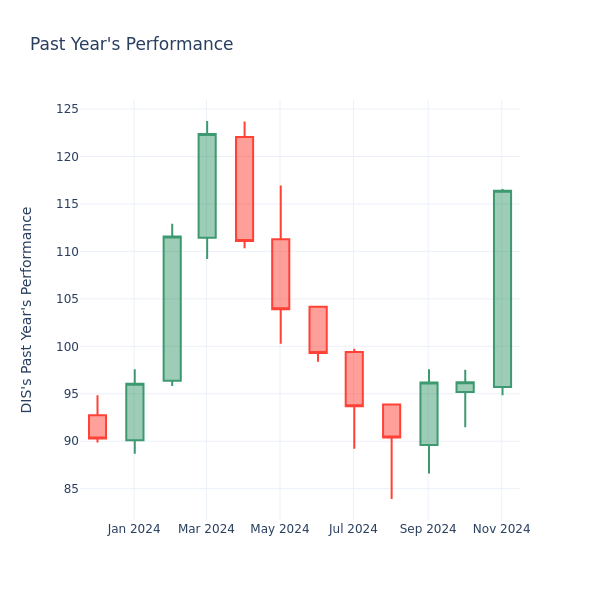
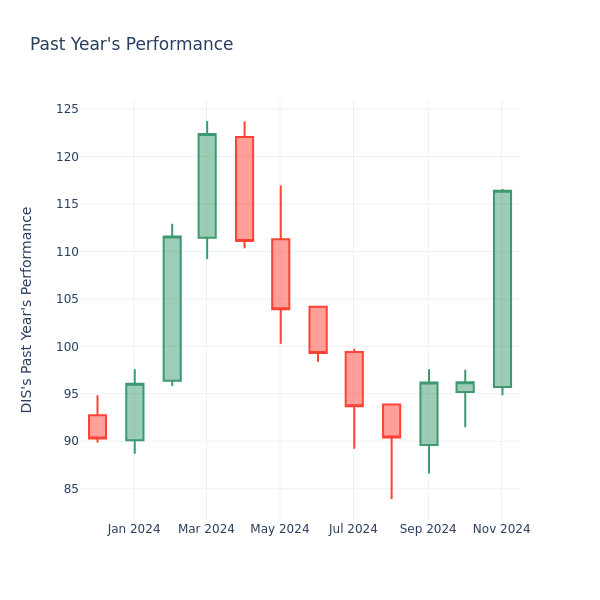
In the current session, the stock is trading at $116.06, after a 0.36% increase. Over the past month, Walt Disney Inc. DIS stock increased by 21.08%, and in the past year, by 25.83%. With performance like this, long-term shareholders are optimistic but others are more likely to look into the price-to-earnings ratio to see if the stock might be overvalued.
Walt Disney P/E Ratio Analysis in Relation to Industry Peers
The P/E ratio measures the current share price to the company’s EPS. It is used by long-term investors to analyze the company’s current performance against it’s past earnings, historical data and aggregate market data for the industry or the indices, such as S&P 500. A higher P/E indicates that investors expect the company to perform better in the future, and the stock is probably overvalued, but not necessarily. It also could indicate that investors are willing to pay a higher share price currently, because they expect the company to perform better in the upcoming quarters. This leads investors to also remain optimistic about rising dividends in the future.
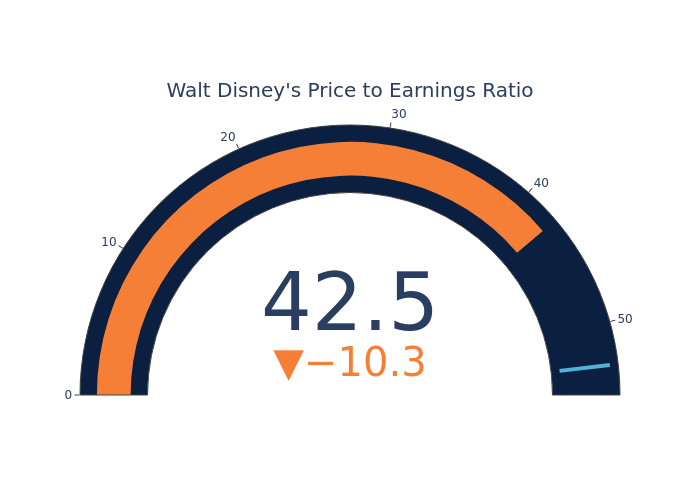
Walt Disney has a lower P/E than the aggregate P/E of 52.76 of the Entertainment industry. Ideally, one might believe that the stock might perform worse than its peers, but it’s also probable that the stock is undervalued.
In summary, while the price-to-earnings ratio is a valuable tool for investors to evaluate a company’s market performance, it should be used with caution. A low P/E ratio can be an indication of undervaluation, but it can also suggest weak growth prospects or financial instability. Moreover, the P/E ratio is just one of many metrics that investors should consider when making investment decisions, and it should be evaluated alongside other financial ratios, industry trends, and qualitative factors. By taking a comprehensive approach to analyzing a company’s financial health, investors can make well-informed decisions that are more likely to lead to successful outcomes.
Market News and Data brought to you by Benzinga APIs
© 2024 Benzinga.com. Benzinga does not provide investment advice. All rights reserved.
A Look Ahead: Guess's Earnings Forecast
Guess GES is gearing up to announce its quarterly earnings on Tuesday, 2024-11-26. Here’s a quick overview of what investors should know before the release.
Analysts are estimating that Guess will report an earnings per share (EPS) of $0.37.
The announcement from Guess is eagerly anticipated, with investors seeking news of surpassing estimates and favorable guidance for the next quarter.
It’s worth noting for new investors that guidance can be a key determinant of stock price movements.
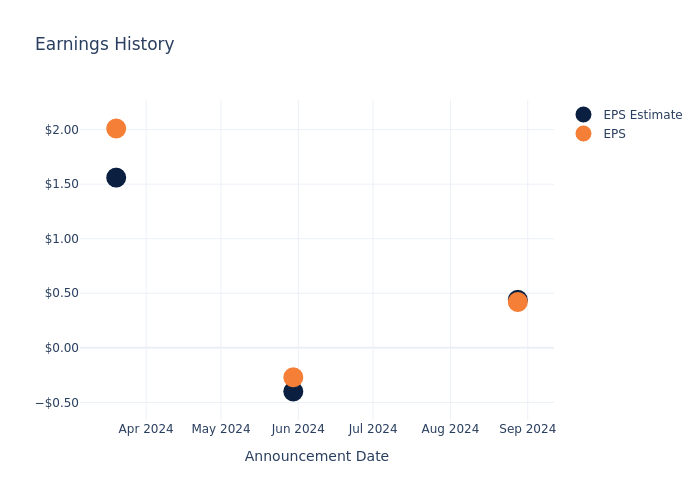
Overview of Past Earnings
In the previous earnings release, the company missed EPS by $0.02, leading to a 1.43% increase in the share price the following trading session.
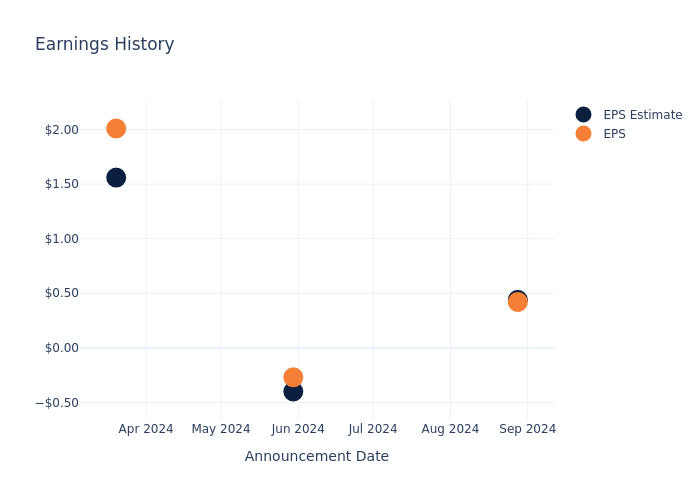
Here’s a look at Guess’s past performance and the resulting price change:
| Quarter | Q2 2025 | Q1 2025 | Q4 2024 | Q3 2024 |
|---|---|---|---|---|
| EPS Estimate | 0.44 | -0.40 | 1.56 | 0.62 |
| EPS Actual | 0.42 | -0.27 | 2.01 | 0.49 |
| Price Change % | 1.0% | -1.0% | 21.0% | -12.0% |
Performance of Guess Shares
Shares of Guess were trading at $17.07 as of November 22. Over the last 52-week period, shares are down 18.37%. Given that these returns are generally negative, long-term shareholders are likely bearish going into this earnings release.
Analyst Insights on Guess
For investors, staying informed about market sentiments and expectations in the industry is paramount. This analysis provides an exploration of the latest insights on Guess.
With 11 analyst ratings, Guess has a consensus rating of Buy. The average one-year price target is $28.36, indicating a potential 66.14% upside.
Comparing Ratings with Peers
In this analysis, we delve into the analyst ratings and average 1-year price targets of Shoe Carnival and Caleres, three key industry players, offering insights into their relative performance expectations and market positioning.
- Shoe Carnival received a Buy consensus from analysts, with an average 1-year price target of $51.0, implying a potential 198.77% upside.
- The consensus outlook from analysts is an Neutral trajectory for Caleres, with an average 1-year price target of $37.5, indicating a potential 119.68% upside.
Comprehensive Peer Analysis Summary
The peer analysis summary provides a snapshot of key metrics for Shoe Carnival and Caleres, illuminating their respective standings within the industry. These metrics offer valuable insights into their market positions and comparative performance.
| Company | Consensus | Revenue Growth | Gross Profit | Return on Equity |
|---|---|---|---|---|
| Guess | Buy | 10.24% | $319.94M | -2.04% |
| Shoe Carnival | Buy | -7.76% | $119.94M | 3.07% |
| Caleres | Neutral | -1.76% | $310.88M | 4.91% |
Key Takeaway:
Guess is positioned in the middle among its peers for revenue growth, with a growth rate of 10.24%. It ranks at the bottom for gross profit at $319.94M. In terms of return on equity, Guess is at the bottom with a rate of -2.04%.
Delving into Guess’s Background
Guess? Inc designs, markets distributes, and licenses contemporary apparel and accessories that reflect European fashion sensibilities and American Lifestyle under brands including Guess, Marciano, and G by Guess. The company has five reportable segments: Americas Retail, Americas Wholesale, Europe, Asia, and licensing. Geographically, the company derives maximum revenue from the United States.
Guess: Delving into Financials
Market Capitalization Perspectives: The company’s market capitalization falls below industry averages, signaling a relatively smaller size compared to peers. This positioning may be influenced by factors such as perceived growth potential or operational scale.
Revenue Growth: Guess displayed positive results in 3 months. As of 31 July, 2024, the company achieved a solid revenue growth rate of approximately 10.24%. This indicates a notable increase in the company’s top-line earnings. As compared to competitors, the company surpassed expectations with a growth rate higher than the average among peers in the Consumer Discretionary sector.
Net Margin: Guess’s net margin is below industry averages, indicating potential challenges in maintaining strong profitability. With a net margin of -1.47%, the company may face hurdles in effective cost management.
Return on Equity (ROE): The company’s ROE is below industry benchmarks, signaling potential difficulties in efficiently using equity capital. With an ROE of -2.04%, the company may need to address challenges in generating satisfactory returns for shareholders.
Return on Assets (ROA): Guess’s ROA is below industry averages, indicating potential challenges in efficiently utilizing assets. With an ROA of -0.39%, the company may face hurdles in achieving optimal financial returns.
Debt Management: Guess’s debt-to-equity ratio is notably higher than the industry average. With a ratio of 2.86, the company relies more heavily on borrowed funds, indicating a higher level of financial risk.
To track all earnings releases for Guess visit their earnings calendar on our site.
This article was generated by Benzinga’s automated content engine and reviewed by an editor.
© 2024 Benzinga.com. Benzinga does not provide investment advice. All rights reserved.
Nvidia's Growth May Be Cooling, but Here's Why I'm Still Buying
Nvidia Corporation‘s (NASDAQ: NVDA) shares dipped 3.4% in response to its fiscal 2025 third-quarter results last week, but I see this modest move lower as an opportunity to add to my position. While analysts project the company’s revenue growth to slow from 111.9% in fiscal 2025 to 49.2% in fiscal 2026, I remain convinced of this technology giant’s fundamental story.
I’m particularly excited about the opportunity that lies ahead in artificial intelligence (AI). Major cloud providers plan to invest $267 billion in AI infrastructure next year alone, a 33.5% increase from current levels. This unprecedented buildout positions Nvidia, with its 80% market share in AI chips, at the center of what Amazon CEO Andy Jassy calls a “once-in-a-lifetime” opportunity.
Are You Missing The Morning Scoop? Breakfast News delivers it all in a quick, Foolish, and free daily newsletter. Sign Up For Free »
Here’s a full breakdown of why I plan to continue to buy shares of this AI titan despite its slowing growth trajectory.
Nvidia’s latest results demonstrate its dominance in AI computing. The company reported record data center revenue of $30.8 billion for its fiscal 2025 third quarter, up 112% year-over-year. This staggering growth reflects insatiable demand from major cloud providers who are racing to build AI capabilities.
Microsoft is expected to spend $80 billion on total infrastructure in 2024, while Alphabet and Amazon have earmarked $51 billion and $75 billion respectively for their capital investments, with AI infrastructure being a major focus.
CEO Jensen Huang describes current AI demand as “insane,” with the total addressable market for AI accelerators projected to grow over 60% annually to reach $500 billion by 2028, according to Advanced Micro Devices (AMD) CEO Lisa Su. This rapid market expansion isn’t just about current applications; the entire industry is preparing for the next wave of AI breakthroughs.
At 33.6 times forward earnings, Nvidia trades at a premium to the S&P 500‘s 23.8 multiple but remains reasonably valued given its growth trajectory. After all, a company growing revenue more than 100% year over year with industry-leading profitability deserves to trade at a premium multiple.
What’s more, the company’s pricing power tells a compelling story. Gross margins reached a sizzling 74.6% in the most recent quarter on a generally accepted accounting principles (GAAP) basis, demonstrating exceptional operational efficiency even as production scales to meet surging demand. This pricing power stems from continuous technological innovation.
Israel, Lebanon Reach Reported Cease-Fire Deal: Gold, Oil Tumble; S&P 500, Dow Jointly Hit Record Highs
Israel and Lebanon have agreed on the framework for a cease-fire deal to end over a year of violent conflict between Israel and Hezbollah, a senior U.S. official told Axios on Monday.
While the agreement awaits formal approval from Israel’s Security Cabinet on Tuesday, global financial markets are already reacting, with gold and oil prices tumbling as geopolitical risks recede and risky assets soar amid improving investor optimism.
Both the Dow Jones Index and the S&P 500 indices hit fresh record highs minutes following Monday’s market open in New York.
Israel-Lebanon Deal: What It Includes
The cease-fire, if approved, would mark the end of a bloody chapter that has claimed the lives of over 3,500 Lebanese and 140 Israelis while displacing hundreds of thousands of people on both sides of the border.
Under the proposed agreement, Israel would initiate a 60-day withdrawal of its military from southern Lebanon, the Axios report said.
Simultaneously, the Lebanese army would deploy along border areas, and Hezbollah would relocate its heavy weaponry north of the Litani River.
To ensure compliance, a U.S.-led oversight committee would monitor the agreement, while the U.S. has pledged to support Israeli military action against imminent threats if Lebanese forces fail to act.
A senior U.S. official told Axios: “We think we have a deal. We are on the goal line, but we haven’t passed it yet.”
Oil, Gold Take A Blow
The news sent shockwaves through the commodities market.
With the threat of broader regional conflict subsiding, West Texas Intermediate (WTI) crude oil – as tracked by the United States Oil Fund USO – fell 1.5% on Monday to $70 per barrel, almost fully paring back Friday’s gains.
Gold, tracked by the SPDR Gold Trust GLD plunged over 3% to $2,640 an ounce as investors scaled back safe-haven bets. Silver followed suit, dropping 3% to $30.40 an ounce.
The U.S. dollar also softened, losing 0.7% against a basket of major currencies, reflecting the shift in risk sentiment.
Stock Market Soars To New Heights
The cease-fire optimism spilled into equities. The S&P 500 index – tracked by the SPDR S&P 500 ETF Trust SPY –reached an all-time high of 6,020 points, gaining 0.8% on the day, while the Dow Jones Industrial Average – mimicked by the SPDR Dow Jones Industrial Average ETF DIA – climbed 1% to a record-breaking 44,738.
Notably, all major S&P sectors except energy posted gains, with the broader index aiming for its sixth straight session of gains.
Israeli stocks – tracked by the VanEck Israel ETF ISRA – soared 1.9%, also eyeing a six-day winning streak.
S&P 500’s top gainers during morning trading in New York included:
- Bath & Body Works BBWI
- Super Micro Computer Inc. SMCI
- Wolfspeed, Inc. WOLF
- Clarivate Plc CLVT
- Astera Labs, Inc. ALAB
Read Next:
Photo via Shutterstock.
Market News and Data brought to you by Benzinga APIs
© 2024 Benzinga.com. Benzinga does not provide investment advice. All rights reserved.
MicroStrategy spends $5.4 billion buying another 55,000 bitcoins
MicroStrategy (MSTR) said Monday it purchased another 55,000 bitcoins (BTC-USD) last week for $5.4 billion as the world’s largest cryptocurrency was trading at all-time highs.
Shares of the company were trading on both sides of the flat line following the news, recovering from a drop of more than 8% by 10:45 a.m. ET.
In a filing with the SEC, MicroStrategy said it spent $5.4 billion to acquire these bitcoins between Nov. 18 and Nov. 24, buying the bitcoin at an average price of $97,862.
The company said it used proceeds from convertible notes and share sales to fund the purchase.
The application software company, which has become a bitcoin proxy, has been buying tokens since 2020.
In recent weeks, it has intensified its purchases as bitcoin has rallied to highs above $99,000 following Donald Trump’s presidential win earlier this month.
The company’s prior weekly purchase included 51,780 bitcoins for an average price of just over $88,500 per token.
As of Sunday, MicroStrategy held approximately 386,700 bitcoins, acquired for an aggregate purchase price of about $21.9 billion and an average purchase price of approximately $56,761 per bitcoin.
MicroStrategy stock has been on a wild run this year, up more than 515% year to date, though shares fell over 15% last week after short seller Citron Research said they were betting against the stock.
The short seller said in an X post that while the firm remains bullish on bitcoin — and was bullish on MicroStrategy’s bitcoin play years ago — the company’s stock has “completely detached from BTC fundamentals.”
Wall Street analysts, however, have been increasingly bullish on the stock given bitcoin’s run and where bulls say it could be headed.
Bitcoin has been flirting with $100,000 since last Friday, reaching highs of more than $99,400.
Read more: Bitcoin clears another record: Is this a good time to invest?
Analysts at Bernstein raised their price target on the stock to $600 from $290, while Benchmark raised its target to a Street high of $640, up from $450.
In an interview on Yahoo Finance’s Opening Bid podcast, Benchmark’s Mark Palmer said, “We assume in our analysis of MicroStrategy, that the price of bitcoin will reach $225,000 by the end of 2026.”
Ines Ferre is a senior business reporter for Yahoo Finance. Follow her on X at @ines_ferre.
Click here for in-depth analysis of the latest stock market news and events moving stock prices
A Look at 3D Sys's Upcoming Earnings Report
3D Sys DDD will release its quarterly earnings report on Tuesday, 2024-11-26. Here’s a brief overview for investors ahead of the announcement.
Analysts anticipate 3D Sys to report an earnings per share (EPS) of $-0.09.
The announcement from 3D Sys is eagerly anticipated, with investors seeking news of surpassing estimates and favorable guidance for the next quarter.
It’s worth noting for new investors that guidance can be a key determinant of stock price movements.
Earnings Track Record
In the previous earnings release, the company missed EPS by $0.10, leading to a 8.15% drop in the share price the following trading session.
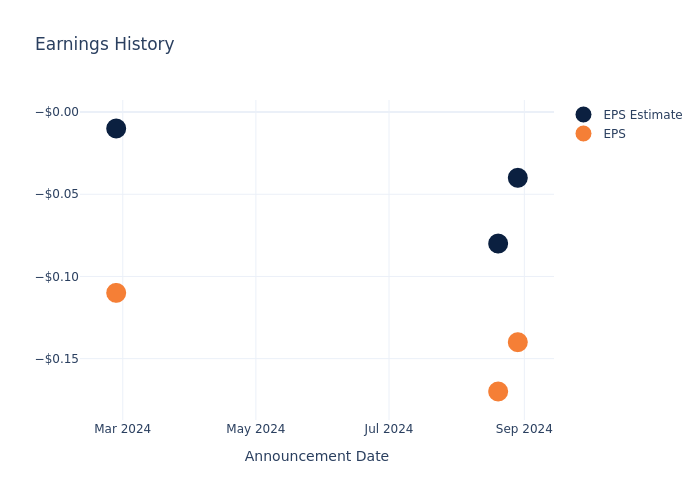
Here’s a look at 3D Sys’s past performance and the resulting price change:
| Quarter | Q2 2024 | Q1 2024 | Q4 2023 | Q3 2023 |
|---|---|---|---|---|
| EPS Estimate | -0.04 | -0.08 | -0.01 | -0.06 |
| EPS Actual | -0.14 | -0.17 | -0.11 | 0.01 |
| Price Change % | -8.0% | 3.0% | -23.0% | 3.0% |
3D Sys Share Price Analysis
Shares of 3D Sys were trading at $3.2 as of November 22. Over the last 52-week period, shares are down 39.48%. Given that these returns are generally negative, long-term shareholders are likely upset going into this earnings release.
Analyst Insights on 3D Sys
Understanding market sentiments and expectations within the industry is crucial for investors. This analysis delves into the latest insights on 3D Sys.
With 3 analyst ratings, 3D Sys has a consensus rating of Buy. The average one-year price target is $3.25, indicating a potential 1.56% upside.
Peer Ratings Comparison
The below comparison of the analyst ratings and average 1-year price targets of and 3D Sys, three prominent players in the industry, gives insights for their relative performance expectations and market positioning.
Key Findings: Peer Analysis Summary
The peer analysis summary outlines pivotal metrics for and 3D Sys, demonstrating their respective standings within the industry and offering valuable insights into their market positions and comparative performance.
| Company | Consensus | Revenue Growth | Gross Profit | Return on Equity |
|---|---|---|---|---|
| 3D Sys | Buy | -11.66% | $47.10M | -6.90% |
Key Takeaway:
3D Sys is at the bottom for Revenue Growth, with a decrease of 11.66%. It also ranks lowest for Gross Profit at $47.10M. Additionally, it has the lowest Return on Equity at -6.90%. Overall, 3D Sys is positioned at the bottom compared to its peers across all metrics.
Discovering 3D Sys: A Closer Look
3D Systems Corp provides comprehensive 3D printing and digital manufacturing solutions, including 3D printers for plastics and metals, materials, software, on-demand manufacturing services, and digital design tools. The company’s segments include Healthcare Solutions and Industrial Solutions. It generates maximum revenue from the Industrial segment. It conducts business through various offices and facilities located throughout the Americas, EMEA, and APAC; generating a vast majority of revenues from the Americas.
3D Sys: Delving into Financials
Market Capitalization Analysis: Positioned below industry benchmarks, the company’s market capitalization faces constraints in size. This could be influenced by factors such as growth expectations or operational capacity.
Revenue Challenges: 3D Sys’s revenue growth over 3 months faced difficulties. As of 30 June, 2024, the company experienced a decline of approximately -11.66%. This indicates a decrease in top-line earnings. When compared to others in the Industrials sector, the company faces challenges, achieving a growth rate lower than the average among peers.
Net Margin: 3D Sys’s financial strength is reflected in its exceptional net margin, which exceeds industry averages. With a remarkable net margin of -24.07%, the company showcases strong profitability and effective cost management.
Return on Equity (ROE): 3D Sys’s ROE lags behind industry averages, suggesting challenges in maximizing returns on equity capital. With an ROE of -6.9%, the company may face hurdles in achieving optimal financial performance.
Return on Assets (ROA): 3D Sys’s ROA is below industry standards, pointing towards difficulties in efficiently utilizing assets. With an ROA of -3.25%, the company may encounter challenges in delivering satisfactory returns from its assets.
Debt Management: The company faces challenges in debt management with a debt-to-equity ratio higher than the industry average. With a ratio of 0.72, caution is advised due to increased financial risk.
To track all earnings releases for 3D Sys visit their earnings calendar on our site.
This article was generated by Benzinga’s automated content engine and reviewed by an editor.
© 2024 Benzinga.com. Benzinga does not provide investment advice. All rights reserved.
This Nio Analyst Turns Bearish; Here Are Top 5 Downgrades For Monday
Top Wall Street analysts changed their outlook on these top names. For a complete view of all analyst rating changes, including upgrades and downgrades, please see our analyst ratings page.
- Goldman Sachs analyst Robert Cox downgraded Arthur J. Gallagher & Co. AJG from Buy to Neutral and maintained the price target of $313. Arthur J. Gallagher shares closed at $304.29 on Friday. See how other analysts view this stock.
- Citigroup analyst Keith Horowitz downgraded the rating for M&T Bank Corporation MTB from Buy to Neutral but raised the price target from $220 to $230. M&T Bank shares closed at $221.12 on Friday. See how other analysts view this stock.
- Telsey Advisory Group analyst Joseph Feldman downgraded Five Below, Inc. FIVE from Outperform to Market Perform and lowered the price target from $102 to $95. Five Below shares closed at $86.92 on Friday. See how other analysts view this stock.
- Wells Fargo analyst Stephen Baxter downgraded the rating for HCA Healthcare, Inc. HCA from Equal-Weight to Underweight and slashed the price target from $400 to $320. HCA Healthcare shares closed at $324.93 on Friday. See how other analysts view this stock.
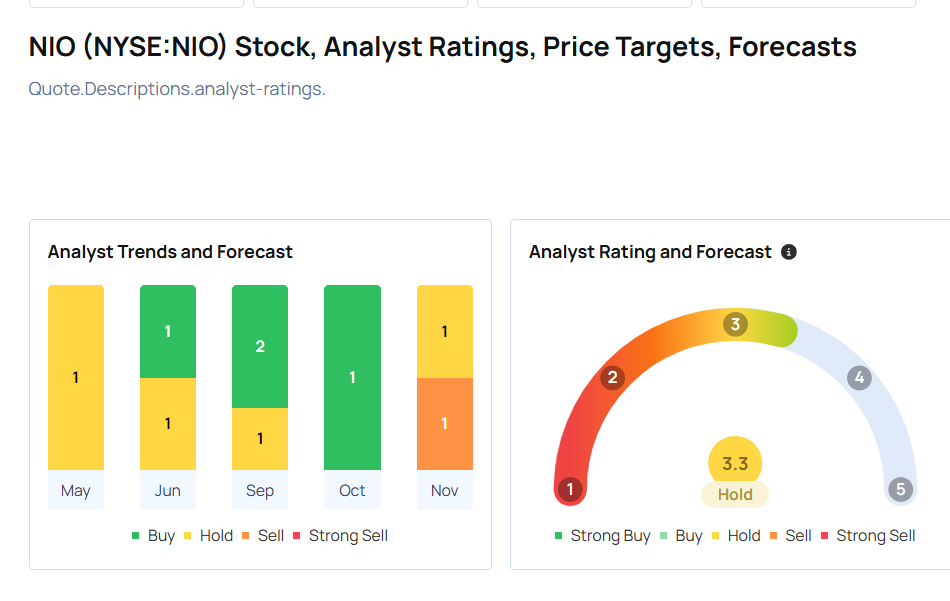
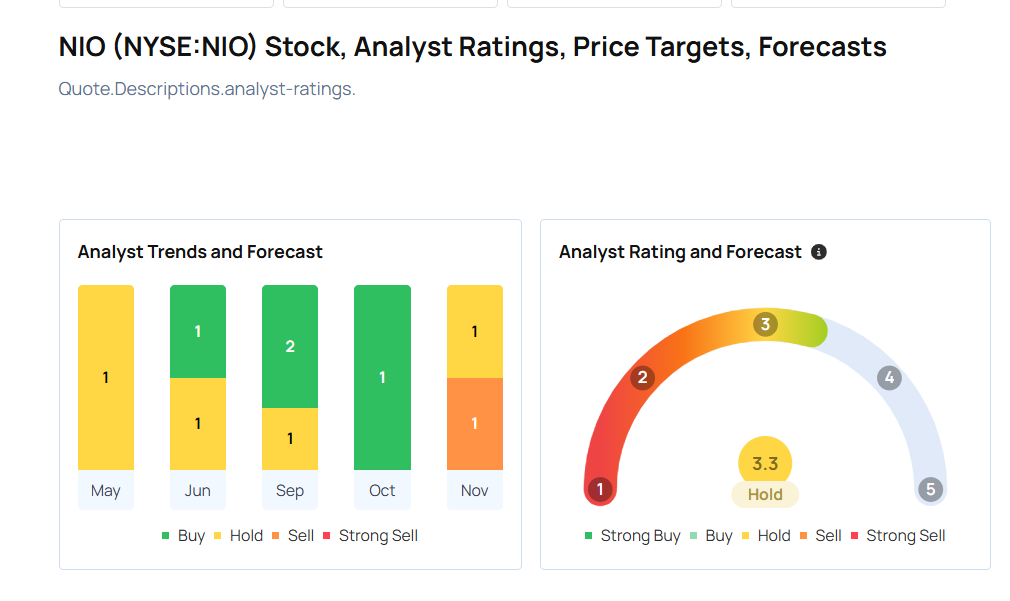
- Goldman Sachs analyst Tina Hou downgraded NIO Inc. NIO from Neutral to Sell and lowered the price target from $4.8 to $3.9. Nio shares closed at $4.84 on Friday. See how other analysts view this stock.
Considering buying NIO stock? Here’s what analysts think:
Read This Next:
Market News and Data brought to you by Benzinga APIs
© 2024 Benzinga.com. Benzinga does not provide investment advice. All rights reserved.

