Uncovering Potential: Hooker Furnishings's Earnings Preview
Hooker Furnishings HOFT is preparing to release its quarterly earnings on Thursday, 2024-12-05. Here’s a brief overview of what investors should keep in mind before the announcement.
Analysts expect Hooker Furnishings to report an earnings per share (EPS) of $0.31.
The announcement from Hooker Furnishings is eagerly anticipated, with investors seeking news of surpassing estimates and favorable guidance for the next quarter.
It’s worth noting for new investors that guidance can be a key determinant of stock price movements.
Past Earnings Performance
During the last quarter, the company reported an EPS missed by $0.06, leading to a 1.07% drop in the share price on the subsequent day.
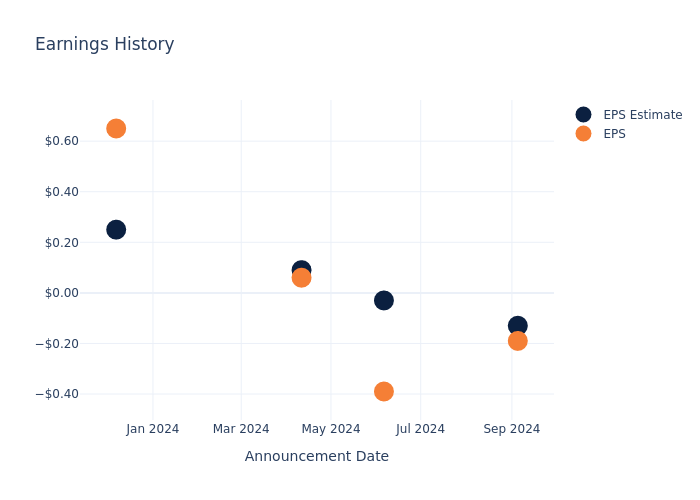
Here’s a look at Hooker Furnishings’s past performance and the resulting price change:
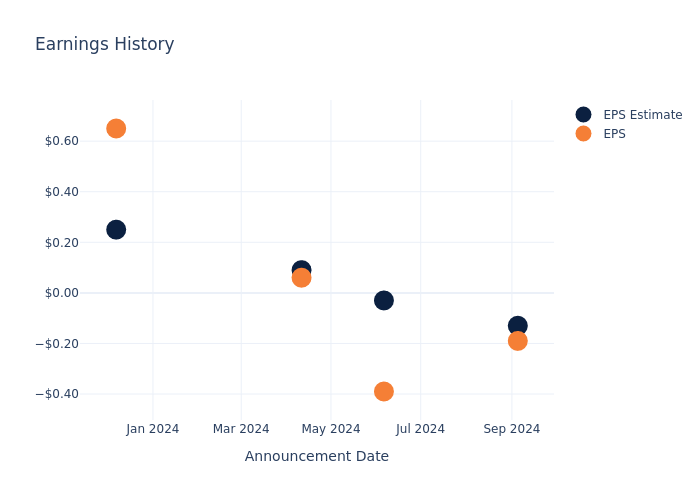
| Quarter | Q2 2025 | Q1 2025 | Q4 2024 | Q3 2024 |
|---|---|---|---|---|
| EPS Estimate | -0.13 | -0.03 | 0.09 | 0.25 |
| EPS Actual | -0.19 | -0.39 | 0.06 | 0.65 |
| Price Change % | -1.0% | -3.0% | -12.0% | 5.0% |
Performance of Hooker Furnishings Shares
Shares of Hooker Furnishings were trading at $18.19 as of December 03. Over the last 52-week period, shares are down 19.34%. Given that these returns are generally negative, long-term shareholders are likely a little upset going into this earnings release.
To track all earnings releases for Hooker Furnishings visit their earnings calendar on our site.
This article was generated by Benzinga’s automated content engine and reviewed by an editor.
Market News and Data brought to you by Benzinga APIs
© 2024 Benzinga.com. Benzinga does not provide investment advice. All rights reserved.
Community Development Leaders Propose a New Paradigm for Community Development Finance
WASHINGTON, DC, Dec. 04, 2024 (GLOBE NEWSWIRE) — David Fukuzawa, Nancy O. Andrews, and Rebecca Steinitz today announced the release of their highly anticipated article, “A New Blueprint for Financing Community Development,” published by Stanford Social Innovation Review. This insightful work proposes a new paradigm for community development that prioritizes impact over scale, emphasizes flexible and creative financing strategies, and empowers community voice.
Key Highlights of “A New Blueprint for Financing Community Development”:
- In prior decades, an overreliance on markets to drive social solutions led to investment practices that too often mirrored market conservatism in prioritizing scale over social mission and devaluing customized, community-based solutions.
- The new paradigm, by contrast, prioritizes equity, flexible responses to local needs, and community involvement. It calls for community development finance to reframe the role of capital technicians and the market, rebalance power relationships, and prioritize community voice. It holds that the field should actively embrace power sharing with community development practitioners who are not financiers. Finally, it asks philanthropy to support these strategic shifts with patient, long-term capital that places trust in the communities it aims to serve.
- The article analyzes the successes and limitations of the last 40 years of community development finance, offers a set of principles for a new way of doing business, and describes how innovative organizations and partnerships are putting those principles into practice.
About the Authors:
David Fukuzawa is a strategic advisor and former managing director at the Kresge Foundation.
Nancy O. Andrews is a fellow at Stanford University’s Distinguished Careers Institute and former president and CEO of the Low Income Investment Fund.
Rebecca Steinitz is a writer and communications and learning consultant for schools and nonprofits, including the Center for Community Investment.
“A New Blueprint for Financing Community Development,” is available at A New Paradigm for Community Development Finance.
Available for Interviews:
David Fukuzawa: dfukuzawa44@gmail.com
Nancy O. Andrews: nancyoandrews@gmail.com
Rebecca Steinitz: rsteinitz@gmail.com
###
ABOUT THE CENTER FOR COMMUNITY INVESTMENT
The Center for Community Investment (CCI) at Rockefeller Philanthropy Advisors works to ensure that all communities, especially those that have suffered from structural racism and policies that have left them economically and socially isolated, can unlock the capital they need to thrive. Our work is supported by the Robert Wood Johnson Foundation, The Kresge Foundation, JPMorgan Chase & Co, and The California Endowment. centerforcommunityinvestment.org | @C4CInvest
ABOUT ROCKEFELLER PHILANTHROPY ADVISORS
Rockefeller Philanthropy Advisors (RPA) accelerates philanthropy in pursuit of a just world. Continuing the Rockefeller family’s legacy of thoughtful, effective philanthropy, RPA is a global nonprofit at the forefront of philanthropic growth and innovation, with a diverse team of experienced grantmakers with significant depth of knowledge across the spectrum of issue areas. Founded in 2002, RPA has grown into one of the world’s largest philanthropic service organizations and has facilitated more than $4 billion in grantmaking to more than 70 countries. RPA currently advises on and manages more than $600 million in annual giving by individuals, families, foundations, and corporations. RPA also serves as a fiscal sponsor for over 100 projects, providing governance, management, and operational infrastructure to support their charitable purposes. rockpa.org | @RockPhilanth

Janelle Julien
Center for Community Investment
2404630578
jjulien@centerforcommunitydevelopment.org
Market News and Data brought to you by Benzinga APIs
© 2024 Benzinga.com. Benzinga does not provide investment advice. All rights reserved.
IRG Continues Portfolio Expansion Acquiring Significant Waterfront Facility Along Houston Ship Channel
HOUSTON, Dec. 4, 2024 /PRNewswire/ — Industrial Realty Group, LLC (IRG), one of the country’s largest owners of commercial and industrial properties, announced today that it has acquired a 221,879 square foot industrial manufacturing facility at 16730 Jacintoport Boulevard, along the Houston Ship Channel.
The project currently has 91,229 square feet available for lease and approximately 10 acres for storage or expansion.
The 21-acre site includes multiple structures with a barge dock, nine cranes, 30′ clearance, heavy power, and potential rail connection. It is strategically located to reduce waterway transit times. The site also features 800′ of frontage on the channel and the ability to add a deepwater dock for bulk vessels.
“The project’s positioning at the mouth of the Houston Ship Channel and its ability to serve as a point of entry through Houston make it unique in the market,” said Justin Lichter, Chief Investment Officer of IRG. “IRG is engaging companies that are eager to join the business-friendly market in Texas and explore both domestic and international import/export opportunities.”
The project is IRG’s second acquisition in Houston in recent years. IRG’s holdings in Texas now total nearly 1.2 million square feet.
The project currently has 91,229 square feet available for lease and approximately 10 acres for outdoor storage or expansion. For leasing inquiries, contact Justin Lichter at jlichter@industrialrealtygroup.com.
About IRG
IRG is a nationwide real estate development and investment firm specializing in the acquisition, development and management of commercial and industrial real estate throughout the United States. IRG, through its affiliated partnerships and limited liability companies, operates a portfolio containing over 150 properties in 31 states with over 100 million square feet of rentable space. IRG is nationally recognized as a leading force behind the adaptive reuse of commercial and industrial real estate, solving some of America’s most difficult real estate challenges.
Learn more at www.industrialrealtygroup.com.
Media Contact:
Lauren Crumrine, Vice President of Marketing
Industrial Realty Group, LLC
614-562-9252
lcrumrine@industrialrealtygroup.com
![]() View original content:https://www.prnewswire.com/news-releases/irg-continues-portfolio-expansion-acquiring-significant-waterfront-facility-along-houston-ship-channel-302322641.html
View original content:https://www.prnewswire.com/news-releases/irg-continues-portfolio-expansion-acquiring-significant-waterfront-facility-along-houston-ship-channel-302322641.html
SOURCE Industrial Realty Group, LLC
Market News and Data brought to you by Benzinga APIs
© 2024 Benzinga.com. Benzinga does not provide investment advice. All rights reserved.
Long-Term Treasury ETFs Hit Death Cross As Yields Rise, Bonds Tumble
It’s been a wild ride for long-term Treasury ETFs lately, and it’s looking like they might have hit a rough patch. Following months of declining interest rates, yields on U.S. Treasurys reversed course in October, and the charts are now flashing a warning: the dreaded Death Cross is looming.
For those who aren’t familiar, the Death Cross occurs when the short-term moving average (such as the 50-day) crosses below the long-term moving average (like the 200-day).
And that’s exactly what’s been happening for a trio of heavy hitters in the bond market: iShares 20+ Year Treasury Bond ETF TLT, Vanguard Long-Term Treasury ETF VGLT, and US Treasury 30 Year Bond ETF UTHY.
The recent surge in long-end yields, after months of decline, has turned this segment of the market into a hotbed of concern. The 10-year U.S. Treasury note yield, which fell to a low of 3.63% in September, jumped more than 0.80% as the Federal Reserve cut the federal funds target rate in September and November.
Read Also: Viking Therapeutics Stock On Brink Of Death Cross As Weight Loss Hype Loses Momentum
The result? A sharp inverse reaction in Treasury bond prices, and unfortunately, for these ETFs, that’s a price decline.
Let’s break it down:
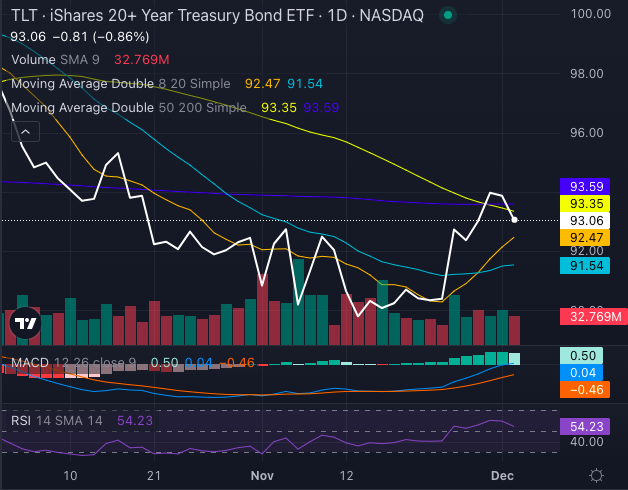
- iShares 20+ Year Treasury Bond ETF: Once a star of the bond world, this ETF now has its 50-day simple moving average below its 200-day. And while it’s seeing a bit of buying pressure, the bearish signals on the chart indicate a downward trend that could be setting up. With a stock price at $93.06 and RSI at 54.23, things aren’t looking rosy for this long-duration bond fund.
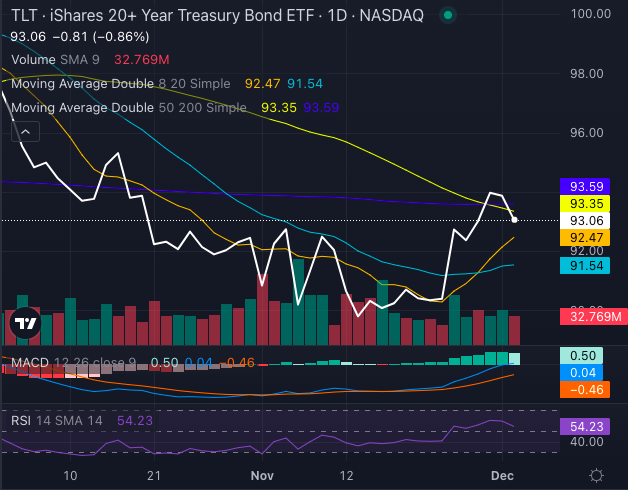
Chart created using Benzinga Pro
- Vanguard Long-Term Treasury ETF: This ETF is in the same boat, with its 50-day moving average below the 200-day. It has a similar chart pattern to iShares 20+ Year Treasury Bond ETF and shows potential for future bearish movement as the market contemplates further interest rate hikes. At $58.48 and an RSI of 54, it’s hard to argue against the bearish signals forming.
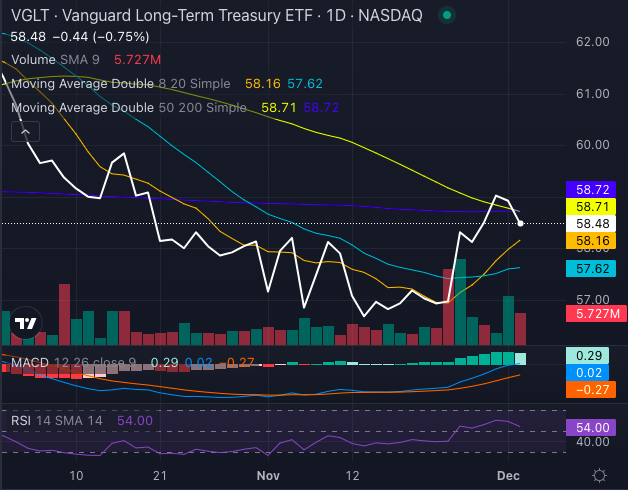
Chart created using Benzinga Pro
- U.S. Treasury 30 Year Bond ETF: Last but not least, this ETF is also struggling to hold onto its gains. Its price at $44.35 isn’t enough to offset the pressure from the moving averages. Although the short-term outlook has some bullish signs, the 50-day SMA crossing below the 200-day indicates a tough road ahead.
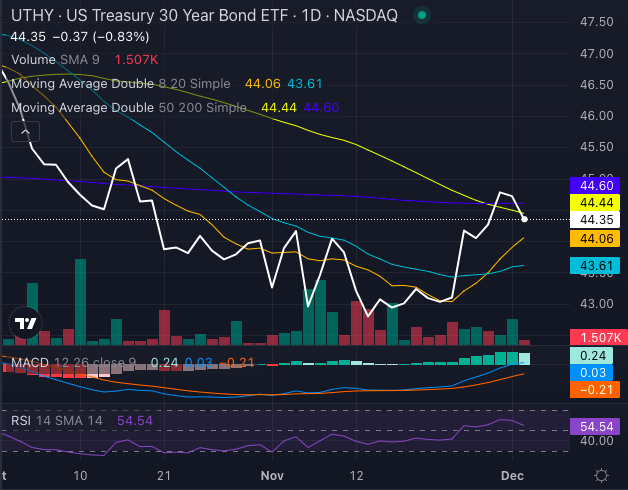
Chart created using Benzinga Pro
With a surge in long-term Treasury yields, it’s clear that the long bond party might be winding down. Investors betting on these ETFs are facing an uphill battle, and a higher interest rate environment seems to be taking its toll.
For those holding these three ETFs, it might be time to re-evaluate your exposure to these long-duration bonds before the Death Cross turns into a market-wide plunge.
Read Next:
Photo: Shutterstock
Market News and Data brought to you by Benzinga APIs
© 2024 Benzinga.com. Benzinga does not provide investment advice. All rights reserved.
Insights into Lakeland Industries's Upcoming Earnings
Lakeland Industries LAKE is preparing to release its quarterly earnings on Thursday, 2024-12-05. Here’s a brief overview of what investors should keep in mind before the announcement.
Analysts expect Lakeland Industries to report an earnings per share (EPS) of $0.38.
The market awaits Lakeland Industries’s announcement, with hopes high for news of surpassing estimates and providing upbeat guidance for the next quarter.
It’s important for new investors to understand that guidance can be a significant driver of stock prices.
Overview of Past Earnings
During the last quarter, the company reported an EPS missed by $0.54, leading to a 7.82% drop in the share price on the subsequent day.
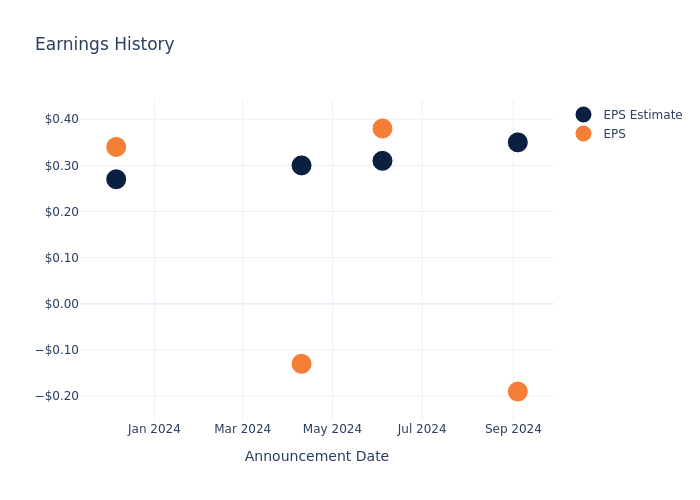
Here’s a look at Lakeland Industries’s past performance and the resulting price change:
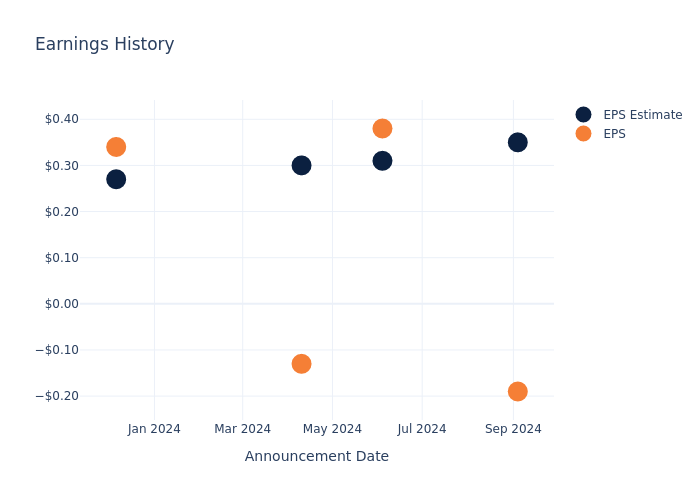
| Quarter | Q2 2025 | Q1 2025 | Q4 2024 | Q3 2024 |
|---|---|---|---|---|
| EPS Estimate | 0.35 | 0.31 | 0.30 | 0.27 |
| EPS Actual | -0.19 | 0.38 | -0.13 | 0.34 |
| Price Change % | -8.0% | 9.0% | -5.0% | 3.0% |
Market Performance of Lakeland Industries’s Stock
Shares of Lakeland Industries were trading at $22.4 as of December 03. Over the last 52-week period, shares are up 48.69%. Given that these returns are generally positive, long-term shareholders are likely bullish going into this earnings release.
To track all earnings releases for Lakeland Industries visit their earnings calendar on our site.
This article was generated by Benzinga’s automated content engine and reviewed by an editor.
Market News and Data brought to you by Benzinga APIs
© 2024 Benzinga.com. Benzinga does not provide investment advice. All rights reserved.
Looking At Dick's Sporting Goods's Recent Unusual Options Activity
High-rolling investors have positioned themselves bullish on Dick’s Sporting Goods DKS, and it’s important for retail traders to take note.
This activity came to our attention today through Benzinga’s tracking of publicly available options data. The identities of these investors are uncertain, but such a significant move in DKS often signals that someone has privileged information.
Today, Benzinga’s options scanner spotted 8 options trades for Dick’s Sporting Goods. This is not a typical pattern.
The sentiment among these major traders is split, with 50% bullish and 37% bearish. Among all the options we identified, there was one put, amounting to $37,402, and 7 calls, totaling $468,416.
Predicted Price Range
Taking into account the Volume and Open Interest on these contracts, it appears that whales have been targeting a price range from $195.0 to $220.0 for Dick’s Sporting Goods over the last 3 months.
Volume & Open Interest Trends
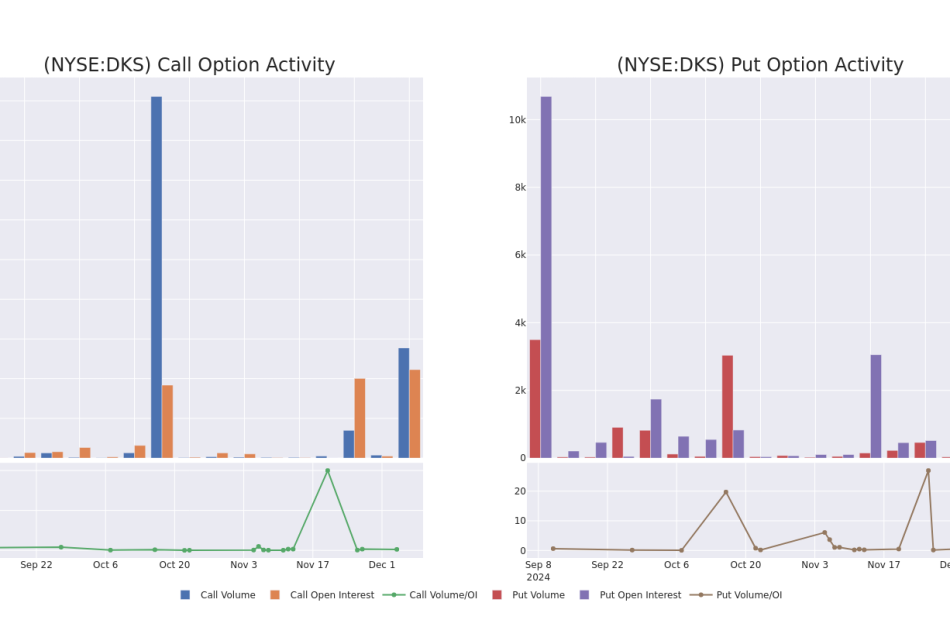
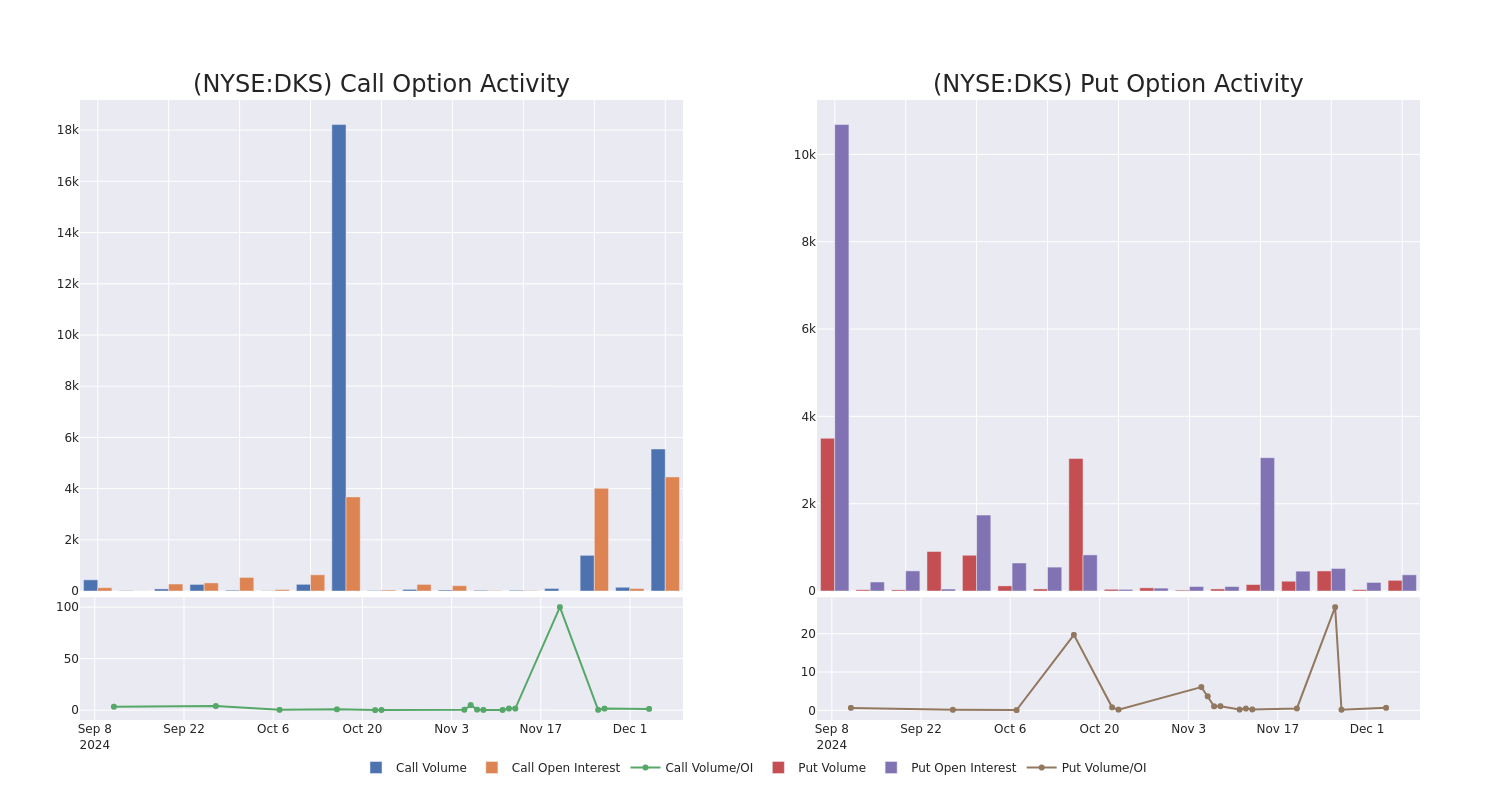
Looking at the volume and open interest is a powerful move while trading options. This data can help you track the liquidity and interest for Dick’s Sporting Goods’s options for a given strike price. Below, we can observe the evolution of the volume and open interest of calls and puts, respectively, for all of Dick’s Sporting Goods’s whale trades within a strike price range from $195.0 to $220.0 in the last 30 days.
Dick’s Sporting Goods Call and Put Volume: 30-Day Overview
Biggest Options Spotted:
| Symbol | PUT/CALL | Trade Type | Sentiment | Exp. Date | Ask | Bid | Price | Strike Price | Total Trade Price | Open Interest | Volume |
|---|---|---|---|---|---|---|---|---|---|---|---|
| DKS | CALL | SWEEP | BEARISH | 12/06/24 | $2.35 | $1.5 | $1.7 | $212.50 | $100.3K | 1.5K | 1.5K |
| DKS | CALL | SWEEP | BULLISH | 03/21/25 | $14.4 | $14.3 | $14.3 | $220.00 | $92.9K | 364 | 65 |
| DKS | CALL | SWEEP | BULLISH | 12/06/24 | $1.7 | $1.5 | $1.7 | $212.50 | $80.4K | 1.5K | 993 |
| DKS | CALL | SWEEP | BEARISH | 12/06/24 | $1.7 | $1.35 | $1.7 | $212.50 | $79.4K | 1.5K | 497 |
| DKS | CALL | SWEEP | BULLISH | 01/17/25 | $6.6 | $6.3 | $6.6 | $220.00 | $46.2K | 2.4K | 249 |
About Dick’s Sporting Goods
Dick’s Sporting Goods retails athletic apparel, footwear, and equipment for sports. Dick’s operates digital platforms, about 725 stores under its namesake brand (including outlet stores and House of Sport), and about 130 specialty stores under the Golf Galaxy and Public Lands nameplates. Dick’s carries private-label merchandise and national brands such as Nike, The North Face, Under Armour, Callaway Golf, and TaylorMade. Based in the Pittsburgh area, Dick’s was founded in 1948 by the father of current executive chairman and controlling shareholder Edward Stack.
Following our analysis of the options activities associated with Dick’s Sporting Goods, we pivot to a closer look at the company’s own performance.
Dick’s Sporting Goods’s Current Market Status
- With a trading volume of 415,154, the price of DKS is up by 1.07%, reaching $211.74.
- Current RSI values indicate that the stock is may be approaching overbought.
- Next earnings report is scheduled for 99 days from now.
Expert Opinions on Dick’s Sporting Goods
In the last month, 4 experts released ratings on this stock with an average target price of $250.75.
Turn $1000 into $1270 in just 20 days?
20-year pro options trader reveals his one-line chart technique that shows when to buy and sell. Copy his trades, which have had averaged a 27% profit every 20 days. Click here for access.
* An analyst from Loop Capital persists with their Hold rating on Dick’s Sporting Goods, maintaining a target price of $225.
* An analyst from Telsey Advisory Group has decided to maintain their Outperform rating on Dick’s Sporting Goods, which currently sits at a price target of $260.
* In a positive move, an analyst from UBS has upgraded their rating to Buy and adjusted the price target to $260.
* An analyst from Truist Securities has decided to maintain their Buy rating on Dick’s Sporting Goods, which currently sits at a price target of $258.
Trading options involves greater risks but also offers the potential for higher profits. Savvy traders mitigate these risks through ongoing education, strategic trade adjustments, utilizing various indicators, and staying attuned to market dynamics. Keep up with the latest options trades for Dick’s Sporting Goods with Benzinga Pro for real-time alerts.
Market News and Data brought to you by Benzinga APIs
© 2024 Benzinga.com. Benzinga does not provide investment advice. All rights reserved.
Options Movement At Graco: Peter OShea Exercises Worth $1.01M
Disclosed in a recent SEC filing on December 4, OShea, President at Graco GGG, made a noteworthy transaction involving the exercise of company stock options.
What Happened: A Form 4 filing from the U.S. Securities and Exchange Commission on Wednesday showed that OShea, President at Graco, a company in the Industrials sector, just exercised stock options worth 15,000 shares of GGG stock with an exercise price of $23.85.
During Wednesday’s morning session, Graco shares down by 0.11%, currently priced at $90.91. Considering the current price, OShea’s 15,000 shares have a total value of $1,005,886.
Unveiling the Story Behind Graco
Graco manufactures equipment used for managing fluids, coatings, and adhesives, specializing in difficult-to-handle materials. Graco’s business is organized into three segments: industrial, process, and contractor. The Minnesota-based firm serves a wide range of end markets, including industrial, automotive, and construction, and its broad array of products include pumps, valves, meters, sprayers, and equipment used to apply coatings, sealants, and adhesives. The firm generated roughly $2.2 billion in sales in 2023.
Key Indicators: Graco’s Financial Health
Revenue Growth: Graco’s revenue growth over a period of 3 months has faced challenges. As of 30 September, 2024, the company experienced a revenue decline of approximately -3.79%. This indicates a decrease in the company’s top-line earnings. As compared to competitors, the company encountered difficulties, with a growth rate lower than the average among peers in the Industrials sector.
Evaluating Earnings Performance:
-
Gross Margin: Achieving a high gross margin of 53.18%, the company performs well in terms of cost management and profitability within its sector.
-
Earnings per Share (EPS): Graco’s EPS is below the industry average, signaling challenges in bottom-line performance with a current EPS of 0.72.
Debt Management: With a below-average debt-to-equity ratio of 0.02, Graco adopts a prudent financial strategy, indicating a balanced approach to debt management.
In-Depth Valuation Examination:
-
Price to Earnings (P/E) Ratio: With a higher-than-average P/E ratio of 32.16, Graco’s stock is perceived as being overvalued in the market.
-
Price to Sales (P/S) Ratio: With a higher-than-average P/S ratio of 7.35, Graco’s stock is perceived as being overvalued in the market, particularly in relation to sales performance.
-
EV/EBITDA Analysis (Enterprise Value to its Earnings Before Interest, Taxes, Depreciation & Amortization): Boasting an EV/EBITDA ratio of 21.89, Graco demonstrates a robust market valuation, outperforming industry benchmarks.
Market Capitalization Analysis: Falling below industry benchmarks, the company’s market capitalization reflects a reduced size compared to peers. This positioning may be influenced by factors such as growth expectations or operational capacity.
Now trade stocks online commission free with Charles Schwab, a trusted and complete investment firm.
Understanding the Significance of Insider Transactions
It’s important to note that insider transactions alone should not dictate investment decisions, but they can provide valuable insights.
In the realm of legality, an “insider” is defined as any officer, director, or beneficial owner holding more than ten percent of a company’s equity securities under Section 12 of the Securities Exchange Act of 1934. This includes executives in the c-suite and major hedge funds. These insiders are required to disclose their transactions through a Form 4 filing, to be submitted within two business days of the transaction.
Notably, when a company insider makes a new purchase, it is considered an indicator of their positive expectations for the stock.
Conversely, insider sells may not necessarily signal a bearish stance on the stock and can be motivated by various factors.
Breaking Down the Significance of Transaction Codes
Taking a closer look at transactions, investors often prioritize those unfolding in the open market, meticulously cataloged in Table I of the Form 4 filing. A P in Box 3 denotes a purchase, while S signifies a sale. Transaction code C denotes the conversion of an option, and transaction code A signifies a grant, award, or other acquisition of securities from the company.
Check Out The Full List Of Graco’s Insider Trades.
Insider Buying Alert: Profit from C-Suite Moves
Benzinga Edge reveals every insider trade in real-time. Don’t miss the next big stock move driven by insider confidence. Unlock this ultimate sentiment indicator now. Click here for access.
This article was generated by Benzinga’s automated content engine and reviewed by an editor.
© 2024 Benzinga.com. Benzinga does not provide investment advice. All rights reserved.
Methode Electronics Earnings Preview
Methode Electronics MEI will release its quarterly earnings report on Thursday, 2024-12-05. Here’s a brief overview for investors ahead of the announcement.
Analysts anticipate Methode Electronics to report an earnings per share (EPS) of $-0.15.
The market awaits Methode Electronics’s announcement, with hopes high for news of surpassing estimates and providing upbeat guidance for the next quarter.
It’s important for new investors to understand that guidance can be a significant driver of stock prices.
Historical Earnings Performance
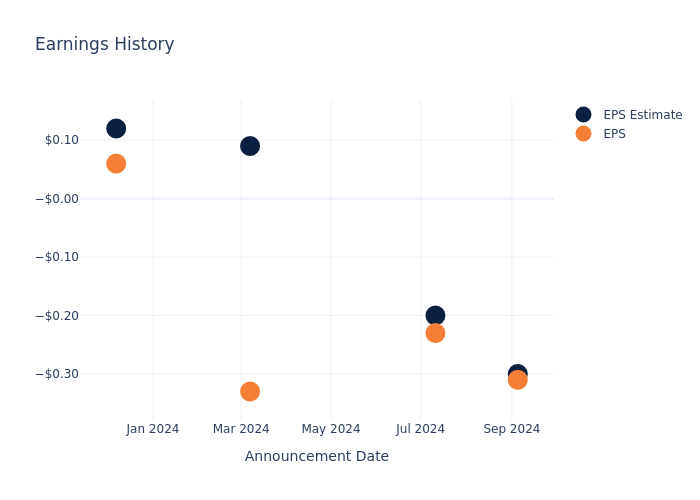
Last quarter the company missed EPS by $0.01, which was followed by a 5.8% drop in the share price the next day.
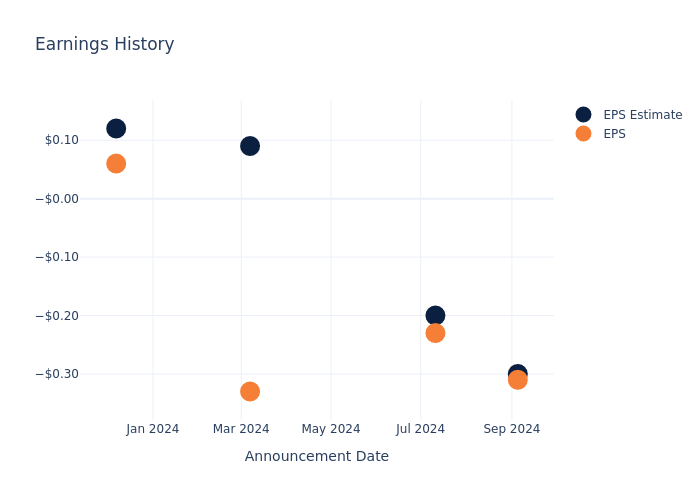
Here’s a look at Methode Electronics’s past performance and the resulting price change:
| Quarter | Q1 2025 | Q4 2024 | Q3 2024 | Q2 2024 |
|---|---|---|---|---|
| EPS Estimate | -0.30 | -0.20 | 0.09 | 0.12 |
| EPS Actual | -0.31 | -0.23 | -0.33 | 0.06 |
| Price Change % | -6.0% | 1.0% | -3.0% | -3.0% |
Tracking Methode Electronics’s Stock Performance
Shares of Methode Electronics were trading at $11.09 as of December 03. Over the last 52-week period, shares are down 48.49%. Given that these returns are generally negative, long-term shareholders are likely upset going into this earnings release.
Analyst Observations about Methode Electronics
For investors, grasping market sentiments and expectations in the industry is vital. This analysis explores the latest insights regarding Methode Electronics.
A total of 1 analyst ratings have been received for Methode Electronics, with the consensus rating being Neutral. The average one-year price target stands at $13.0, suggesting a potential 17.22% upside.
Understanding Analyst Ratings Among Peers
This comparison focuses on the analyst ratings and average 1-year price targets of Neonode, RF Industries and Benchmark Electronics, three major players in the industry, shedding light on their relative performance expectations and market positioning.
- For Neonode, analysts project an Buy trajectory, with an average 1-year price target of $16.5, indicating a potential 48.78% upside.
- The consensus among analysts is an Buy trajectory for RF Industries, with an average 1-year price target of $4.5, indicating a potential 59.42% downside.
- For Benchmark Electronics, analysts project an Buy trajectory, with an average 1-year price target of $48.0, indicating a potential 332.82% upside.
Comprehensive Peer Analysis Summary
In the peer analysis summary, key metrics for Neonode, RF Industries and Benchmark Electronics are highlighted, providing an understanding of their respective standings within the industry and offering insights into their market positions and comparative performance.
| Company | Consensus | Revenue Growth | Gross Profit | Return on Equity |
|---|---|---|---|---|
| Methode Electronics | Neutral | -10.77% | $44.60M | -2.42% |
| Neonode | Buy | -0.24% | $815K | -6.94% |
| RF Industries | Buy | 7.56% | $4.96M | -2.05% |
| Benchmark Electronics | Buy | -8.61% | $66.74M | 1.40% |
Key Takeaway:
Methode Electronics ranks at the bottom for Revenue Growth among its peers. It also ranks at the bottom for Gross Profit. However, it ranks in the middle for Return on Equity.
Unveiling the Story Behind Methode Electronics
Methode Electronics Inc makes component and subsystem devices employing electrical, radio remote control, electronic, wireless, and sensing technologies. The firm is organized into various business segments: Automotive, Industrial, Interface, and Medical. The Automotive segment which generates maximum revenue, supplies electronic and electro-mechanical devices and related products to automobiles. The products manufactured in the automotive segment include overhead and center consoles, hidden and ergonomic switches, insert molded components, LED-based lighting, and sensors. Geographically, the company generates maximum revenue from North America and the rest from Europe, the Middle East & Africa (EMEA), and Asia.
Financial Insights: Methode Electronics
Market Capitalization Perspectives: The company’s market capitalization falls below industry averages, signaling a relatively smaller size compared to peers. This positioning may be influenced by factors such as perceived growth potential or operational scale.
Negative Revenue Trend: Examining Methode Electronics’s financials over 3 months reveals challenges. As of 31 July, 2024, the company experienced a decline of approximately -10.77% in revenue growth, reflecting a decrease in top-line earnings. In comparison to its industry peers, the company trails behind with a growth rate lower than the average among peers in the Information Technology sector.
Net Margin: Methode Electronics’s financial strength is reflected in its exceptional net margin, which exceeds industry averages. With a remarkable net margin of -7.08%, the company showcases strong profitability and effective cost management.
Return on Equity (ROE): Methode Electronics’s ROE is below industry averages, indicating potential challenges in efficiently utilizing equity capital. With an ROE of -2.42%, the company may face hurdles in achieving optimal financial returns.
Return on Assets (ROA): The company’s ROA is below industry benchmarks, signaling potential difficulties in efficiently utilizing assets. With an ROA of -1.32%, the company may need to address challenges in generating satisfactory returns from its assets.
Debt Management: Methode Electronics’s debt-to-equity ratio is below the industry average at 0.43, reflecting a lower dependency on debt financing and a more conservative financial approach.
To track all earnings releases for Methode Electronics visit their earnings calendar on our site.
This article was generated by Benzinga’s automated content engine and reviewed by an editor.
© 2024 Benzinga.com. Benzinga does not provide investment advice. All rights reserved.
A Closer Look at Alibaba Gr Hldgs's Options Market Dynamics
Investors with a lot of money to spend have taken a bullish stance on Alibaba Gr Hldgs BABA.
And retail traders should know.
We noticed this today when the trades showed up on publicly available options history that we track here at Benzinga.
Whether these are institutions or just wealthy individuals, we don’t know. But when something this big happens with BABA, it often means somebody knows something is about to happen.
So how do we know what these investors just did?
Today, Benzinga‘s options scanner spotted 45 uncommon options trades for Alibaba Gr Hldgs.
This isn’t normal.
The overall sentiment of these big-money traders is split between 77% bullish and 20%, bearish.
Out of all of the special options we uncovered, 25 are puts, for a total amount of $2,165,752, and 20 are calls, for a total amount of $1,100,793.
Expected Price Movements
Analyzing the Volume and Open Interest in these contracts, it seems that the big players have been eyeing a price window from $70.0 to $180.0 for Alibaba Gr Hldgs during the past quarter.
Analyzing Volume & Open Interest
In terms of liquidity and interest, the mean open interest for Alibaba Gr Hldgs options trades today is 4901.85 with a total volume of 21,852.00.
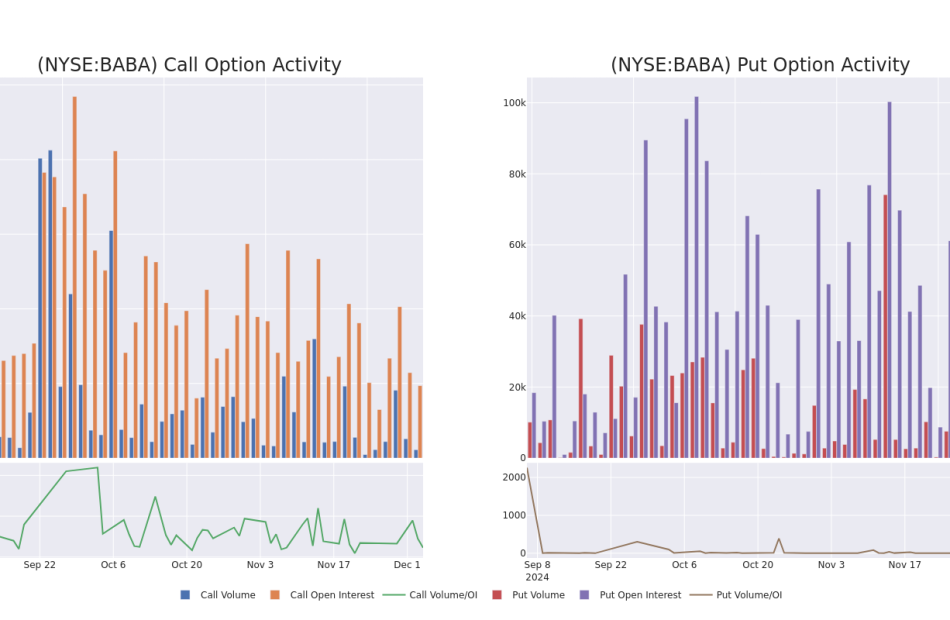
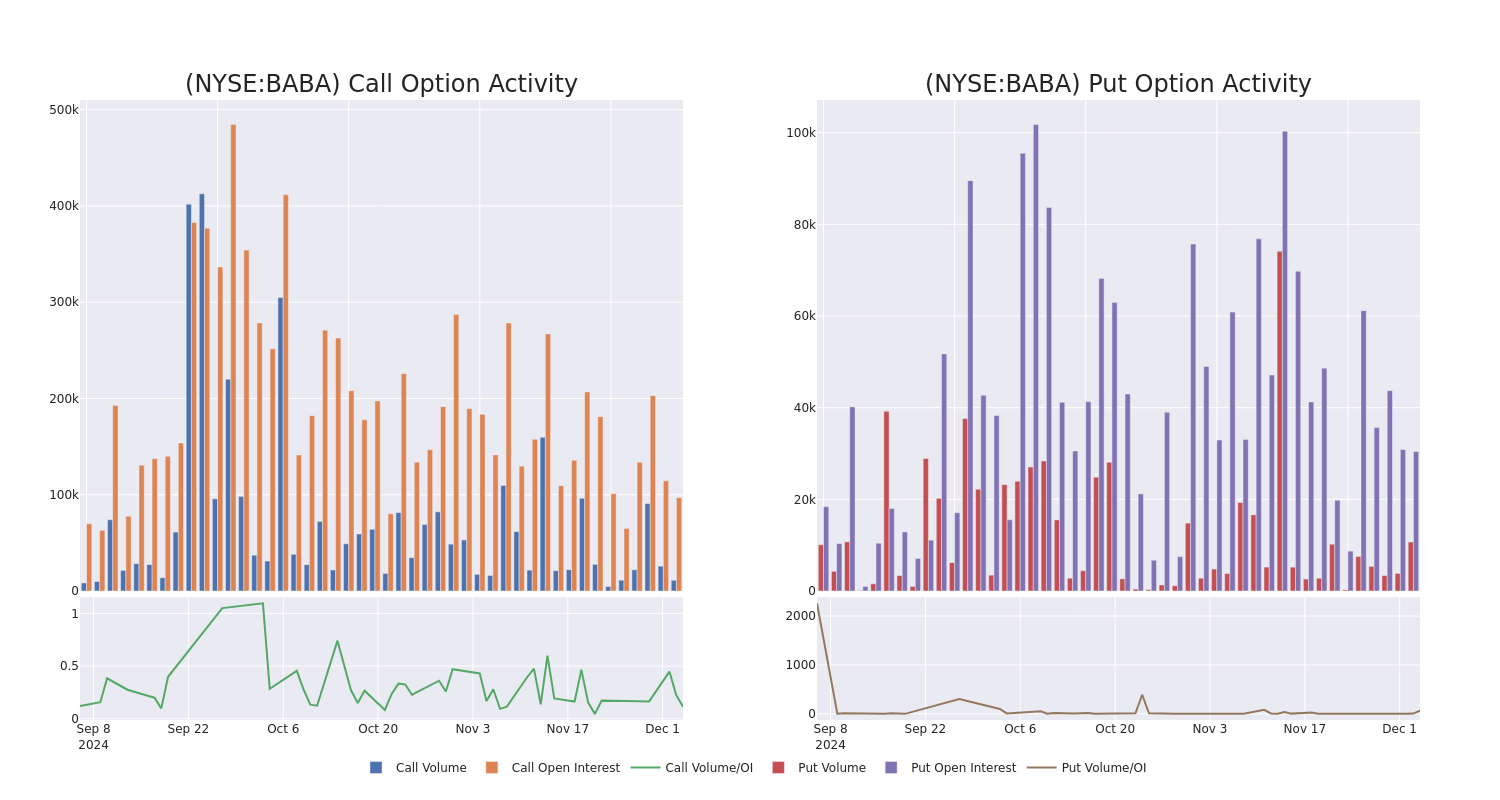
In the following chart, we are able to follow the development of volume and open interest of call and put options for Alibaba Gr Hldgs’s big money trades within a strike price range of $70.0 to $180.0 over the last 30 days.
Alibaba Gr Hldgs 30-Day Option Volume & Interest Snapshot
Largest Options Trades Observed:
| Symbol | PUT/CALL | Trade Type | Sentiment | Exp. Date | Ask | Bid | Price | Strike Price | Total Trade Price | Open Interest | Volume |
|---|---|---|---|---|---|---|---|---|---|---|---|
| BABA | PUT | TRADE | BULLISH | 06/20/25 | $4.0 | $3.85 | $3.9 | $75.00 | $780.0K | 5.1K | 2.0K |
| BABA | PUT | SWEEP | BULLISH | 09/19/25 | $36.05 | $36.0 | $36.05 | $120.00 | $472.2K | 1.0K | 136 |
| BABA | CALL | SWEEP | BULLISH | 01/17/25 | $2.39 | $2.35 | $2.39 | $90.00 | $131.6K | 20.9K | 1.4K |
| BABA | PUT | SWEEP | BULLISH | 12/20/24 | $9.95 | $9.85 | $9.85 | $94.00 | $98.5K | 24 | 205 |
| BABA | CALL | SWEEP | BULLISH | 01/17/25 | $4.3 | $4.2 | $4.3 | $85.00 | $96.7K | 14.0K | 1.5K |
About Alibaba Gr Hldgs
Alibaba is the world’s largest online and mobile commerce company as measured by gross merchandise volume. It operates China’s online marketplaces, including Taobao (consumer-to-consumer) and Tmall (business-to-consumer). The China commerce retail division is the most valuable cash flow-generating business at Alibaba. Additional revenue sources include China commerce wholesale, international commerce retail/wholesale, local consumer services, cloud computing, digital media and entertainment platforms, Cainiao logistics services, and innovation initiatives/other.
In light of the recent options history for Alibaba Gr Hldgs, it’s now appropriate to focus on the company itself. We aim to explore its current performance.
Present Market Standing of Alibaba Gr Hldgs
- Trading volume stands at 7,614,865, with BABA’s price down by -1.12%, positioned at $84.72.
- RSI indicators show the stock to be may be approaching oversold.
- Earnings announcement expected in 63 days.
What The Experts Say On Alibaba Gr Hldgs
4 market experts have recently issued ratings for this stock, with a consensus target price of $119.75.
Unusual Options Activity Detected: Smart Money on the Move
Benzinga Edge’s Unusual Options board spots potential market movers before they happen. See what positions big money is taking on your favorite stocks. Click here for access.
* An analyst from Barclays has decided to maintain their Overweight rating on Alibaba Gr Hldgs, which currently sits at a price target of $130.
* Reflecting concerns, an analyst from Benchmark lowers its rating to Buy with a new price target of $118.
* Consistent in their evaluation, an analyst from Mizuho keeps a Outperform rating on Alibaba Gr Hldgs with a target price of $113.
* In a cautious move, an analyst from Benchmark downgraded its rating to Buy, setting a price target of $118.
Trading options involves greater risks but also offers the potential for higher profits. Savvy traders mitigate these risks through ongoing education, strategic trade adjustments, utilizing various indicators, and staying attuned to market dynamics. Keep up with the latest options trades for Alibaba Gr Hldgs with Benzinga Pro for real-time alerts.
Market News and Data brought to you by Benzinga APIs
© 2024 Benzinga.com. Benzinga does not provide investment advice. All rights reserved.
Musk's $119 Billion Wealth Increase Outpaces Dell and Zuckerberg, But Guess Who's Catching Up
Elon Musk is on another level this year. The Tesla and SpaceX CEO added $119 billion to his fortune in 2024. This pushed his net worth to $348 billion. That’s not just a number. It’s more than the entire net worth of tech icon Michael Dell. Let that sink in.
Musk isn’t alone in raking it in, though. The 10 biggest wealth gainers globally have seen their fortunes grow by a combined $585 billion this year, according to the Bloomberg Billionaires Index. For context, that’s more than the market value of giants like Exxon Mobil or Oracle. Big names like Larry Ellison, Jensen Huang and Mark Zuckerberg are also on the list.
Here’s how it breaks down:
Don’t Miss:
The Big Players
Musk leads the pack, of course. His massive wealth boost comes from Tesla’s and SpaceX’s success. But Oracle’s Larry Ellison is not far behind. He added $83.2 billion to his fortune this year. Ellison’s smart bet on Tesla and Oracle’s cloud business positions him as a key player in AI and has been a gold mine. His net worth now stands at $206 billion.
Nvidia’s Jensen Huang is often referred to as the king of AI chips. He’s had a stellar year, too. Nvidia’s stock surged 187%. This added nearly $80 billion to his wealth. Huang rides the AI boom like a champ with a net worth of $124 billion.
Then there’s Zuckerberg. Meta is surging thanks to big bets on AI and the metaverse, which has added $70 billion to his wallet, bringing his total to a staggering $198 billion.
See Also: Inspired by Uber and Airbnb – Deloitte’s fastest-growing software company is transforming 7 billion smartphones into income-generating assets – with $1,000 you can invest at just $0.26/share!
Who’s Catching Up?
Jeff Bezos may not be in the headlines as much, but he’s quietly added $41.7 billion this year, driven by Amazon’s AI-focused initiatives. Walmart heirs Jim, Alice and Rob Walton joined the party, each gaining about $40 billion thanks to the retailer’s stock climbing 72% this year.
What’s Driving This?
AI and Trump’s reelection buzz are the clear winners here. From Tesla and Nvidia riding the AI wave to Meta and Oracle leveraging new technologies, it’s been a year where innovation and strategic moves paid off big time.
The Surprising Takeaway
While Musk dominates, players like Jensen Huang and the Walton siblings are making waves, too. If there’s one thing this year has shown, the wealth race isn’t just about who’s at the top – it’s about who’s making smart moves to get there.

