Whales with a lot of money to spend have taken a noticeably bearish stance on Citigroup.
Looking at options history for Citigroup C we detected 22 trades.
If we consider the specifics of each trade, it is accurate to state that 40% of the investors opened trades with bullish expectations and 59% with bearish.
From the overall spotted trades, 17 are puts, for a total amount of $1,338,929 and 5, calls, for a total amount of $403,959.
Predicted Price Range
Based on the trading activity, it appears that the significant investors are aiming for a price territory stretching from $57.5 to $77.5 for Citigroup over the recent three months.
Insights into Volume & Open Interest
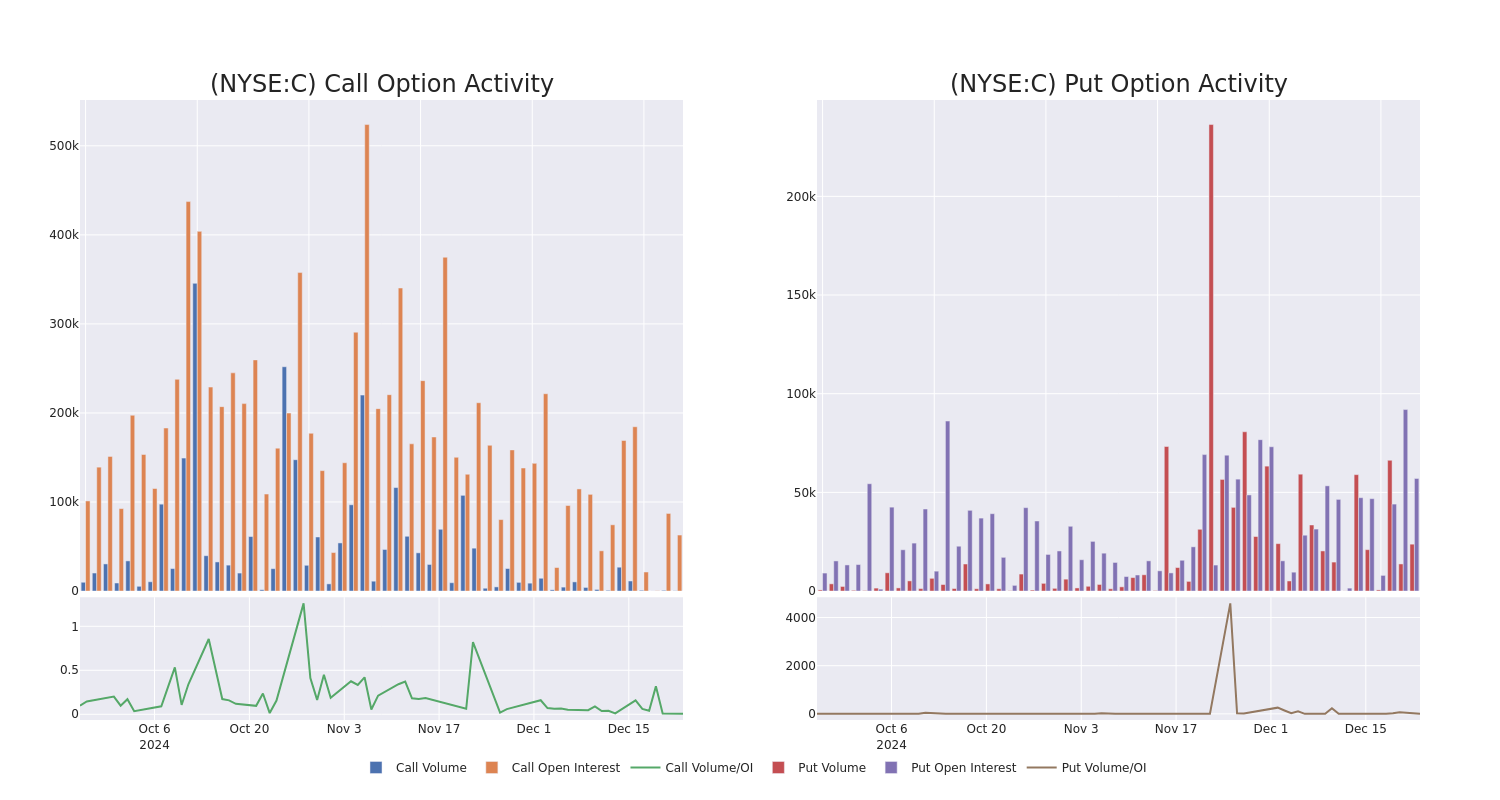
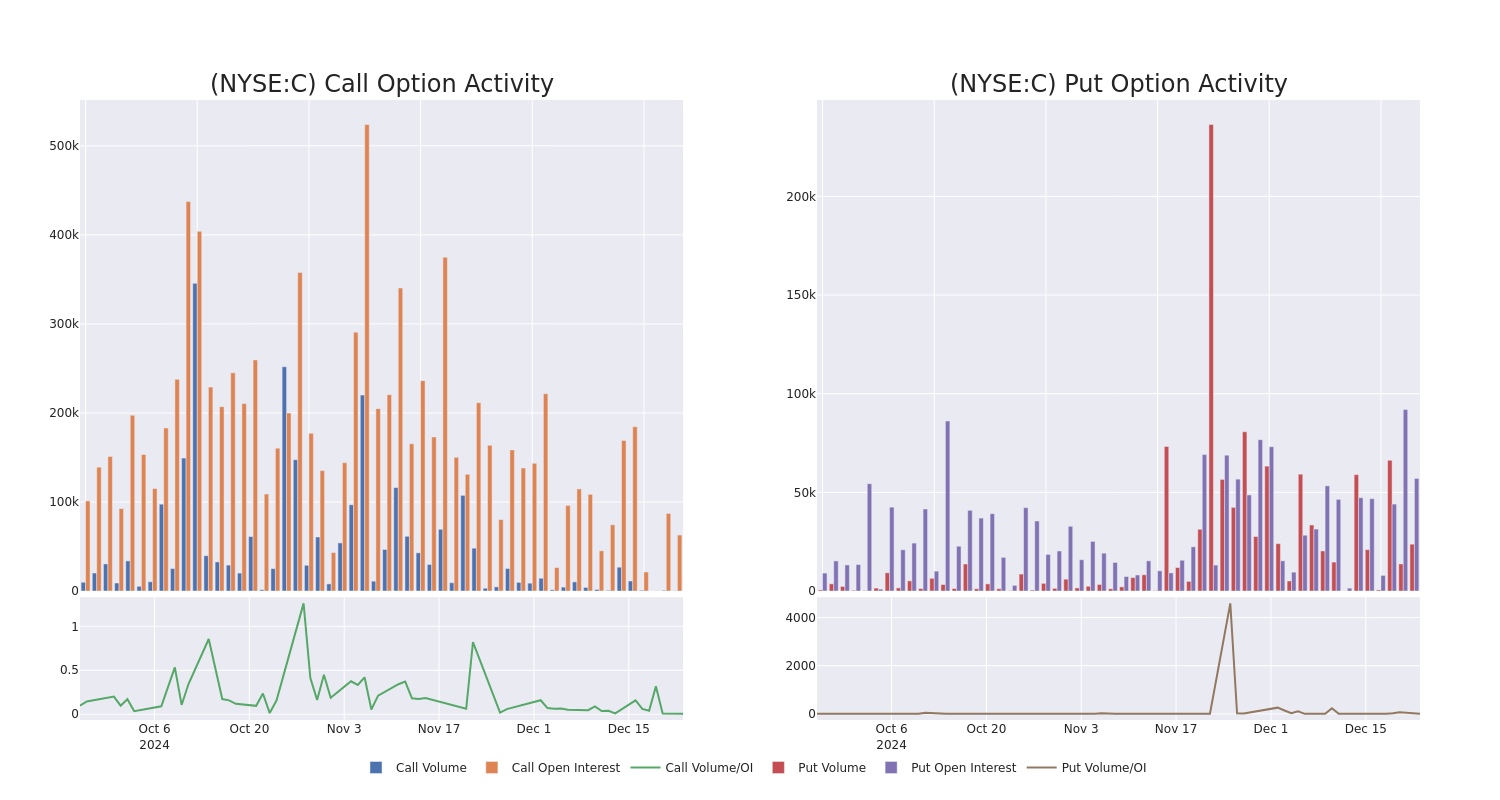
In today's trading context, the average open interest for options of Citigroup stands at 9225.15, with a total volume reaching 24,043.00. The accompanying chart delineates the progression of both call and put option volume and open interest for high-value trades in Citigroup, situated within the strike price corridor from $57.5 to $77.5, throughout the last 30 days.
Citigroup 30-Day Option Volume & Interest Snapshot

Largest Options Trades Observed:
| Symbol | PUT/CALL | Trade Type | Sentiment | Exp. Date | Ask | Bid | Price | Strike Price | Total Trade Price | Open Interest | Volume |
|---|---|---|---|---|---|---|---|---|---|---|---|
| C | CALL | TRADE | BULLISH | 06/20/25 | $2.34 | $2.22 | $2.3 | $77.50 | $230.0K | 4.4K | 0 |
| C | PUT | SWEEP | BEARISH | 09/19/25 | $2.58 | $2.57 | $2.58 | $60.00 | $184.0K | 26.1K | 718 |
| C | PUT | SWEEP | BEARISH | 12/27/24 | $1.2 | $1.16 | $1.19 | $70.00 | $154.8K | 2.2K | 2.0K |
| C | PUT | SWEEP | BEARISH | 07/18/25 | $2.7 | $2.69 | $2.7 | $62.50 | $153.1K | 770 | 567 |
| C | PUT | SWEEP | BEARISH | 07/18/25 | $2.72 | $2.71 | $2.72 | $62.50 | $136.5K | 770 | 567 |
About Citigroup
Citigroup is a global financial-services company doing business in more than 100 countries and jurisdictions. Citigroup's operations are organized into five primary segments: services, markets, banking, US personal banking, and wealth management. The bank's primary services include cross-border banking needs for multinational corporates, investment banking and trading, and credit card services in the United States.
Having examined the options trading patterns of Citigroup, our attention now turns directly to the company. This shift allows us to delve into its present market position and performance
Citigroup's Current Market Status
- With a volume of 1,896,254, the price of C is down -0.26% at $69.01.
- RSI indicators hint that the underlying stock is currently neutral between overbought and oversold.
- Next earnings are expected to be released in 23 days.
Expert Opinions on Citigroup
Over the past month, 4 industry analysts have shared their insights on this stock, proposing an average target price of $83.25.
Unusual Options Activity Detected: Smart Money on the Move
Benzinga Edge's Unusual Options board spots potential market movers before they happen. See what positions big money is taking on your favorite stocks. Click here for access. * Consistent in their evaluation, an analyst from B of A Securities keeps a Buy rating on Citigroup with a target price of $90. * Maintaining their stance, an analyst from Piper Sandler continues to hold a Overweight rating for Citigroup, targeting a price of $80. * Showing optimism, an analyst from Keefe, Bruyette & Woods upgrades its rating to Outperform with a revised price target of $82. * An analyst from Goldman Sachs has decided to maintain their Buy rating on Citigroup, which currently sits at a price target of $81.
Options trading presents higher risks and potential rewards. Astute traders manage these risks by continually educating themselves, adapting their strategies, monitoring multiple indicators, and keeping a close eye on market movements. Stay informed about the latest Citigroup options trades with real-time alerts from Benzinga Pro.
© 2024 Benzinga.com. Benzinga does not provide investment advice. All rights reserved.


