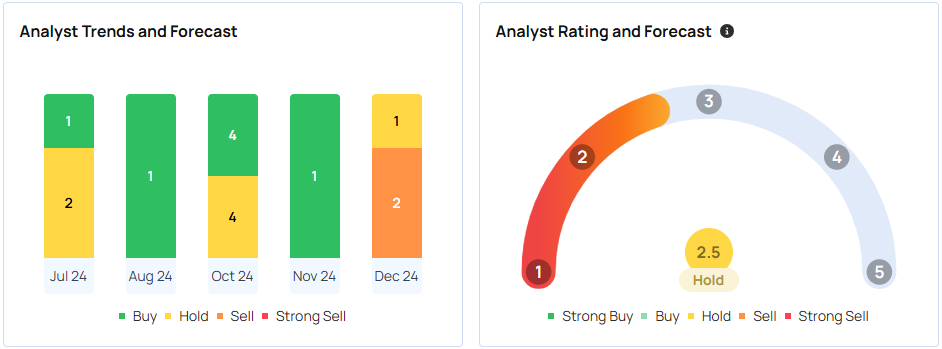
SoFi Technologies SOFI has faced recent downgrades from analysts citing concerns over the company’s high valuation. However, technical analysis, particularly moving averages, suggests potential support for the stock.
What Happened: SoFi was downgraded to ‘underperform’ by Keefe, Bruyette, and Woods (KBW), despite a recent rally driven by investor optimism and lower interest rates. While KBW slightly increased its price target, it expressed concerns about SOFI’s lofty valuation, deeming its long-term earnings potential insufficient to justify the current stock price.
The brokerage emphasized the challenges of achieving ambitious earnings targets, citing the need for significant revenue growth and margin improvement. KBW concluded that the current risk-reward profile for SOFI investors leans heavily toward potential losses.
According to Benzinga Pro, the stock was nearly three times more expensive than its peers. The forward price-to-earnings for SoFi was 76.923, whereas the average of its peers stood at 26.384.
| Stocks | Market Cap | Forward P/E |
| American Express AXP | 209.453B | 19.531 |
| Capital One Financial COF | 67.880B | 11.696 |
| Discover Financial DFS | 43.322B | 14.065 |
| Synchrony Financial SYF | 25.327B | 9.709 |
| SoFi Technologies SOFI | 16.711B | 76.923 |
| Average: 26.3848 |
Why It Matters: In December, BofA Securities downgraded SoFi, citing overvaluation. They believed SoFi’s current stock price was ahead of its financial performance, trading at a significant premium to its peers.
Conversely, Jefferies maintained its “Buy” rating on SoFi and increased its price target, expressing optimism about the company’s future
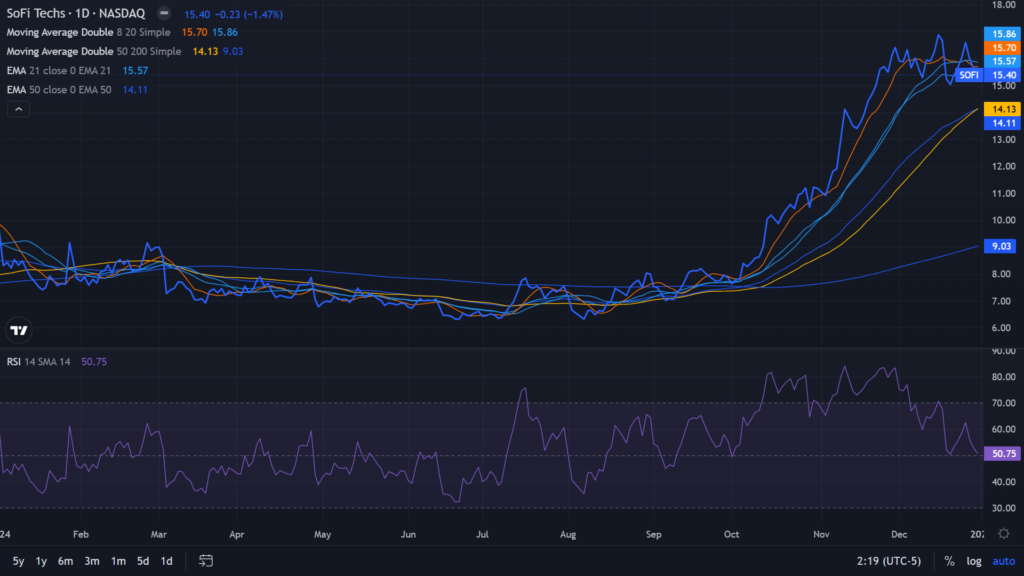
From a technical perspective, the analysis of daily moving averages shows strong support for the SoFi Tech stock.
SoFi’s shares closed at $15.4 apiece on Tuesday, this was above its 50, and 200-day simple moving averages, suggesting a largely bullish trend. The 20-day moving average price was $15.86 apiece.
These simple moving averages represent the average price of the security over the specified number of days. While 50 and 200-day averages represent longer-term prices, the eight and 20-day moving averages are for shorter periods.
On the other hand, the relative strength index of 50.75 suggested that the stock is in the neutral zone.

Price Action: The company shares rose 59.59% in 2024, outperforming the Invesco QQQ Trust ETF QQQ, which rose by 26.99%, according to Benzinga Pro data.
According to Benzinga, SoFi has a consensus price target of $9.98 per share based on the ratings of 26 analysts. The highest price target out of all the analysts tracked by Benzinga is $16 apiece issued by JPMorgan as of Dec. 2, 2024. The lowest target price is $3 per share issued by Wedbush on April 30, 2024.
The average price target of $13.67 apiece between Morgan Stanley, B of A Securities, and JPMorgan implies an 11.14% downside for SoFi.

Read Next:
Photo courtesy: Shutterstock
© 2025 Benzinga.com. Benzinga does not provide investment advice. All rights reserved.


