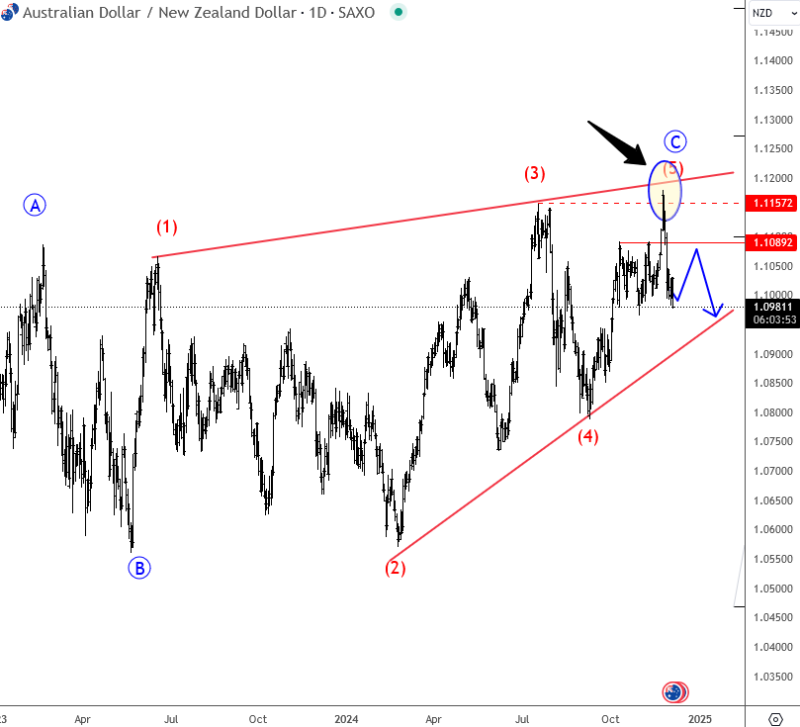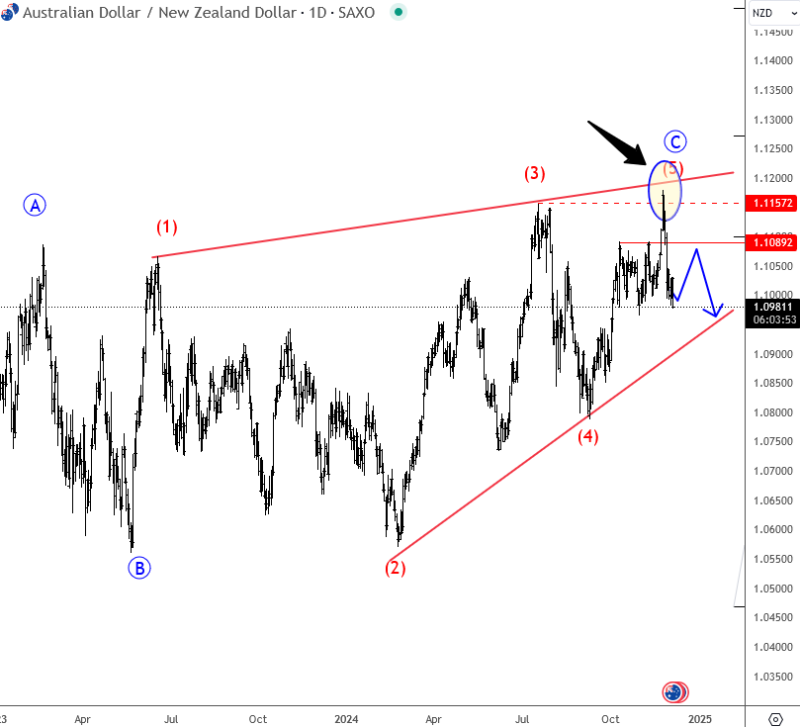
Whenever I'm scanning through charts for potential trading ideas, the most important thing for me is identifying a clear, recognizable wave structure. If the structure is clear, you can spot a potential high-probability pattern in a relatively short period of time. Recently, I found one on (AUD/USD), where we highlighted a potential wedge or ending diagonal in wave C.
These patterns are very powerful because their reversals tend to be sharp and fast. If you enter at the right time, you can catch a strong move since prices often retrace all the way to the starting point of the wedge. In this case, it suggests plenty of room for further weakness on AUDNZD, especially if the lower right trendline support connected from 2024 lows at around 1.0920 is broken.
But what's driving this reversal from the 1.12 area?
Last week, Australia's inflation data came in weaker than expected, and with the recent GDP figures also disappointing, the RBA may be considering rate cuts. On the other hand, the Reserve Bank of New Zealand cut rates as expected last week, but now that this cut is behind, they may hold steady, giving the New Zealand dollar an edge. This divergence explains why NZDUSD has been recovering recently, as the "buy the rumor, sell the news" dynamic seems to have played out.
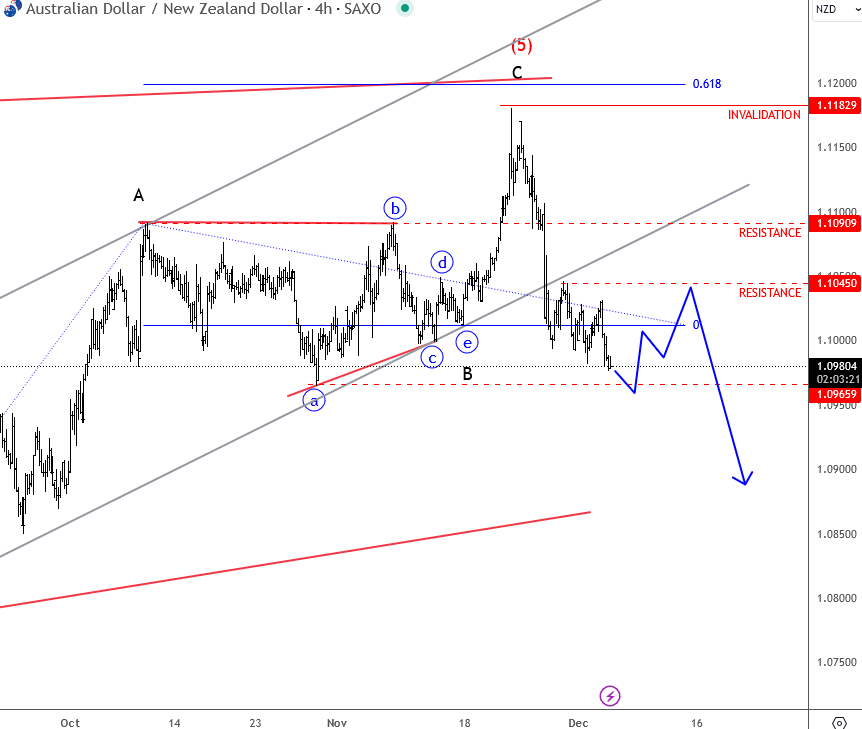
Looking at AUDNZD on the intraday timeframe, we can already count five waves down from the most recent highs, which is a clear and important Elliott wave signal suggesting further weakness. Selling rallies makes sense while the market remains below November highs.
For more updates on this pair and other markets, check out our services at ForexAnalytix.
Thank you for reading!
Grega Horvat
Forex Analytix

© 2024 Benzinga.com. Benzinga does not provide investment advice. All rights reserved.


