Cannabis stocks have faced significant challenges recently, driven by political uncertainty that has further weighed on a sector still struggling to regain its footing since the overhyped all-time highs of 2021.
To help investors navigate the long-term outlook for key cannabis companies, we are introducing a series of in-depth technical analyses, focusing on actionable insights from technical indicators to support informed financial decisions.
After analyzing Canadian cannabis giant Canopy Growth CGC, it's time to turn our attention to another heavyweight: Aurora Cannabis ACB.
Based in Alberta, Aurora remains a key player in the sector and a major contender for Canopy. So, grab a seat as we dive into the technical setup and explore what the future might hold for this heavy-weight cannabis company.
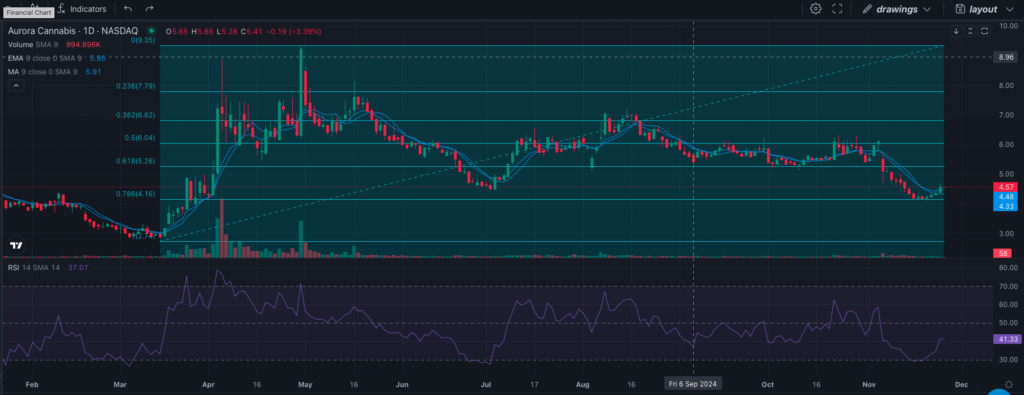
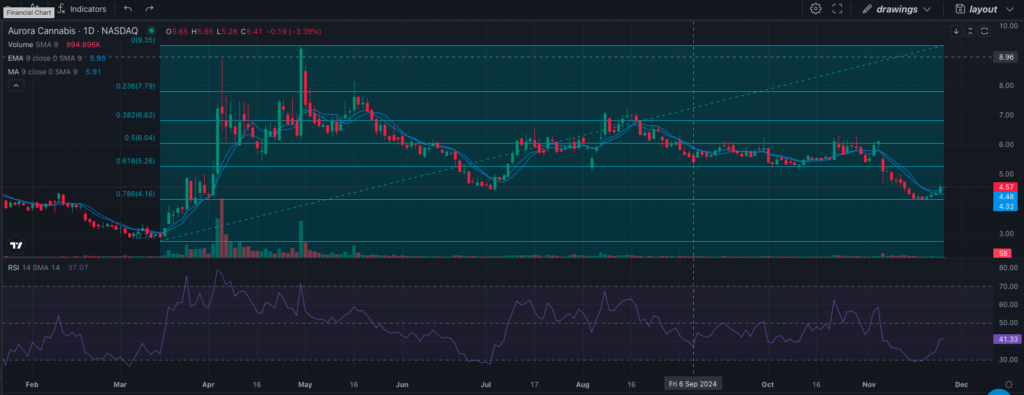
We will use Fibonacci Retracement, a popular tool in technical analysis that helps traders identify key levels where a stock might reverse or stabilize. In Aurora's case, the tool is applied from the March low of $2.7 to the April high of $8.96. In the case of Canopy, the starting point was May.
For Mid-Term Traders And Holders
These levels highlight critical zones where buyer or seller momentum tends to shift.
- Current Support: Aurora is hovering around the 78.6% retracement level at $4.16: the "final line of defense" for bulls.
- Resistance Ahead: If this support holds, the next key levels are $5.26 (61.8%) and $6.04 (50%), which could act as mid-term targets.
- Breaking above $6.04 would indicate stronger bullish momentum and possibly a trend reversal.
For short-term traders, $5.26 is a natural profit-taking zone, while holders might look for sustained moves above $6.04 as a sign of long-term recovery.
If the price falls below $4.16, the next significant support lies near $2.7, the March low, which would invalidate the bullish scenario.

Chart created using Benzinga Pro
Read Also: What’s Happening With Canopy Growth: Is It Time To Buy?
For Daily Traders
If you look for recent price action in the daily chart you’ll see signs of rebounding momentum as a bullish divergence is emerging. While the stock has been printing lower lows, the Relative Strength Index (RSI) has shown higher lows. This divergence suggests weakening selling pressure and the potential for a rebound.
- Validation Point: A break above $5.26, accompanied by rising RSI, would confirm the divergence and support a recovery.
- Invalidation Point: A fall below $4.16 would negate the divergence and signal continued downward pressures
Beware that divergences alone are not foolproof. They require confirmation through price action, volume or additional indicators like moving averages or candlestick patterns. Without these, the divergence may fail and the downtrend could continue.
Fundamentals: A Stock Trading Below Book Value
Beyond the charts, Aurora Cannabis has interesting fundamentals. With quarterly total assets of $808.77 million and a book value per share of $7.10, the company's stock trades significantly below its intrinsic value. This could indicate an undervalued opportunity for long-term investors willing to weather the volatility.
For now, traders should watch price action near $4.16 and $5.26, while holders may see a more compelling story above $6.04. Both groups should keep an eye on volume, which can confirm whether the bulls are stepping back in.
DISCLAIMER: The content of this article is not financial or investment advice and does not constitute an offer or solicitation to offer or recommendation of any investment product. The author holds no position on the mentioned stocks.
COVER: AI-generated image
© 2024 Benzinga.com. Benzinga does not provide investment advice. All rights reserved.


