AST SpaceMobile Options Trading: A Deep Dive into Market Sentiment
Whales with a lot of money to spend have taken a noticeably bearish stance on AST SpaceMobile.
Looking at options history for AST SpaceMobile ASTS we detected 9 trades.
If we consider the specifics of each trade, it is accurate to state that 44% of the investors opened trades with bullish expectations and 55% with bearish.
From the overall spotted trades, 4 are puts, for a total amount of $183,725 and 5, calls, for a total amount of $215,280.
Predicted Price Range
Taking into account the Volume and Open Interest on these contracts, it appears that whales have been targeting a price range from $12.5 to $35.0 for AST SpaceMobile over the last 3 months.
Analyzing Volume & Open Interest
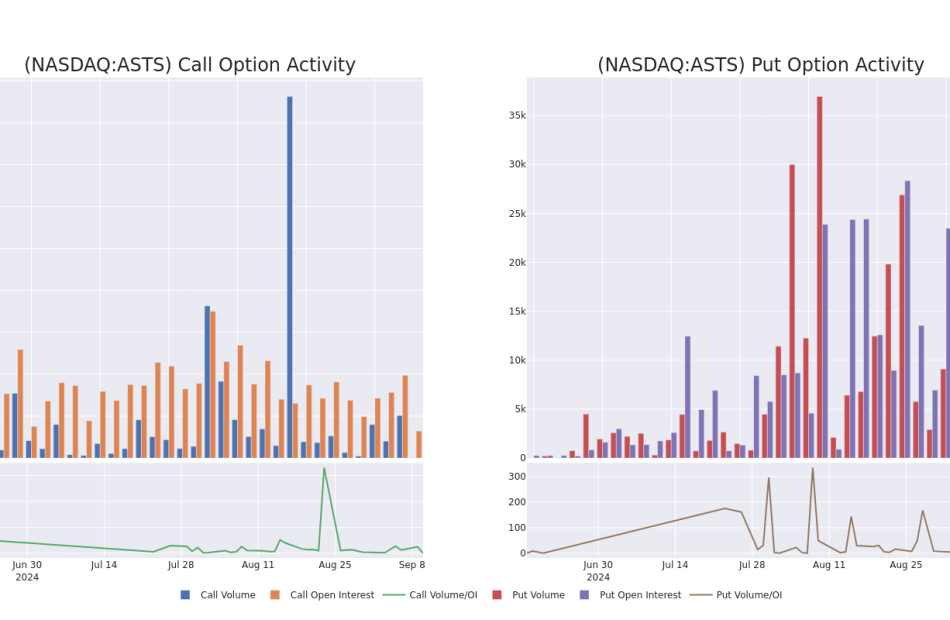
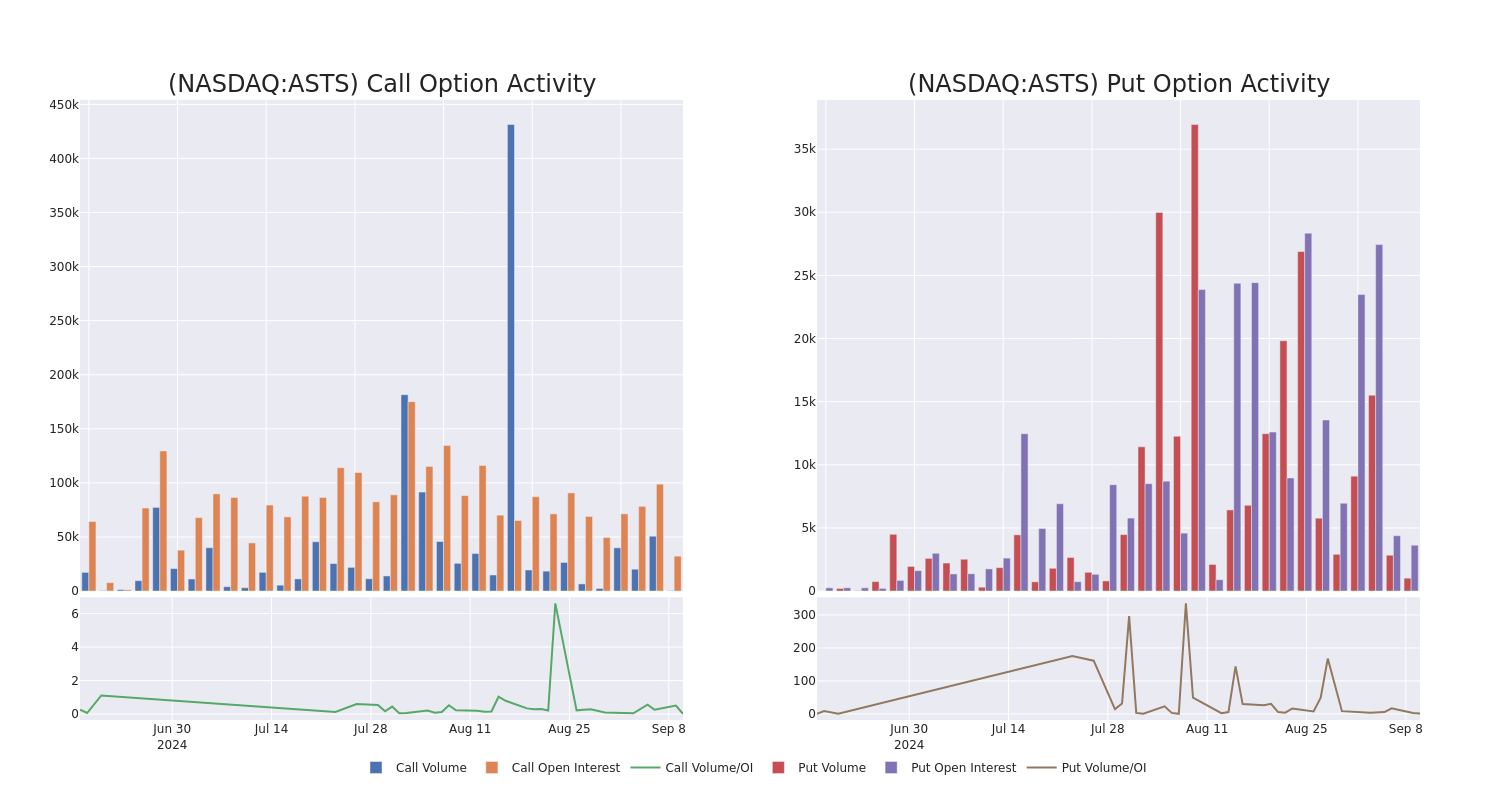
Examining the volume and open interest provides crucial insights into stock research. This information is key in gauging liquidity and interest levels for AST SpaceMobile’s options at certain strike prices. Below, we present a snapshot of the trends in volume and open interest for calls and puts across AST SpaceMobile’s significant trades, within a strike price range of $12.5 to $35.0, over the past month.
AST SpaceMobile Option Activity Analysis: Last 30 Days
Largest Options Trades Observed:
| Symbol | PUT/CALL | Trade Type | Sentiment | Exp. Date | Ask | Bid | Price | Strike Price | Total Trade Price | Open Interest | Volume |
|---|---|---|---|---|---|---|---|---|---|---|---|
| ASTS | PUT | TRADE | BEARISH | 09/13/24 | $1.25 | $1.2 | $1.25 | $24.00 | $62.5K | 803 | 319 |
| ASTS | PUT | SWEEP | BEARISH | 09/13/24 | $1.75 | $1.65 | $1.75 | $25.00 | $58.2K | 2.4K | 358 |
| ASTS | CALL | SWEEP | BULLISH | 01/17/25 | $10.9 | $10.5 | $10.9 | $20.00 | $54.3K | 15.3K | 55 |
| ASTS | CALL | SWEEP | BEARISH | 09/20/24 | $1.4 | $1.0 | $1.0 | $35.00 | $45.5K | 9.4K | 204 |
| ASTS | CALL | SWEEP | BEARISH | 01/17/25 | $11.1 | $11.0 | $11.0 | $20.00 | $42.9K | 15.3K | 125 |
About AST SpaceMobile
AST SpaceMobile Inc is a satellite designer and manufacturer. The company is building a cellular broadband network in space to operate directly with standard, unmodified mobile devices, and off-the-shelf mobile phones based on extensive IP and patent portfolio. It has focused on eliminating the connectivity gaps faced by mobile subscribers and finally bringing broadband to the billions who remain unconnected. The Company’s spaceMobile Service is being designed to provide cost-effective, high-speed Cellular Broadband services to end-users who are out of terrestrial cellular coverage using existing mobile devices.
Where Is AST SpaceMobile Standing Right Now?
- Trading volume stands at 441,719, with ASTS’s price up by 1.31%, positioned at $26.28.
- RSI indicators show the stock to be may be approaching overbought.
- Earnings announcement expected in 63 days.
Expert Opinions on AST SpaceMobile
5 market experts have recently issued ratings for this stock, with a consensus target price of $39.78.
- An analyst from B. Riley Securities persists with their Buy rating on AST SpaceMobile, maintaining a target price of $26.
- An analyst from B. Riley Securities has decided to maintain their Buy rating on AST SpaceMobile, which currently sits at a price target of $36.
- An analyst from Scotiabank persists with their Sector Outperform rating on AST SpaceMobile, maintaining a target price of $28.
- An analyst from Scotiabank has decided to maintain their Sector Outperform rating on AST SpaceMobile, which currently sits at a price target of $45.
- An analyst from Deutsche Bank has decided to maintain their Buy rating on AST SpaceMobile, which currently sits at a price target of $63.
Trading options involves greater risks but also offers the potential for higher profits. Savvy traders mitigate these risks through ongoing education, strategic trade adjustments, utilizing various indicators, and staying attuned to market dynamics. Keep up with the latest options trades for AST SpaceMobile with Benzinga Pro for real-time alerts.
Market News and Data brought to you by Benzinga APIs
© 2024 Benzinga.com. Benzinga does not provide investment advice. All rights reserved.
Morgan Stanley cuts oil target for second time in a month as prices plunge to 2024 lows
Wall Street has turned gloomier on oil prices as signs of weak demand and plenty of supply have weighed on the crude market.
On Monday, Morgan Stanley cut its Brent (BZ=F) forecast for the second time in a month, citing recent price declines that signal the risk of “considerable demand weakness.”
The analysts now predict Brent will average $75 in the fourth quarter of this year, $5 lower than the prior downwardly revised forecast of $80 issued in late August.
On Monday, West Texas Intermediate (CL=F) rose to trade near $68 per barrel, while Brent, the international benchmark, was hovering near $71 per barrel.
“Oil prices have recently followed a path that resembles periods of considerable demand weakness and calendar spreads are already consistent with recession-like inventory builds ahead,” wrote Morgan Stanley equity analyst and commodity strategist Martijn Rats and his team.
Despite the recent price trends, the analysts said “demand indicators are concerning, but it remains too early to make ‘recession-like’ demand the base case.”
Rats and the analysts pointed to willingness from OPEC+ to balance out the market. Last week, the oil alliance delayed by two months the start of some of its voluntary cut rollbacks, originally slated to begin in October.
Other Wall Street firms have also lowered their expectations for crude prices, driven primarily by weak demand out of China, the largest crude importer.
JPMorgan recently cut its fourth quarter forecast from $85 to $80, citing “oil’s large underperformance” in August.
Last month, Goldman Sachs decreased its 2025 prediction for Brent by $5 per barrel to a range of $70 to $85.
Increasing signs of economic cracks in the US and Europe, where the summer driving season has been unwinding, have also weighed on prices. Oil’s downturn has helped precipitate a plummet in gas prices in the US, as well, with at least one analyst predicting the national average would fall to $3 by the end of the year.
Crude recently touched its lowest level of 2024, erasing all of their year-to-date gains.
Despite an overall market rebound on Monday, WTI is down roughly 3% year to date and hovering near its lows for the year. Brent crude is down about 5% during the same period.
Ines Ferre is a senior business reporter for Yahoo Finance. Follow her on X at @ines_ferre.
1 Healthcare Stock to Sell Now and Never Look Back
If you’re holding shares of Walgreens Boots Alliance (NASDAQ: WBA) in hopes of it turning around promptly, I think that now is the time to cut your losses on the struggling pharmacy chain and allocate your capital elsewhere. Here’s why.
A common investing thesis for this stock is now dead
One of the criteria that can help an investor decide when to sell a stock is whether the investing thesis they formed as a rationale for buying the stock is still valid.
Let’s assume you bought Walgreens stock 10 years ago, expecting it to be a safe stock that generates steady and growing dividend income, and modest share-price appreciation. You may have also anticipated that its line of business, providing retail pharmacy services, would hold up relatively well over time even if the world changed a lot.
But that thesis hasn’t played out as planned.
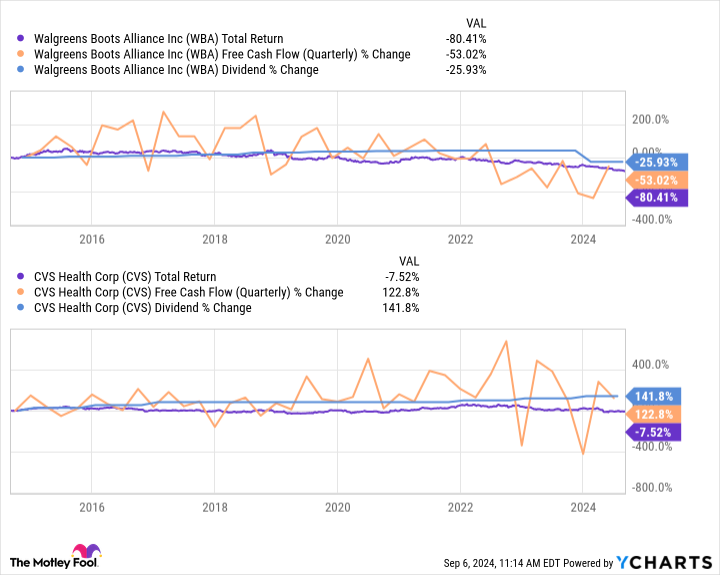
In the past 10 years, the total return of the stock has declined by just over 80%. In the same period, quarterly free cash flow (FCF) has dwindled by 53% to just $327 million. In early January of this year, Walgreens slashed its quarterly dividend by 48% compared to the prior quarter, to $0.25 per share.
And in the trailing-12-month period alone, the company spent nearly $27 billion on debt repayment, denying the use of that capital for growth initiatives or for returning it to shareholders.
So, to recap: It wasn’t a safe investment, it didn’t offer consistent dividend income, and even though people still need to go to a pharmacy to get their prescriptions, that factor apparently hasn’t been relevant to preserving the stock’s price.
Furthermore, it is not the case that the pharmacy industry as a whole has struggled, which would at least be a consolation for the stock’s underperformance. Walgreens’ biggest competitor, CVS Health, saw the total return of its shares decline by around 4% in the last 10 years while its quarterly FCF and dividend soared. Take a look at this chart:
So what’s sinking Walgreens? Its core prescription-filling segment continues to hold up relatively well, expanding the number of prescriptions (excluding immunizations) filled by 1.7% year over year as of its fiscal third quarter (which ended May 31).
But sales of nonprescription healthcare goods are softening, as are prescription reimbursements from insurers. The boost the company got as the economy reopened in 2021 is now long past. More importantly, its bid to diversify into providing primary care is costly and although not a money-burner any more, is still nowhere close to contributing enough to prop up the top or bottom line.
There’s no concrete hope for salvation on the horizon. The only path forward in the near term will be for Walgreens to continue selling off its investments and other assets to service its debt, while trimming operating costs and pushing its most profitable segments forward. Such moves could cause it to leave some revenue on the table. And its total assets will likely continue to shrink, which will drag the share price down more.
Even if you’re patient, it’s time to sell
It’s true that Walgreens could salvage itself over the next decade or more. Eventually its primary care segment could be a formidable profit center. And its retail pharmacy segment could become efficient again, with enough time.
But there isn’t much evidence of those processes getting very far beyond the starting line yet. Nor are shareholders obligated to hang around after their investing thesis is invalidated, regardless of the precise reasons.
Therefore, I think the best move is to sell the stock now. Even if you’re optimistic about a recovery — and it’s hard to see why at the moment — more downward movement of the stock could be looming. It’s safer to back out now, and then return later if you detect the seedlings of a restoration.
Should you invest $1,000 in Walgreens Boots Alliance right now?
Before you buy stock in Walgreens Boots Alliance, consider this:
The Motley Fool Stock Advisor analyst team just identified what they believe are the 10 best stocks for investors to buy now… and Walgreens Boots Alliance wasn’t one of them. The 10 stocks that made the cut could produce monster returns in the coming years.
Consider when Nvidia made this list on April 15, 2005… if you invested $1,000 at the time of our recommendation, you’d have $652,404!*
Stock Advisor provides investors with an easy-to-follow blueprint for success, including guidance on building a portfolio, regular updates from analysts, and two new stock picks each month. The Stock Advisor service has more than quadrupled the return of S&P 500 since 2002*.
*Stock Advisor returns as of September 9, 2024
Alex Carchidi has no position in any of the stocks mentioned. The Motley Fool recommends CVS Health. The Motley Fool has a disclosure policy.
1 Healthcare Stock to Sell Now and Never Look Back was originally published by The Motley Fool
Advanced Micro Devices Unusual Options Activity
Deep-pocketed investors have adopted a bearish approach towards Advanced Micro Devices AMD, and it’s something market players shouldn’t ignore. Our tracking of public options records at Benzinga unveiled this significant move today. The identity of these investors remains unknown, but such a substantial move in AMD usually suggests something big is about to happen.
We gleaned this information from our observations today when Benzinga’s options scanner highlighted 18 extraordinary options activities for Advanced Micro Devices. This level of activity is out of the ordinary.
The general mood among these heavyweight investors is divided, with 44% leaning bullish and 50% bearish. Among these notable options, 10 are puts, totaling $677,466, and 8 are calls, amounting to $699,863.
Projected Price Targets
Analyzing the Volume and Open Interest in these contracts, it seems that the big players have been eyeing a price window from $105.0 to $150.0 for Advanced Micro Devices during the past quarter.
Insights into Volume & Open Interest
In terms of liquidity and interest, the mean open interest for Advanced Micro Devices options trades today is 8077.56 with a total volume of 21,709.00.
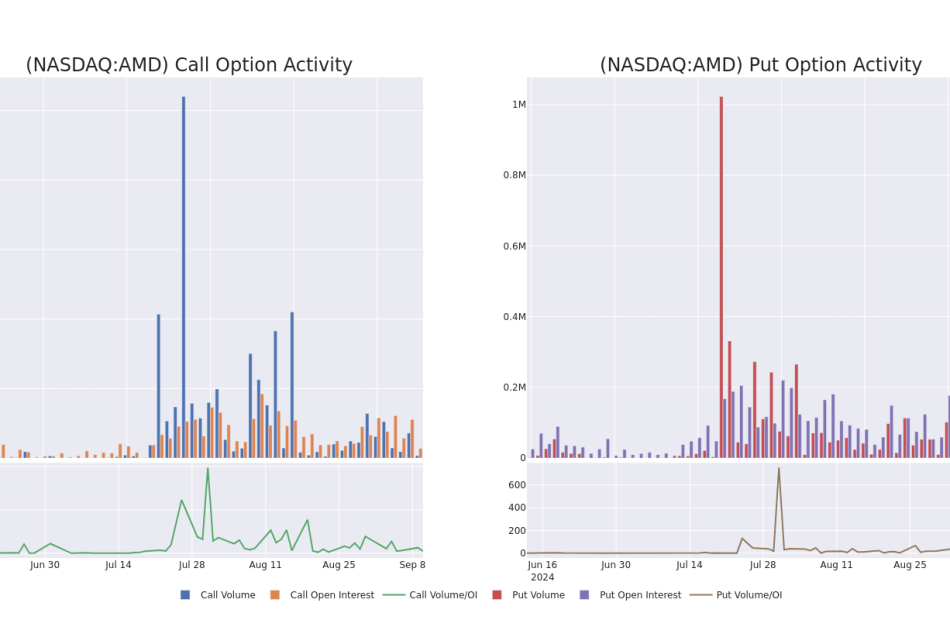
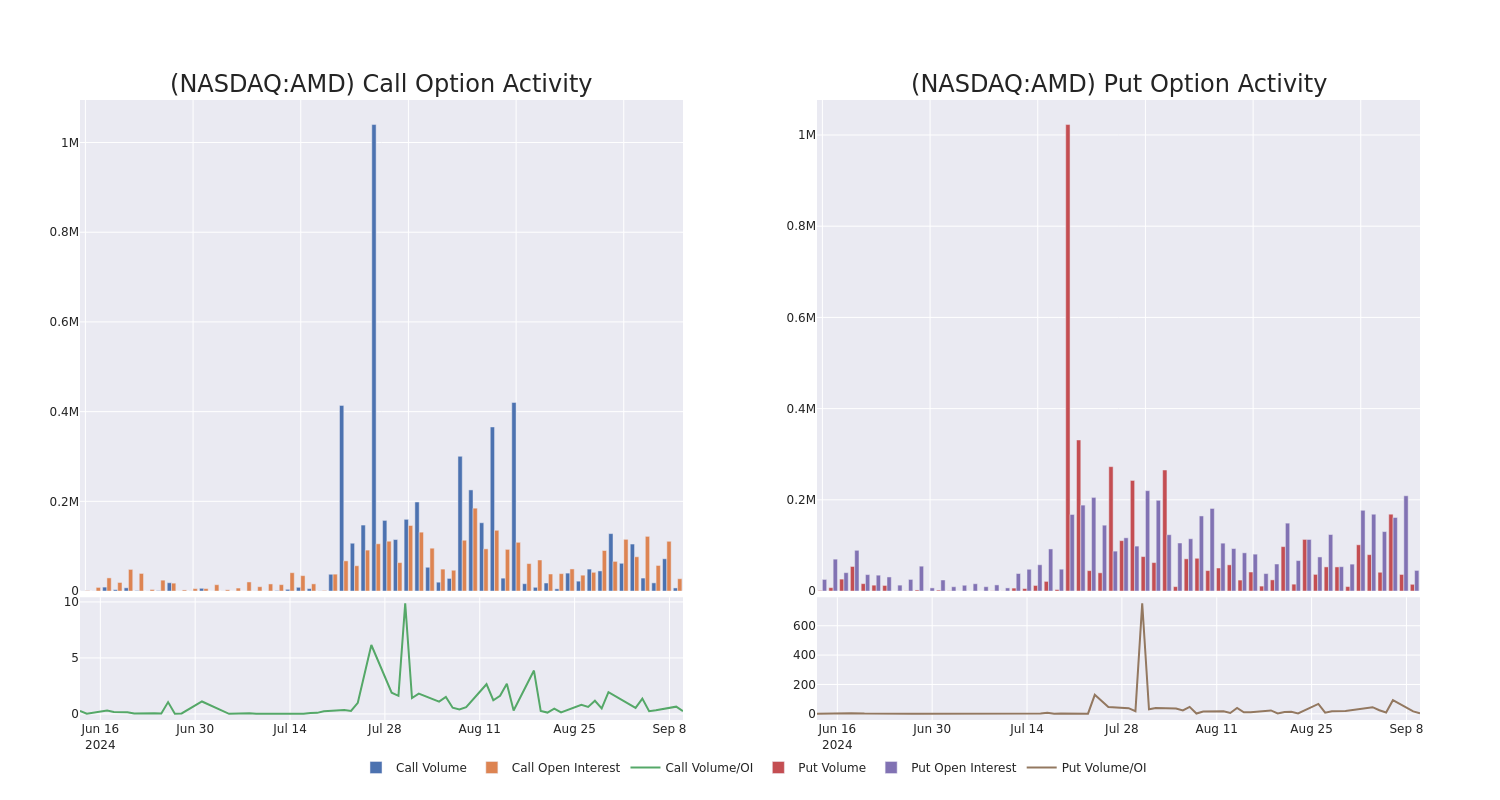
In the following chart, we are able to follow the development of volume and open interest of call and put options for Advanced Micro Devices’s big money trades within a strike price range of $105.0 to $150.0 over the last 30 days.
Advanced Micro Devices 30-Day Option Volume & Interest Snapshot
Largest Options Trades Observed:
| Symbol | PUT/CALL | Trade Type | Sentiment | Exp. Date | Ask | Bid | Price | Strike Price | Total Trade Price | Open Interest | Volume |
|---|---|---|---|---|---|---|---|---|---|---|---|
| AMD | CALL | SWEEP | BULLISH | 10/18/24 | $8.85 | $8.8 | $8.85 | $140.00 | $407.8K | 6.5K | 486 |
| AMD | PUT | SWEEP | BEARISH | 12/20/24 | $2.94 | $2.93 | $2.94 | $105.00 | $133.7K | 20.6K | 573 |
| AMD | PUT | SWEEP | BEARISH | 01/17/25 | $11.35 | $11.25 | $11.25 | $130.00 | $112.5K | 17.5K | 100 |
| AMD | PUT | SWEEP | BEARISH | 12/20/24 | $3.0 | $2.75 | $2.95 | $105.00 | $77.0K | 20.6K | 109 |
| AMD | PUT | SWEEP | BULLISH | 09/13/24 | $2.01 | $1.99 | $1.99 | $135.00 | $72.1K | 3.9K | 3.0K |
About Advanced Micro Devices
Advanced Micro Devices designs a variety of digital semiconductors for markets such as PCs, gaming consoles, data centers, industrial, and automotive applications, among others. AMD’s traditional strength was in central processing units, CPUs, and graphics processing units, or GPUs, used in PCs and data centers. Additionally, the firm supplies the chips found in prominent game consoles such as the Sony PlayStation and Microsoft Xbox. In 2022, the firm acquired field-programmable gate array, or FPGA, leader Xilinx to diversify its business and augment its opportunities in key end markets such as the data center and automotive.
Present Market Standing of Advanced Micro Devices
- Currently trading with a volume of 771,044, the AMD’s price is up by 0.56%, now at $138.93.
- RSI readings suggest the stock is currently is currently neutral between overbought and oversold.
- Anticipated earnings release is in 49 days.
Trading options involves greater risks but also offers the potential for higher profits. Savvy traders mitigate these risks through ongoing education, strategic trade adjustments, utilizing various indicators, and staying attuned to market dynamics. Keep up with the latest options trades for Advanced Micro Devices with Benzinga Pro for real-time alerts.
Market News and Data brought to you by Benzinga APIs
© 2024 Benzinga.com. Benzinga does not provide investment advice. All rights reserved.
Real Estate Software Market to hit $28.63 billion, Globally, by 2031 at 12.6% CAGR, says Coherent Market Insights
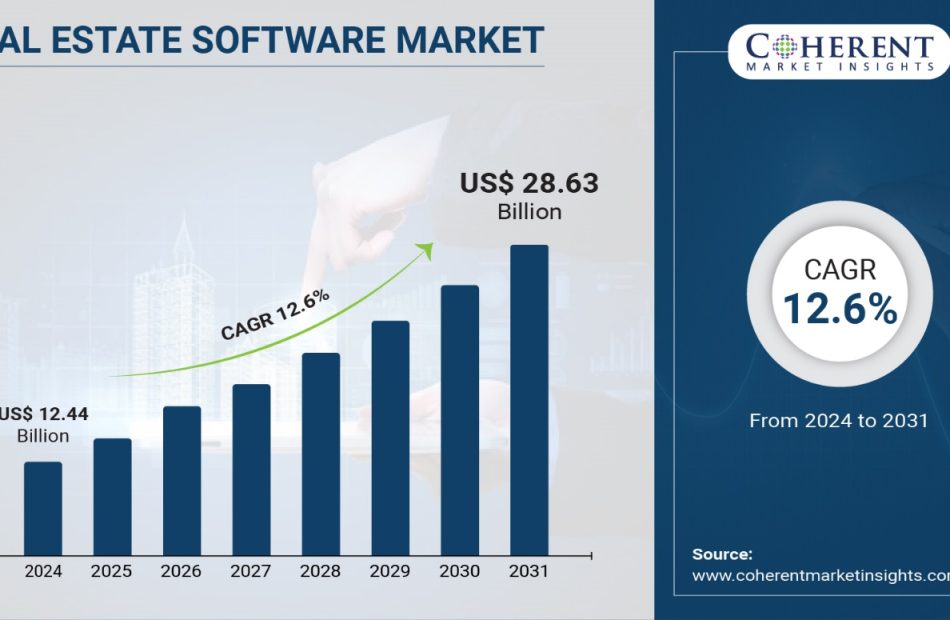
Burlingame, Sept. 10, 2024 (GLOBE NEWSWIRE) — The global Real Estate Software Market Size to Grow from USD 12.44 Billion in 2024 to USD 28.63 Billion by 2031, at a Compound Annual Growth Rate (CAGR) of 12.6% during the forecast period, as highlighted in a new report published by Coherent Market Insights. Real estate software offers various features like property listings, agent communication tools, document management, and others which help real estate agents and property managers streamline workflow and boost productivity. Additionally, rising adoption of cloud and mobile technologies by real estate firms is estimated to offer lucrative growth opportunities over the forecast period.
Request Sample Report: https://www.coherentmarketinsights.com/insight/request-sample/7163

Market Dynamics:
The real estate software market is driven by growing adoption of cloud-based solutions across various sectors including architecture, engineering, and construction. Cloud-based platforms offer benefits such as scalability, flexibility, easy collaboration, and reduced IT infrastructure costs. They help simplify complex workflows and provide real-time insights on project performance. This has boosted their adoption over conventional on-premise systems in the real estate industry. Another key driver is the increased need for automation of business processes to improve productivity and efficiency. Real estate software automates various tasks such as project management, document management, accounting, and customer relationship management (CRM). This streamlines operations and frees up resources for value-added tasks.
Real Estate Software Market Report Coverage
| Report Coverage | Details |
| Market Revenue in 2023 | $12.44 billion |
| Estimated Value by 2031 | $28.63 billion |
| Growth Rate | Poised to grow at a CAGR of 12.6% |
| Historical Data | 2019–2023 |
| Forecast Period | 2024–2031 |
| Forecast Units | Value (USD Million/Billion) |
| Report Coverage | Revenue Forecast, Competitive Landscape, Growth Factors, and Trends |
| Segments Covered | By Type, By Deployment, By End User |
| Geographies Covered | North America, Europe, Asia Pacific, and Rest of World |
| Growth Drivers | • Growing adoption of cloud-based real estate solutions • Integration of advanced technologies in real estate software |
| Restraints & Challenges | • Cybersecurity and data privacy concerns • Lack of skilled workforce |
Market Trends:
There is a rising trend of developing dedicated mobile applications among real estate software vendors to support field activities. Mobile apps provide on-the-go access to critical project data, documents, and perform basic CRM functions. They enable real estate agents and field staff to manage listings, book appointments, and capture signatures remotely. Advancement in location-based technologies is also allowing integration of features like property searching based on geo-location.
Leading players are focusing on investing in AI and blockchain integrations to enhance the offerings. AI helps analyze large property databases to yield meaningful insights through machine learning and predictive analytics. Blockchain, on the other hand, brings transparency to digital transactions and record keeping for properties. This is expected to revolutionize processes like title transfers, payments, and smart contracts in the coming times.
Immediate Delivery Available | Buy This Premium Research Report: https://www.coherentmarketinsights.com/insight/buy-now/7163
Market Opportunities:
Contract management software allows real estate professionals to efficiently manage all legal documentation and agreements related to properties. It helps digitize processes like lease management, vendor contracts and more. This reduces paperwork and enables easy access to documents from anywhere. Many contract management software solutions now offer e-signature capabilities and integration with accounting software for automated invoicing. This streamlines contract execution and payments.
Customer relationship management (CRM) software is crucial for real estate firms to strengthen client relationships. It maintains a central database of all customer information like contacts, past interactions, property portfolios and more. Agents can use CRM to track client needs and preferences. This helps deliver personalized service and attention. CRM also automates communications through features like email and SMS marketing. This improves lead generation and conversions. With remote working becoming common, cloud-based CRM allows seamless collaboration between field agents and back office staff.
Key Market Takeaways
The global real estate software market is anticipated to witness a CAGR of 12.6% during the forecast period 2024-2031, owing to the growing adoption of automation tools in the industry.
On the basis of type, contract management software segment is expected to hold a dominant position, owing to benefits like reduced paperwork and ease of access.
In terms of deployment, cloud segment is expected to lead the market due to advantages like scalability, low maintenance and remote access.
On the basis of region, North America is expected to hold a dominant position over the forecast period, due to rapid technological advancements and presence of major players in the region.
Key players operating in the real estate software market include Accruent, Altus Group, and Altus Group Ltd. These companies are focusing on new product launches and partnerships to strengthen their market position.
Request For Customization: https://www.coherentmarketinsights.com/insight/request-customization/7163
Recent Developments:
In October 2022, On the 23rd and 26th of October, MRI Software, a global pioneer in real estate solutions, revealed its vision for the next generation of its open and connected technology platform, MRI AgoraTM, at the Ascend users conference in New Orleans. The MRI Agora platform will help real estate companies make better decisions by connecting data, automating boring operations, and differentiating themselves through technology.
In February 2021, Trimble announced it had reached a deal with MRI Software to sell its Manhattan real estate and workspace solutions business (MRI).
To summarize, the real estate industry is increasingly relying on advanced software to streamline operations and deliver enhanced customer experience. This is propelling the growth of specialized solutions like contract and CRM software. Cloud deployment and integration capabilities are also driving the market. Leading providers are enhancing their offerings through continuous innovation.
Detailed Segmentation:
By Type:
- Customer Relationship Management Software
- Enterprise Resource Planning Software
- Property Management Software
- Contract Software
- Others
By Deployment:
By End User:
- Architects & Engineers
- Project Managers
- Real Estate Agents
- Others
By Region:
North America:
Latin America:
- Brazil
- Argentina
- Mexico
- Rest of Latin America
Europe:
- Germany
- U.K.
- Spain
- France
- Italy
- Russia
- Rest of Europe
Asia Pacific:
- China
- India
- Japan
- Australia
- South Korea
- ASEAN
- Rest of Asia Pacific
Middle East:
- GCC Countries
- Israel
- Rest of Middle East
Africa:
- South Africa
- North Africa
- Central Africa
Have a Look at Trending Research Reports on Information and Communication Technology Domain:
Global Peer to Peer Lending Market is estimated to be valued at USD 145.03 Billion in 2024 and is expected to reach USD 567.84 Billion by 2031, exhibiting a compound annual growth rate (CAGR) of 21.5% from 2024 to 2031.
Sales Acceleration Software Market, by Type (Quality Lead Scoring Software, Lead Databases, Sales-Focused CRMs, Email Tools with Intelligent Follow-up & Data, Meeting Booking Tools, Customer Data Platform, Sales Proposal Management Software), by Enterprise Size (SMEs, Large Enterprises), by Industry Vertical (BFSI, Healthcare, Automotive, Real Estate, Ecommerce, Others (Travel, Education etc.)), and by Region – Size, Share, Outlook, and Opportunity Analysis, 2024 – 2031
The Corporate Liquidity Management Market size is expected to reach US$ 5.9 billion by 2030, from US$ 2.6 billion in 2023, at a CAGR of 12.4% during the forecast period.
Author Bio:
Ravina Pandya, PR Writer, has a strong foothold in the market research industry. She specializes in writing well-researched articles from different industries, including food and beverages, information and technology, healthcare, chemical and materials, etc. With an MBA in E-commerce, she has an expertise in SEO-optimized content that resonates with industry professionals.
About Us:
Coherent Market Insights is a global market intelligence and consulting organization that provides syndicated research reports, customized research reports, and consulting services. We are known for our actionable insights and authentic reports in various domains including aerospace and defense, agriculture, food and beverages, automotive, chemicals and materials, and virtually all domains and an exhaustive list of sub-domains under the sun. We create value for clients through our highly reliable and accurate reports. We are also committed in playing a leading role in offering insights in various sectors post-COVID-19 and continue to deliver measurable, sustainable results for our clients.

Mr. Shah
Senior Client Partner – Business Development
Coherent Market Insights

Phone:
US: +1-650-918-5898
UK: +44-020-8133-4027
AUS: +61-2-4786-0457
India: +91-848-285-0837
Email: sales@coherentmarketinsights.com
Website: https://www.coherentmarketinsights.com
© 2024 Benzinga.com. Benzinga does not provide investment advice. All rights reserved.
Down 69%, Is This Cathie Wood Stock a Bargain for Just $3?
You may recall that a few years ago many companies took an nontraditional route to going public. Special purpose acquisition companies (SPACs) — more colloquially referred to as “blank check companies” — became a popular method of pursuing an initial public offering. An influential player in the SPAC boom was a billionaire venture capitalist named Chamath Palihapitiya. Palihapitiya is a prominent technology investor and has a closely followed social media presence, largely thanks to his popular All-In podcast.
Palihapitiya’s support of SPACs may have contributed to the illusion that many of these businesses were lucrative investment opportunities. The unfortunate reality, however, is that many SPAC businesses were far less mature and financially stable than most companies that pursued the more traditional IPO underwriting process. As a result, a lot of money has been lost investing in SPACs.
One SPAC stock that is down substantially from its IPO is an electric vehicle (EV) business called Archer Aviation (NYSE: ACHR). A hallmark of Cathie Wood’s ARK Invest exchange-traded funds (ETFs), Archer develops vertical takeoff and landing (VTOL) EVs.
Is the market underestimating the potential for Archer’s flying taxis, making the pronounced sell-off and $3 stock price a lucrative opportunity hiding in plain sight? Let’s explore Archer’s market potential and assess whether now is a good time to scoop up some shares.
What problem is Archer Aviation solving?
Public transportation is a market ripe for disruption. Ride-hailing apps such as those made by Uber Technologies and Lyft completely revolutionized how people travel, particularly in urban environments. The idea of an on-demand driver who can pick you up and drop you off at a destination brings a level of convenience and solves supply and demand constraints that traditional taxi services simply cannot replicate.
But despite the convenience of calling an Uber or Lyft, there is one problem those companies can’t really solve: getting stuck in traffic. Congested roads aren’t something a ride-share can magically make disappear.
Archer is looking to introduce another layer to urban mobility. Its EVs are essentially air taxis. In theory, this method of travel can lead to fewer cars on the road while serving as a greener form of mobility.
Outside of urban air mobility, Archer also has real opportunities that it’s working on with the U.S. military, as well as with various airline companies.
According to Precedence Research, the total addressable market (TAM) for electric VTOL aircraft will grow at a compound annual growth rate (CAGR) of 12.4% between 2023 and 2032 — ultimately reaching a size of $35.8 billion by early next decade.
All of these points may inspire some confidence, and give the impression that Archer is destined to land somewhere between Uber and Tesla. Unfortunately, there’s a world of difference between investing in the idea of something and investing in the actual business.
It takes money to make money
For both EVs and aircraft, assembly is an expensive endeavor requiring hefty research and development (R&D) and capital expenditures (capex).
The financial profile illustrated below is a little perplexing upon first glance. Although R&D expenses continue to rise and net losses continue to mount, Archer’s cash balance has risen from its low points. That’s quite peculiar given that Archer is pre-revenue.
There are a couple of ways Archer has managed to keep its liquidity afloat while consistently burning cash. The company has a number of strategic relationships with other aircraft companies. Stellantis, for example, works closely with Archer on the manufacturing side and has been a strong financial supporter of the business.
In addition to these investments, Archer more recently relied on a $175 million private investment in public equity (PIPE) from Stellantis and United Airlines. While this solves liquidity concerns in the short term, the opportunity cost of such a transaction dilutes Archer shareholders.
Should you invest in Archer stock at $3?
As of this writing Archer boasts a market capitalization about $1.1 billion. Since Archer has purchase orders valued at $6 billion, the valuation might look like a steal.
However, I just haven’t bought into Archer’s whole narrative. In general, I don’t think purchase orders carry much value. Considering that Archer is still working with the Federal Aviation Administration (FAA) on its commercialization efforts, and there are question marks about its mass production and manufacturing capabilities, it’s hard to make a case for Archer shares being cheap simply because they’re “only” $3.
On top of that, I think Archer may not fully reach considerable scale. It’s difficult to believe that the same number of people who can afford an Uber will also be able to access a flying taxi if need be; from afar, it looks like a luxury and a niche service. If you’re curious why Archer may compel Cathie Wood, I’m going to theorize that her position in the stock is an industry basket approach since ARK also owns shares of Joby Aviation — one of Archer’s closest competitors.
For all of these reasons, I think Archer is too speculative for most investors right now. While a $3 share price might make the company seem like a dirt cheap opportunity, it’s hard to justify a billion-dollar valuation on a company with zero revenue, high cash burn, outside financial lifelines from larger companies that may eventually turn away, and questionable long-term viability.
Should you invest $1,000 in Archer Aviation right now?
Before you buy stock in Archer Aviation, consider this:
The Motley Fool Stock Advisor analyst team just identified what they believe are the 10 best stocks for investors to buy now… and Archer Aviation wasn’t one of them. The 10 stocks that made the cut could produce monster returns in the coming years.
Consider when Nvidia made this list on April 15, 2005… if you invested $1,000 at the time of our recommendation, you’d have $630,099!*
Stock Advisor provides investors with an easy-to-follow blueprint for success, including guidance on building a portfolio, regular updates from analysts, and two new stock picks each month. The Stock Advisor service has more than quadrupled the return of S&P 500 since 2002*.
*Stock Advisor returns as of September 9, 2024
Adam Spatacco has positions in Tesla. The Motley Fool has positions in and recommends Tesla and Uber Technologies. The Motley Fool recommends Stellantis. The Motley Fool has a disclosure policy.
Down 69%, Is This Cathie Wood Stock a Bargain for Just $3? was originally published by The Motley Fool
Where America's Wealthiest Are Moving: Top 10 Cities For $150K+ Earners
While conventional wisdom might suggest most move to sun-soaked southern states, the reality is more nuanced than that. Florida does make a showing, but the list of top destinations for wealthy transplants spans much of the U.S.
Don’t Miss:
According to CNBC, the Deltona-Daytona Beach-Ormond Beach metro area in Florida tops the list, with a 171% net growth in high-income residents in 2023.
The College Station area in Texas – home to Texas A&M University – claimed the second spot with a 132% increase in wealthy residents.
Trending: Warren Buffett once said, “If you don’t find a way to make money while you sleep, you will work until you die.” These high-yield real estate notes that pay 7.5% – 9% make earning passive income easier than ever.
California, which has lost residents recently, also made the list. The Santa Maria metro area ranked third, with a 127% net growth in high-income households.
Florida made a second appearance on the list, with the North Port-Sarasota-Bradenton area seeing a 68% increase.
The Midwest also ranked, with Ann Arbor, Michigan – home to the University of Michigan – grabbing fifth place. The college town saw a 63% net growth in high-earners in 2023.
Rounding out the top 10 are:
– Provo, Utah (40% increase)
– Akron, Ohio (35% increase)
– Austin, Texas (34% increase)
– Knoxville, Tennessee (33% increase)
– Fresno, California (32% increase)
See Also: This city is the clear winner of Zillow’s 2024 Home Value Forecast — No surprise as the number of millionaires there grew by 75% in the last decade.
Those migration patterns don’t necessarily align with overall moving trends, though. CNBC’s analysis found that households in the top 20% of earners were the least likely to move in 2023, with only 6.5% relocating compared to 9% of those in the bottom 20%.
Of the high-earners who moved, 53% stayed within the same county. However, when they did venture out, they were more likely than lower-income groups to cross state lines, with 19% of wealthy movers relocating to a different state.
And the motivations behind the moves vary. While middle-class Americans often cited cheaper housing as a reason to relocate, it was a factor for only 6% of high-income movers. Instead, 18% of wealthy movers relocated for new or better housing. Career opportunities also played a role, with 12% of high-earners moving for a new job or transfer.
Trending: Elon Musk’s secret mansion in Austin revealed through court filings. Here’s how to invest in the city’s growth before prices go back up.
While an influx of high-earning residents can boost local businesses and tax bases, it may also exacerbate housing affordability issues for longtime residents. With remote work continuing to offer flexibility and economic uncertainties persisting, the migration patterns of America’s wealthiest may continue to evolve and impact local communities.
Read Next:
“ACTIVE INVESTORS’ SECRET WEAPON” Supercharge Your Stock Market Game with the #1 “news & everything else” trading tool: Benzinga Pro – Click here to start Your 14-Day Trial Now!
Get the latest stock analysis from Benzinga?
This article Where America’s Wealthiest Are Moving: Top 10 Cities For $150K+ Earners originally appeared on Benzinga.com
© 2024 Benzinga.com. Benzinga does not provide investment advice. All rights reserved.
Dave & Buster's Gears Up For Q2 Print; Here Are The Recent Forecast Changes From Wall Street's Most Accurate Analysts
Dave & Buster’s Entertainment, Inc. PLAY will release earnings results for its second quarter, after the closing bell on Tuesday, Sept. 10.
Analysts expect the Coppell, Texas-based company to report quarterly earnings at 84 cents per share, up from 60 cents per share. Dave & Buster’s projects to report quarterly revenue of $560.65 million for the quarter, according to data from Benzinga Pro.
On June 13, Dave & Buster’s reported worse-than-expected first-quarter financial results.
Dave & Buster’s shares fell 2.2% to $30.11 in after-hours trading.
Benzinga readers can access the latest analyst ratings on the Analyst Stock Ratings page. Readers can sort by stock ticker, company name, analyst firm, rating change or other variables.
Let’s have a look at how Benzinga’s most-accurate analysts have rated the company in the recent period.
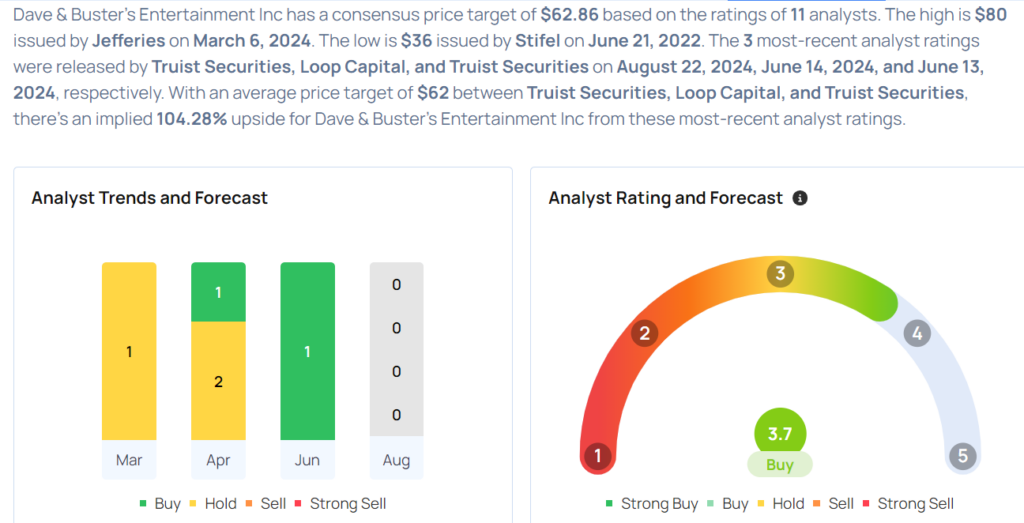
- Truist Securities analyst Jake Bartlett maintained a Buy rating and cut the price target from $64 to $59 on Aug. 22. This analyst has an accuracy rate of 74%.
- BMO Capital analyst Andrew Strelzik maintained an Outperform rating and lowered the price target from $75 to $65 on June 13. This analyst has an accuracy rate of 65%.
- Piper Sandler analyst Nicole Miller Regan downgraded the stock from Overweight to Neutral and raised the price target from $50 to $71 on April 4. This analyst has an accuracy rate of 75%.
- UBS analyst Dennis Geiger maintained a Neutral rating and raised the price target from $60 to $66 on April 3. This analyst has an accuracy rate of 69%.
- Raymond James analyst Brian Vaccaro downgraded the stock from Outperform to Market Perform on March 25. This analyst has an accuracy rate of 82%.
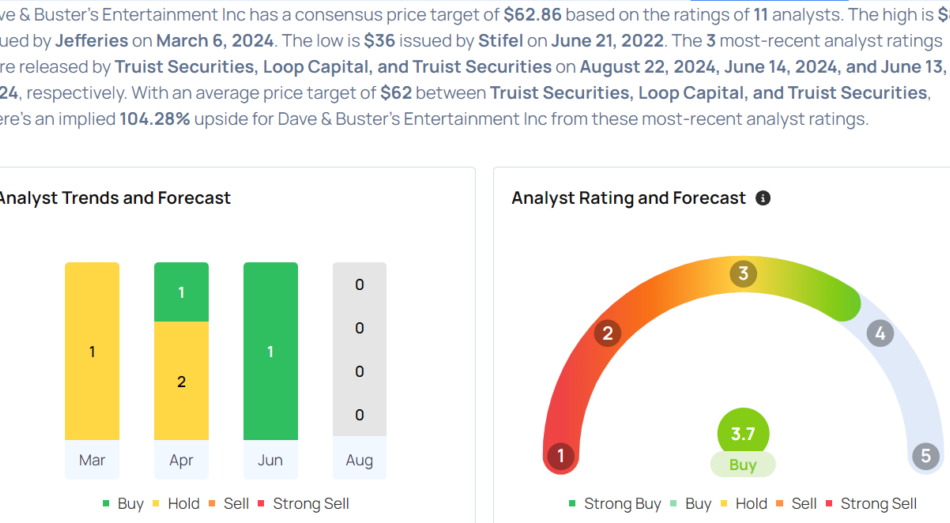
Considering buying PLAY stock? Here’s what analysts think:
Read This Next:
Market News and Data brought to you by Benzinga APIs
© 2024 Benzinga.com. Benzinga does not provide investment advice. All rights reserved.
This Johnson Controls International Analyst Turns Bullish; Here Are Top 5 Upgrades For Tuesday
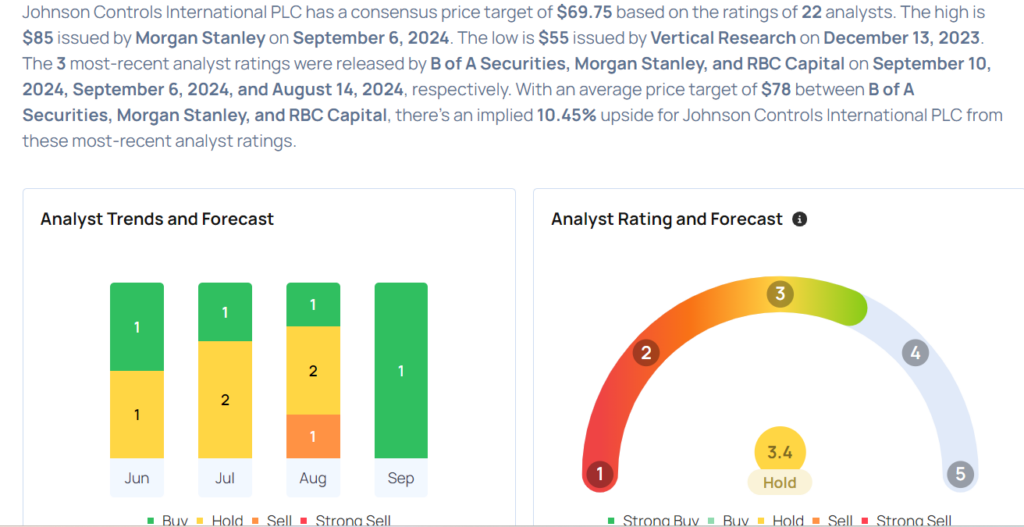
Top Wall Street analysts changed their outlook on these top names. For a complete view of all analyst rating changes, including upgrades and downgrades, please see our analyst ratings page.
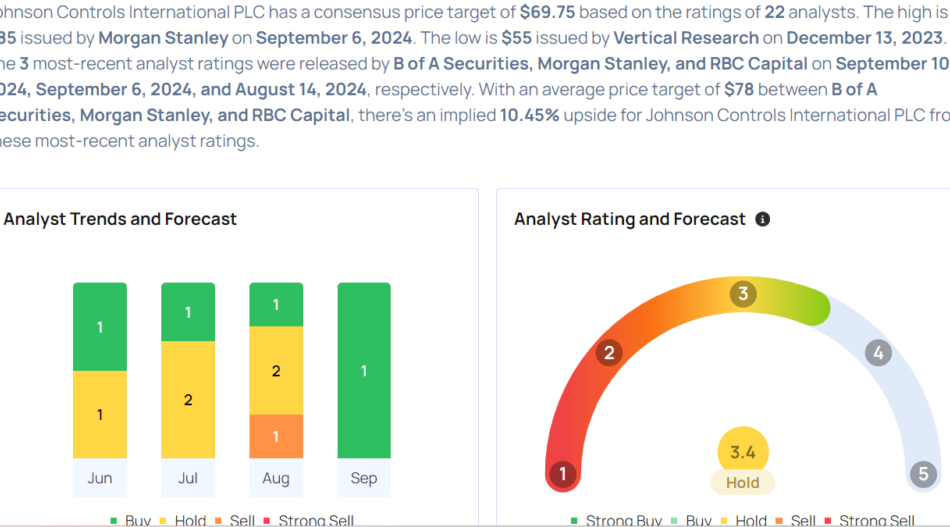
Considering buying JCI stock? Here’s what analysts think:
Read More:
Market News and Data brought to you by Benzinga APIs
© 2024 Benzinga.com. Benzinga does not provide investment advice. All rights reserved.

