In our recent two-part series on the yield curve (Part One, Part Two) we discussed the four predominant yield curve shifts and what they imply about economic activity and monetary policy. Additionally, given the current bullish steepening trend of the yield curve, we provided data on how prior bull steepening environments impacted various stock indexes, sectors, and factors. Missing from our analysis was a discussion of a specific type of REIT whose valuations are well correlated with the shape of the yield curve. If you are buying this bull steepener, agency REITs are worth your consideration.
What Is An Agency Mortgage REIT?
REITs own, manage, or hold the debt on income-producing properties. REITs must pay out at least 90% of their taxable profits to shareholders annually. This unique legal structure makes investment analysis of REITs different than most companies. REIT investors must analyze how changing economic, financial market, and monetary policy conditions affect the interplay between their underlying assets and liabilities.
Within the REIT category are a subclass investors call agency REITs. These companies own mortgages on residential real estate. Furthermore, as connotated by the word “agency,” most of the mortgages are secured and guaranteed against default by government agencies such as Fannie Mae, Freddie Mac, and Ginnie Mae. These securities are called Mortgage-Backed Securities (MBS). Because the U.S. government owns the agencies, MBS is essentially free of credit risk.
How Agency REITs Make Money
Agency REIT earnings primarily come from three sources: the spread between the assets and liabilities (mortgage yield and debt), hedging costs, and the amount of leverage employed.
Hypothetically, let’s start a new agency REIT to help you appreciate how they operate.
We solicit $1 billion from equity investors.
A significant portion of the $1 billion is used to buy mortgage-backed securities (MBS).
We then borrow $4 billion from a bank using the $1 billion of MBS as collateral.
The proceeds from the $4 billion loan also purchase MBS.
Our new REIT has about $5 billion of MBS against $1 billion of equity and $4 billion of debt.
As a result, the REIT has 5x leverage.
Assuming our mortgages pay 6% and our debt costs 4%, we can make $140 million a year, equating to a 14% return for our equity holders. That handily surpasses the 6% return if leverage wasn’t employed.
The math is relatively simple. On the $1 billion of MBS funded with equity, the REIT will make 6% or $60 million. On the $4 billion of MBS funded with debt, the REIT will earn the 2% difference between the MBS and the debt, or $80 million. The total earnings of $140 million divided by the $1 billion equity stake equals 14%.
Unfortunately, managing an agency REIT is not nearly as simple as we illustrate.
The Complexities Of Agency REIT Portfolio Management
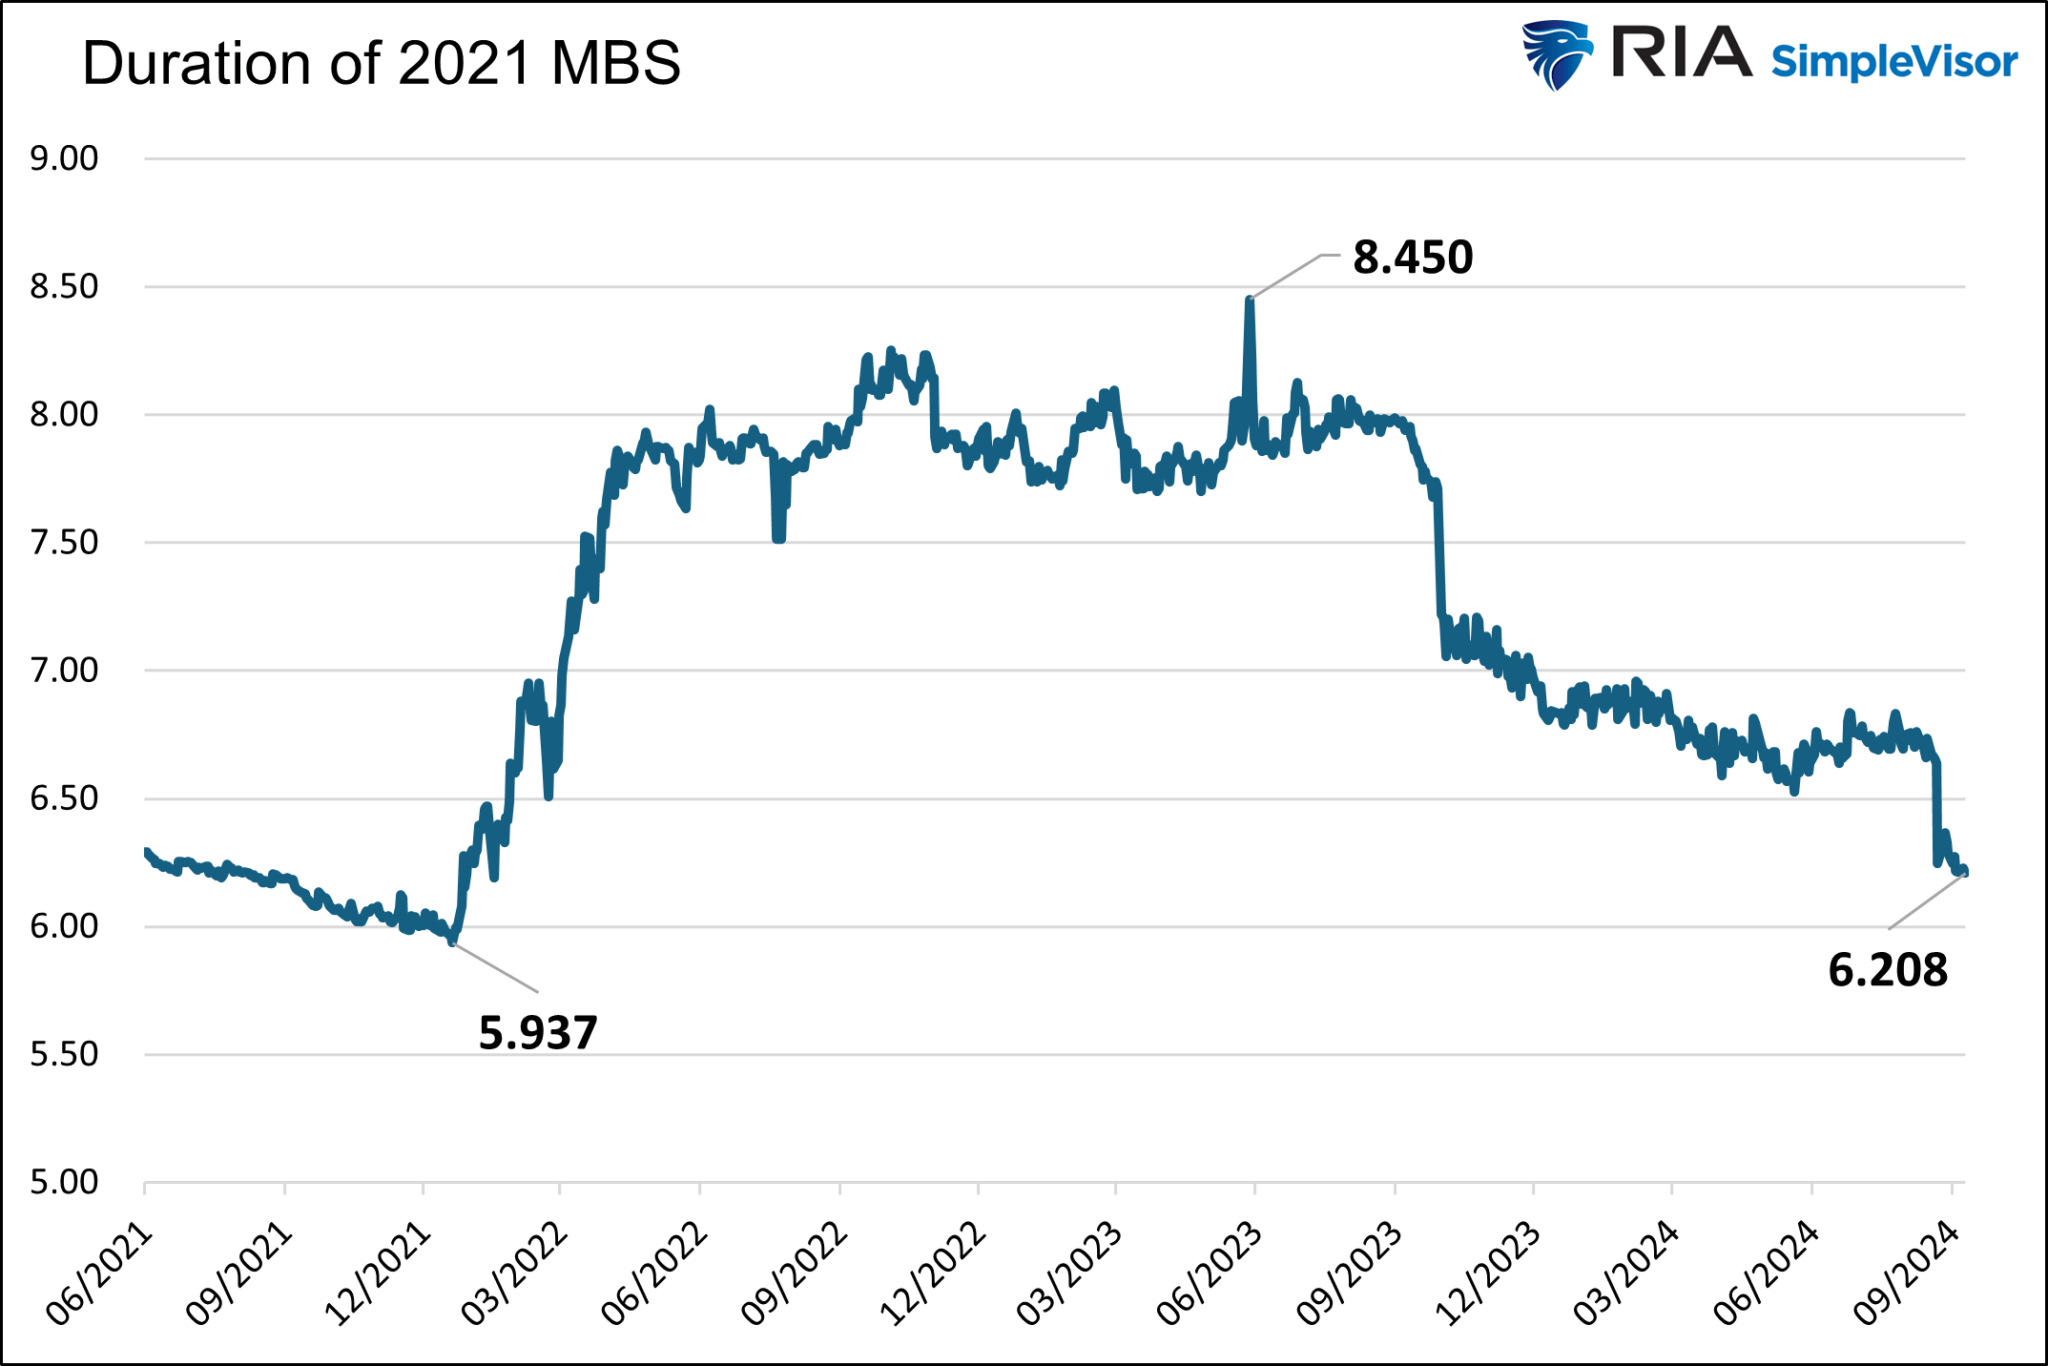
MBS are a unique type of bond. The mortgagors, homeowners, can partially or fully pay down their mortgages whenever they want. As a result of the unique prepay option, the duration of MBS varies significantly with mortgage rates. At the same time, the duration of a REIT’s liabilities are much more stable. Accordingly, the portfolio managers take on duration mismatch risk.
The following chart shows the duration of a Fannie Mae MBS originated in 2021. The weighted average mortgage rates of the underlying loans in the MBS are 3.36%. When rates started rising rapidly in 2022, the mortgagors had no incentive to prepay their loans. As a result, the duration of this MBS rose by 2.50 years. Since then, the duration has fallen with mortgage rates, as the odds of prepayments have increased. A duration change of 2.50 years may not seem like a lot, but when leverage is used, such a change can result in a relatively large duration mismatch and significant gains or losses.
Because the duration of our MBS varies and our liabilities are relatively constant, agency REITs are constantly hedging duration risk. Furthermore, the yield spread between MBS and Treasuries introduces spread risk. The more a REIT hedges to minimize potential duration mismatches or spread risk, the less risk they take. But the hedging costs eat into profits. Lesser hedging can produce more profits but poses more significant risks.
A Steeper Yield Curve Should Help REITs
Like banks, most agency REITs borrow for shorter terms than the duration of their assets. Creating such a mismatch in a positively sloped yield curve can result in additional profits as borrowing costs are less than asset yields.
If the bull steepener yield curve trend continues, agency REIT MBS should gain value. However, the duration of the MBS will shrink due to prepayments. New MBS replacements will have lower yields. However, funding costs should decline. There are many moving parts to consider. While the environment is conducive for profits, as we noted earlier, the performance of agency REITs comes down to hedging accumen.
Several agency REITs are worth exploring, but for demonstration purposes, we focus on the oldest and largest public agency REIT, Annaly Capital Management (NLY). RIA
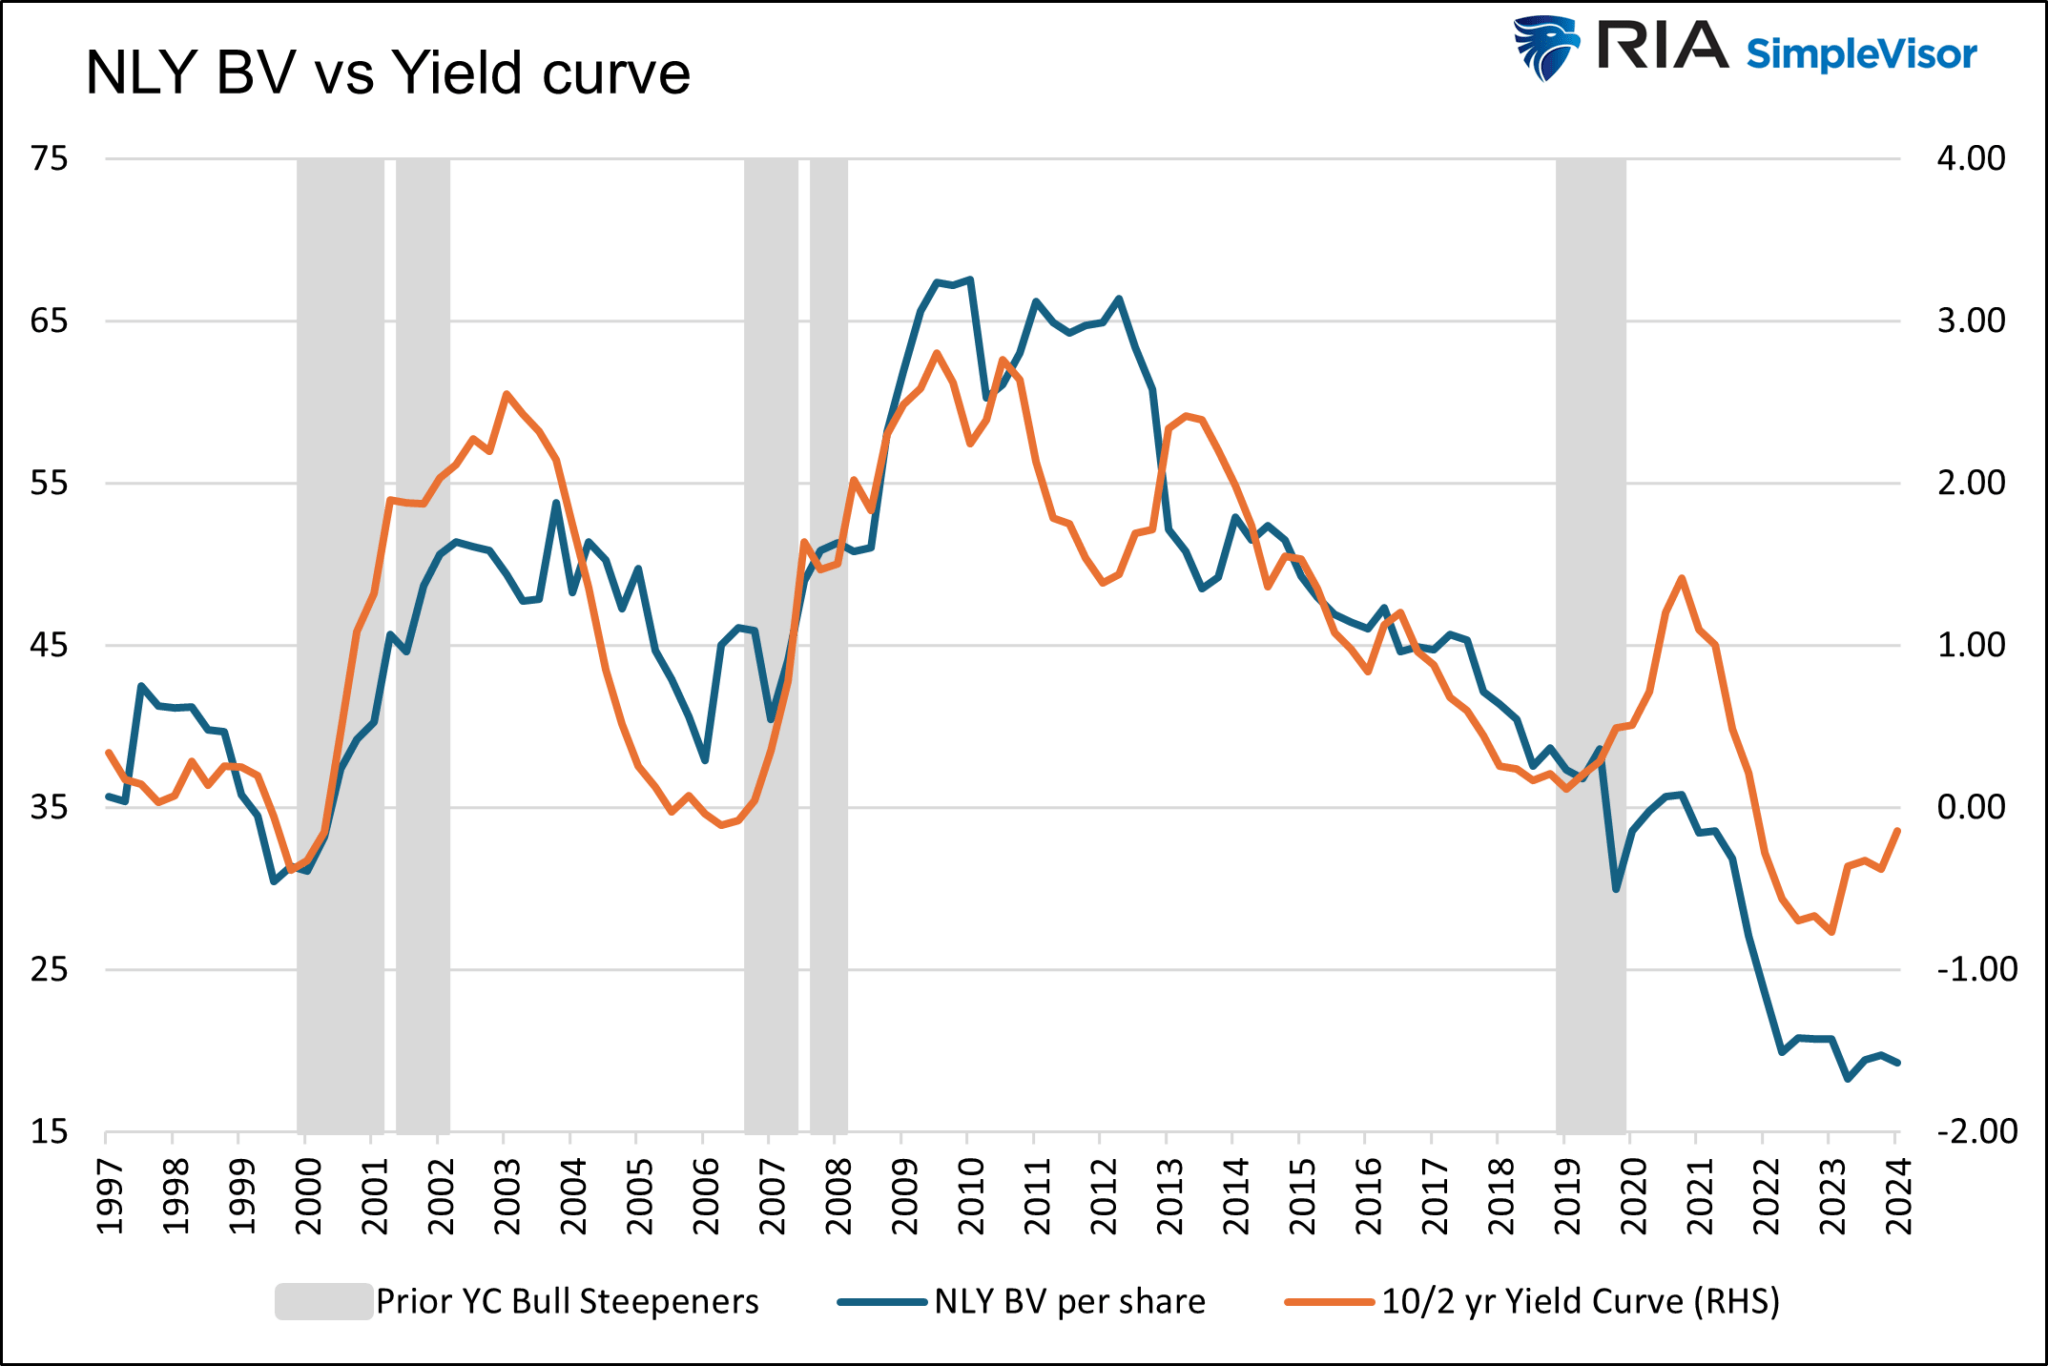
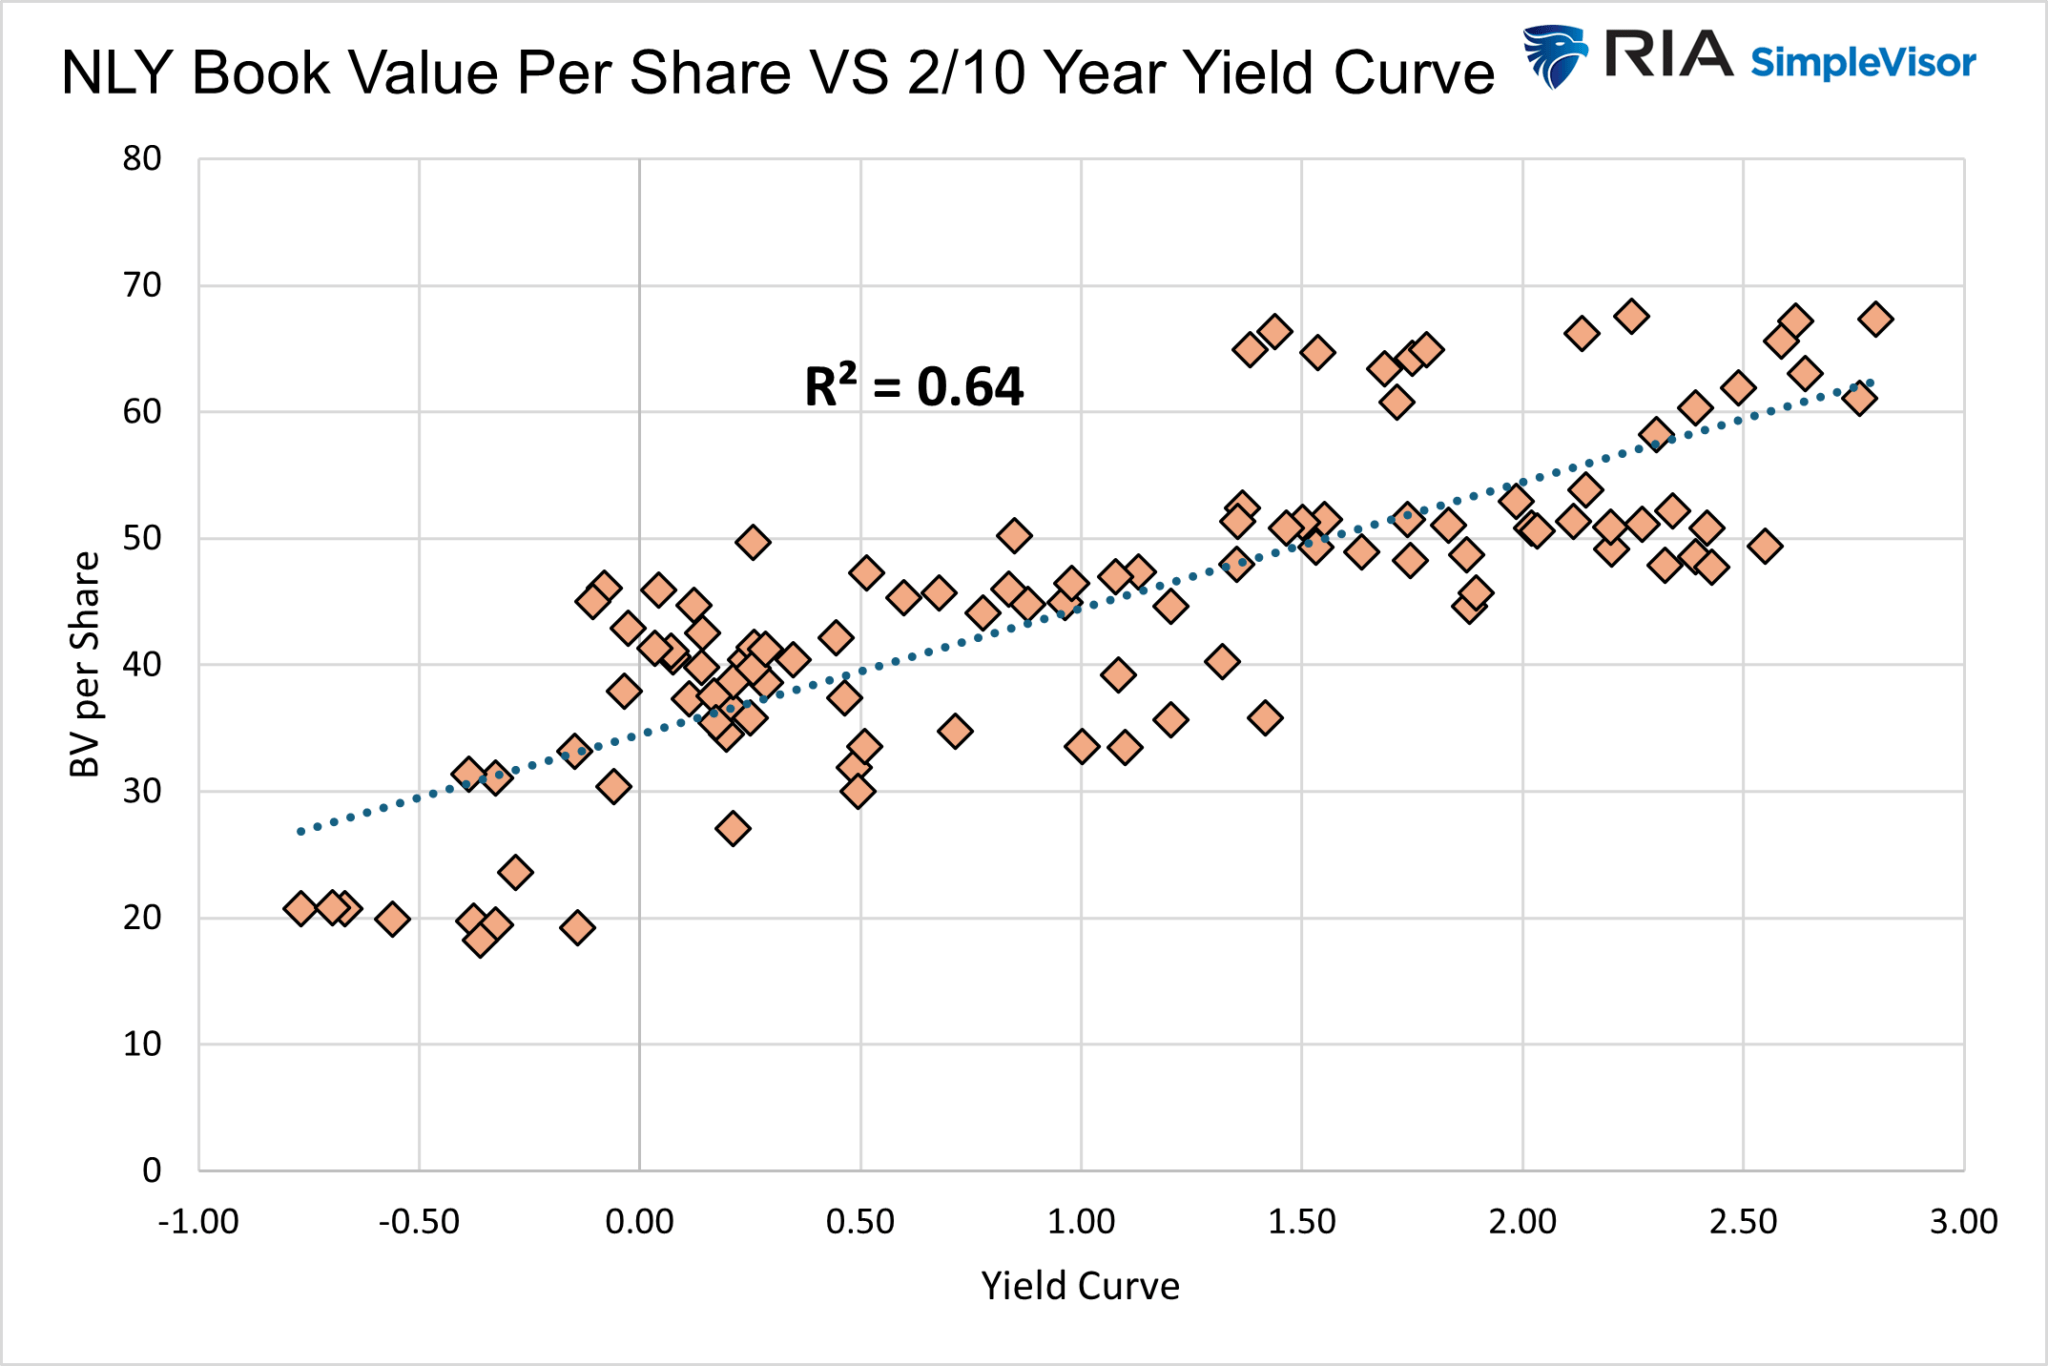
The graph below compares NLY’s book value per share with the 10/2-year yield curve. The gray bars highlight the last five persistent bull steepener periods. Its book value and the yield curve track each other closely. The high correlation is shown in the second graph.
NLY’s BV per share has risen during bull steepeners, except for 2020.
NLY has averaged a 19% return during the five latest bull steepeners. That beats every other equity asset in the graph below, except for gold miners.
No Guarantees
While NLY has done well during bull steepeners on average, it did lose 30% during the pandemic. As such, we shouldn’t take the yield curve environment for granted. However, the rare nature of the pandemic resulted in hedging difficulties due to volatile bond markets and irregular mortgagor behaviors. A repeat of similar conditions is unlikely.
Investors should be aware of market valuations in addition to the fundamental valuation of REIT portfolios. The other reason for NLY’s steep decline in 2020 was fearful equity investors. As shown below, courtesy of Zacks, NLY’s price-to-book value fell from nearly 1.00 before the pandemic to 0.68 at the end of March 2020. Investors were fearful and discounted the stock by over 30% from its book value.
There are additional risks as follows:
The current bull steepener ends as bond yields increase and the yield curve re-inverts. In such a scenario, book value would likely fall.
Leverage is easy to maintain when markets are liquid; however, in 2008, REITs were forced to sell assets and reduce leverage, negatively affecting earnings and dividends.
Management does not adequately hedge the portfolio.
Summary
Despite double-digit dividend yields in many cases and the cushion such high dividends provide, buying agency REITs is not a guaranteed home run in a bull steepener. That said, these firms offer investors a way to benefit from a steepening yield curve while avoiding an earnings slowdown that may hamper many stocks in an economic downturn.
Michael Lebowitz, CFA is an Investment Analyst and Portfolio Manager for RIA Advisors. specializing in macroeconomic research, valuations, asset allocation, and risk management. RIA Contributing Editor and Research Director. CFA is an Investment Analyst and Portfolio Manager; Co-founder of 720 Global Research.
Tesla (TSLA) has a big October, with both its robotaxi reveal and third-quarter earnings on the calendar. However, the EV giant’s first hurdle will be when it reports global Q3 vehicle deliveries next week, with analysts projecting the third-best total ever. TSLA shares advanced Wednesday.
If it sticks to its previous third-quarter delivery report schedule, Tesla should announce the data on Wednesday, Oct. 2.
Analyst consensus has Tesla global Q3 deliveries totaling 462,000 units, up 6% vs. Q3 2023, according to FactSet. This total would represent the third-best quarterly delivery total ever for Tesla, behind Q2 2023’s 466,140 and Q4 2023’s record-setting 484,507 deliveries. Analysts project Tesla matching its record total in the fourth quarter, meaning unit sales would be flat compared to a year ago.
↑ X
NOW PLAYING Tesla’s Robotaxi Is Delayed. Will It Make A Difference For Tesla Stock?
Vehicle deliveries in the second quarter topped analyst expectations but arguably the bigger story was the quarterly performance of Tesla’s energy business.
Tesla stock jumped more than 1% to 257.02 during market action on Wednesday after gaining 1.7% to 254.27 on Tuesday — climbing further above its 50-day moving average to within around 6% of its July high.
Tesla Delivery Estimate Revisions
It is common for delivery estimates to change in the days prior to the announcement.
RBC Capital analyst Tom Narayan this week has increased his Tesla Q3 delivery view to 460,000, up from his previous 455,000 estimate. RBC Capital has an outperform rating and a 224 price target on Tesla stock.
Meanwhile, Piper Sandler analyst Alexander Potter on Tuesday raised the firm’s price target on Tesla to 310, from 300, while increasing the Q3 delivery estimate to 459,000 units and 1.75 million vehicles in 2024.
On Monday, Barclays wrote that it expects Q3 deliveries totaling 470,000 vehicles, which is well above the consensus estimate. The firm said that Q3 volume strength will be driven almost entirely by China while Europe has been a weak spot for Tesla.
Guggenheim Securities analyst Ron Jewsikow on Sept. 20 forecast third-quarter deliveries of 456,000, slightly below the consensus view but well above the analyst’s previous estimate of 435,000.
GLJ Research analyst Gordon Johnson on Wednesday projected that Tesla’s Q3 deliveries will come in at 456,600, up from its previous forecast of 449,000. Johnson added that the buy-side “whisper” estimate is for Q3 deliveries to come in above 470,000.
Strong Quarterly Performance In China
With just one week left in the third quarter, Tesla registrations in China, a rough gauge for deliveries, are up 20% compared to last quarter and have increased more than 18% vs. a year ago.
Tesla’s China vehicle registrations in Q3 are now about 1% above its previous best quarterly performance in China, during Q4 2023.
Tesla’s year-to-date China registrations have also turned positive in recent weeks. So far in 2024, Tesla registrations in China are up 2% compared to the same time frame in 2023.
Tesla China is benefiting from continued five-year, zero-interest loans to buyers, as well as increased government subsidies for EVs. These are currently running through the end of September.
However as of Sept. 11, Tesla vehicle deliveries in Europe are down more than 16% so far this year, according to Troy Teslike, whose delivery estimates and Tesla data tracking are highly respected among retail Tesla investors.
Teslike has also posted to X in recent weeks that “Tesla is balancing out weaker U.S. sales with stronger sales in China.”
Tesla Stock Performance
TSLA shares rose 3.5% to 238.25 last week, clearing an aggressive entry of 235. TSLA stock has an official 271 buy point from a cup base, according to MarketSurge.
On Sept. 5, shares popped above their 50-day moving average, buoyed by robust China sales and the EV giant’s full self-driving rollout plans.
TSLA shares are up 20% in September after declining 7.7% in August. Tesla stock has battled back in 2024 and is now up 2% on the year, after rebounding more than 80% from a late-April low.
Tesla has a busy October ahead, with third-quarter deliveries, the robotaxi event on Oct. 10, and Q3 earnings expected to be on Oct. 16.
Market expectations for the Federal Reserve’s next interest rate move could gain more clarity as early as this Friday, when a U.S. government agency releases a key inflation metric closely monitored by policymakers.
The Personal Consumption Expenditure (PCE) price index report, scheduled for release on Friday, Sept. 27, at 8:30 a.m. ET, will provide critical insights into August’s inflation trends.
As the Fed’s preferred inflation gauge, the PCE is seen as a crucial indicator that could influence decisions on whether another rate cut will occur at the next Federal Open Market Committee (FOMC) meeting on Nov. 7.
Currently, market-implied probabilities suggest a 60% chance that the Fed will enact a back-to-back 50-basis-point rate cut in November. The remaining odds are favoring a more modest reduction of 25 basis points, as per the CME FedWatch tool. However, this outlook could shift dramatically depending on how the upcoming PCE data performs.
Fed’s Confidence In Inflation Trajectory
“I estimate that the August PCE report will be very low,” Federal Reserve Governor Christopher Waller recently said. Earlier in the month, Waller reflected on July’s PCE data, noting that the 6- and 3-month annualized rates stood at 2.6% and 1.7%, respectively.
“These numbers are good news and suggest that our restrictive policy stance has put us on the right path to attain our 2% inflation target,” he added.
These comments, alongside the Fed’s focus on achieving its inflation goal, imply that another softer inflation reading could increase the likelihood of a back-to-back 50-basis-point rate cut in November.
August PCE Report: What Do Economists Expect?
Economist consensus, as tracked by TradingEconomics, predicts that annual headline PCE inflation will fall from 2.5% in July to 2.3% in August, marking the lowest inflation rate since February 2021.
On a month-over-month basis, the headline figure is expected to rise by just 0.1%, a slowdown from July’s 0.2% increase.
When excluding volatile food and energy prices, core PCE inflation is forecast to rise slightly, from 2.6% year-over-year in July to 2.7% in August.
On a monthly basis, core PCE inflation is projected to maintain its 0.2% growth rate, consistent with the previous month.
Market Reaction: A Look Back at Previous PCE Reports
In the last two PCE reports, the U.S. stock market responded positively as the data indicated easing inflation.
When the July PCE report, released on Aug. 30, came in below expectations, it sparked a stock rally. The S&P 500, as tracked by the SPDR S&P 500 ETF TrustSPY, surged 1%, closing at a record high. Meanwhile, tech stocks, represented by the Invesco QQQ Trust QQQ, outperformed, gaining 1.2%.
The June PCE report, released on July 26, met expectations, which helped boost investor confidence in the disinflation narrative. The S&P 500 rose 1.1%, while the SPDR Dow Jones Industrial Average ETFDIA jumped 1.6%.
Read Next:
Image created using artificial intelligence via Midjourney.
If You Invested $1,000 In Bitcoin When Jamie Dimon Said He Would Fire Employees ‘In A Second’ For Holding BTC, Here’s How Much You’d Have Today
JPMorgan & Chase (NYSE:JPM) CEO Jamie Dimon is among the finance executives who have vocally opposed the cryptocurrency sector over the years.
While Dimon’s stance has changed slightly with JPMorgan now owning Bitcoin through ETFs, his comments about the death of the cryptocurrency sector live on.
Don’t Miss:
What Happened: Dimon likely made some enemies in the cryptocurrency sector with his statements seven years ago.
While speaking at the Barclays Global Financial Services Conference on Sept. 17, 2017, Dimon didn’t hold back with his criticism of Bitcoin (CRYPTO: BTC) and the cryptocurrency sector.
Dimon referred to Bitcoin as being “stupid” and “dangerous” and went as far to label the leading cryptocurrency as fraud. The JPMorgan executive also said that if he caught any of his company’s employees buying or selling Bitcoin, he would “fire them in a second.”
“It’s against our rules, and they’re stupid. And both are dangerous,” Dimon said at the time, as reported by Bloomberg.
During his speech, Dimon predicted that Bitcoin would collapse, comparing the rising valuations to the Tulipmania in the Netherlands in the 1600s, when the price of bulbs reached new highs and then collapsed.
“You can’t have a business where people can invent a currency out of thin air and think the people buying it are really smart. It’s worse than tulip bulbs.”
Dimon predicted at the time that it wouldn’t end well for investors.
“It will blow up, China’s just kicked them out, someone’s going to lose money somewhere else – don’t ask me to short it, it could be at $20,000 before this happens, but it’ll eventually blow up.”
Dimon was right about Bitcoin hitting $20,000, but so far has been wrong about the leading cryptocurrency blowing up.
Bitcoin traded as high as $4,344.65 on Sept. 12, 2017, the day of Dimon’s comments. An investor could have purchased 0.2302 BTC that day with $1,000.
Fast-forward to today, and the $1,000 investment in what Dimon said was a fraud and something that would become worthless is worth $14,574.14. This represents a hypothetical return of +1,357.41% over the last seven years.
For comparison, the same $1,000 invested in the SPDR S&P 500 ETF Trust (SPY), which tracks the S&P 500 Index, would be worth $2,278.68. This represents a return of +127.9% over the last seven years.
Why It’s Important: Dimon remained critical of Bitcoin and cryptocurrency for many years, as he also called for the sector to be shut down in 2023.
The JPMorgan executive has recently softened his stance on Bitcoin, as it has been reported that the bank he runs is exposed to Bitcoin via Bitcoin ETFs.
Many have been wrong to date when it comes to predicting the death of Bitcoin and the cryptocurrency sector.
While there could be a risk with cryptocurrency and investments in the sector, the same could likely be said for the stock market and other sectors.
BTC Price Action: Bitcoin trades at $63,310.79 at the time of writing versus a 52-week trading range of $26,011.47 to $73,750.07.
Check This Out:
Image via Flickr/ Fortune Live Media
Up Next: Transform your trading with Benzinga Edge’s one-of-a-kind market trade ideas and tools. Click now to access unique insights that can set you ahead in today’s competitive market.
Wilmington, Delaware, Sept. 25, 2024 (GLOBE NEWSWIRE) — Allied Market Research published a report, titled, “Dental Market by Product Type (Dental Consumables and Dental Equipment), and End User (Hospitals and Clinics, Academic Institute and Research Centers and Others): Global Opportunity Analysis and Industry Forecast, 2024-2033″. According to the report, the dental market was valued at $49.5 billion in 2023, and is estimated to reach $87.1 billion by 2033, growing at a CAGR of 5.8% from 2024 to 2033.
Prime determinants of growth
Rise in prevalence of oral diseases, increase in awareness of oral health, and growth in demand for aesthetic dentistry are the major factors that drive the growth of the dental market growth. However, the shortage of skilled dental professionals and high cost of dental procedures restrict the market growth. Moreover, advancements in dental technology and growth opportunities in emerging markets offer remunerative opportunities for the expansion of the global dental market.
By product type, the dental consumables segment is driven by the increasing demand for routine dental procedures and preventive care. Rising awareness of oral hygiene and preventive measures fuels the need for products such as dental hygiene items, fillings, and sealants. In addition, technological advancements in dental materials, such as high-quality composites and bonding agents, further enhance the appeal of consumables. Furthermore, the emphasis on affordable and accessible dental care supports the demand for disposable and cost-effective consumables.
Rise in adoption of dental products in hospital and dental clinics
By end user, the hospital and dental clinics segment held a substantial portion of the dental market share, primarily driven by their central role in delivering comprehensive dental care. Hospitals and clinics serve as primary providers of a wide range of dental services, from routine check-ups to complex procedures. The increasing number of dental clinics and the expansion of hospital dental departments contribute to the growth of this segment. In addition, the rising prevalence of dental diseases and the emphasis on preventive care further drive the demand for dental products provided in these settings.
Region wise, North America is expected to maintain its leadership in the dental market owing to an advanced healthcare infrastructure and a high standard of dental care, which drives demand for innovative dental solutions. Significant investments in dental technology and research enhance treatment options and attract patients. Additionally, a strong focus on preventive care and oral health awareness contributes to sustained market growth. High disposable incomes and access to cutting-edge dental services further solidify North America’s dominant position.
Key Players
OSSTEM IMPLANT CO., LTD.
Koninklijke Philips N.V.,
Align Technology, Inc.
The report provides a detailed analysis of these key players in the global dental market. These players have adopted different strategies such as agreement, expansion, product launch, and others to increase their market share and maintain dominant shares in different regions. The report is valuable in highlighting business performance, operating segments, product portfolio, and strategic moves of market players to showcase the competitive scenario.
In September 2023, Dentsply Sirona, the world’s largest manufacturer of professional dental products and technologies, and 3Shape, a leading innovator of digital solutions for dental patient care, opened the next chapter in their workflow integrations. The harmonization of DS Core, Primemill and Primeprint, with the 3Shape TRIOS intraoral scanner powered by 3Shape Unite, creates more integrated workflows for digital dentistry.
In April 2022, Envista Holdings Corporation announced the completion of the acquisition of Carestream Dental’s Intraoral Scanner business. As previously announced, this business will be rebranded as DEXIS and will operate as part of the Envista equipment and consumables segment.
AVENUE- A Subscription-Based Library (Premium on-demand, subscription-based pricing model) Offered by Allied Market Research:
AMR introduces its online premium subscription-based library Avenue, designed specifically to offer cost-effective, one-stop solution for enterprises, investors, and universities. With Avenue, subscribers can avail an entire repository of reports on more than 2,000 niche industries and more than 12,000 company profiles. Moreover, users can get an online access to quantitative and qualitative data in PDF and Excel formats along with analyst support, customization, and updated versions of reports.
Allied Market Research (AMR) is a full-service market research and business-consulting wing of Allied Analytics LLP based in Wilmington, Delaware. Allied Market Research provides global enterprises as well as medium and small businesses with unmatched quality of “Market Research Reports” and “Business Intelligence Solutions.” AMR has a targeted view to provide business insights and consulting to assist its clients to make strategic business decisions and achieve sustainable growth in their respective market domains. AMR offers its services across 11 industry verticals including Life Sciences, Consumer Goods, Materials & Chemicals, Construction & Manufacturing, Food & Beverages, Energy & Power, Semiconductor & Electronics, Automotive & Transportation, ICT & Media, Aerospace & Defense, and BFSI.
We are in professional corporate relations with various companies and this helps us in digging out market data that helps us generate accurate research data tables and confirms utmost accuracy in our market forecasting. Allied Market Research CEO Pawan Kumar is instrumental in inspiring and encouraging everyone associated with the company to maintain high quality of data and help clients in every way possible to achieve success. Each and every data presented in the reports published by us is extracted through primary interviews with top officials from leading companies of domain concerned. Our secondary data procurement methodology includes deep online and offline research and discussion with knowledgeable professionals and analysts in the industry.
(Bloomberg) — Applications to refinance mortgages surged for a second week as more Americans capitalized on the cheapest borrowing costs in two years.
Most Read from Bloomberg
The Mortgage Bankers Association’s refinancing index jumped 20.3% in the week ended Sept. 20 to the highest level since April 2022, the group said Wednesday. The contract rate on a 30-year fixed mortgage eased 2 basis points to 6.13%, the eighth straight weekly drop and the longest stretch of declines since 2018-2019.
That helped boost the group’s home-purchase applications index by 1.4% last week to the highest level since early February. The fifth straight weekly advance in the measure points to burgeoning demand in a housing market that’s gradually finding some footing.
At the same time, home financing costs may start to stabilize. Yields on the 10-year Treasury note have edged higher in the last week as traders debate the magnitude of Federal Reserve’s expected interest-rate cut in November as well as the path for reductions.
The average contract rate on a 15-year mortgage and the five-year adjustable-rate mortgage ticked up last week after sharp declines in the prior two weeks.
The MBA survey, which has been conducted weekly since 1990, uses responses from mortgage bankers, commercial banks and thrifts. The data cover more than 75% of all retail residential mortgage applications in the US.
Wilmington, Delaware, Sept. 25, 2024 (GLOBE NEWSWIRE) — Allied Market Research published a report, titled, “DeferasiroxMarket by Product Type (90 mg, 125 mg, 250 mg, 360 mg and Others), Application (Transfusional Iron Overload and NTDT Caused Iron Overload), and Distribution Channel (Hospital Pharmacies, Retail Pharmacies and Online Providers): Global Opportunity Analysis and Industry Forecast, 2024-2033″. According to the report, the deferasirox market was valued at $2.9 billion in 2023, and is estimated to reach $4.6 billion by 2033, growing at a CAGR of 4.7% from 2024 to 2033.
Prime determinants of growth
Increase in prevalence of iron overload disorders, increase in research and development activities, and rise in awareness and screening programs are the major factors that drive the deferasirox market growth. However, the side effects associated with drug may restricts the market growth. Moreover, growth avenues in emerging markets offer remunerative opportunities for the expansion of the global deferasirox market.
By product type, the others segment is driven by the rise in demand for deferasirox dosages due to its efficacy in treating chronic iron overload in patients with transfusion-dependent anemias. In addition, advancements in pharmaceutical formulations have enhanced patient compliance and therapeutic outcomes. Furthermore, increased awareness and diagnosis of iron overload disorders, along with expanded healthcare access in emerging markets contributes towards the segment growth.
Rise in demand for deferasirox technology in transfusional iron overload
By application, the transfusional iron overload segment is driven by the growing prevalence of chronic conditions such as thalassemia and sickle cell anemia, which require frequent transfusions and thus pose a risk of iron overload. Additionally, advancements in treatment protocols and increasing awareness among healthcare providers contribute to segment growth. The transfusional iron overload segment is expected to see substantial market expansion owing to rise in incidence of transfusion-dependent anemias.
Rise in adoption of deferasirox in retail pharmacies
By distribution channel, the retail pharmacies segment held a substantial portion of the deferasirox market share, primarily driven by their accessibility and convenience for patients. Retail pharmacies offer direct, over-the-counter access to deferasirox, facilitating prompt treatment for chronic iron overload conditions. Their widespread presence ensures that patients can easily obtain their prescriptions without extensive wait times. The segment’s growth is further supported by increasing patient preference for convenient access to medications and the expanding network of retail pharmacies globally. This makes retail pharmacies a key distribution channel in the deferasirox market.
North America is expected to maintain its leadership in the deferasirox market owing to a well-established healthcare infrastructure and advanced medical research capabilities, which facilitate the development and distribution of deferasirox. In addition, rise in prevalence of conditions requiring iron chelation therapy is driving the demand for deferasirox. Furthermore, the presence of major pharmaceutical companies and increased awareness and better diagnostic capabilities contribute to higher rates of diagnosis and treatment, which thereby drives the market growth in this region.
Key Players
Dr. Reddy’s Laboratories, Inc.
Teva Pharmaceutical Industries Ltd.
Sun Pharmaceutical Industries Ltd.
Glenmark Pharmaceuticals Inc.
Taj Pharmaceuticals Limited
The report provides a detailed analysis of these key players in the global deferasirox market. These players have adopted different strategies such as agreement, product appeoval, and others to increase their market share and maintain dominant shares in different regions. The report is valuable in highlighting business performance, operating segments, product portfolio, and strategic moves of market players to showcase the competitive scenario.
AVENUE- A Subscription-Based Library (Premium on-demand, subscription-based pricing model) Offered by Allied Market Research:
AMR introduces its online premium subscription-based library Avenue, designed specifically to offer cost-effective, one-stop solution for enterprises, investors, and universities. With Avenue, subscribers can avail an entire repository of reports on more than 2,000 niche industries and more than 12,000 company profiles. Moreover, users can get an online access to quantitative and qualitative data in PDF and Excel formats along with analyst support, customization, and updated versions of reports.
Allied Market Research (AMR) is a full-service market research and business-consulting wing of Allied Analytics LLP based in Wilmington, Delaware. Allied Market Research provides global enterprises as well as medium and small businesses with unmatched quality of “Market Research Reports” and “Business Intelligence Solutions.” AMR has a targeted view to provide business insights and consulting to assist its clients to make strategic business decisions and achieve sustainable growth in their respective market domains. AMR offers its services across 11 industry verticals including Life Sciences, Consumer Goods, Materials & Chemicals, Construction & Manufacturing, Food & Beverages, Energy & Power, Semiconductor & Electronics, Automotive & Transportation, ICT & Media, Aerospace & Defense, and BFSI.
We are in professional corporate relations with various companies and this helps us in digging out market data that helps us generate accurate research data tables and confirms utmost accuracy in our market forecasting. Allied Market Research CEO Pawan Kumar is instrumental in inspiring and encouraging everyone associated with the company to maintain high quality of data and help clients in every way possible to achieve success. Each and every data presented in the reports published by us is extracted through primary interviews with top officials from leading companies of domain concerned. Our secondary data procurement methodology includes deep online and offline research and discussion with knowledgeable professionals and analysts in the industry.
As your first year of retirement progresses, it’s important to evaluate whether the financial plan you laid out to ensure your sustainable well-being is going according to plan. An appropriate plan should include tax calculations to understand how much of your income will truly be at your disposal for needs and wants.
Some people may think that because you pay for Social Security benefits throughout your lifetime via payroll taxes, it’s a tax-free benefit. However, this is often not the case. Both the amount of your Social Security benefits subject to taxes and the tax rate itself will depend on a handful of factors personal to your situation.
In short, you might pay taxes on 0%, 50% or 85% of your Social Security retirement benefits. This is depending on your provisional income, though:
Provisional income = Taxable income + Tax-exempt interest + ½ of annual Social Security benefits
You then would compare your provisional income to that year’s income threshold to determine what portion of your Social Security benefits will be taxed. Your tax rate will be your marginal rate. For a single filer, the thresholds are as follows for the 2023 tax year:
SmartAsset and Yahoo Finance LLC may earn commission or revenue through links in the content below.
For example, if you had $25,000 in 401(k) withdrawals, $5,000 in tax-exempt bond interest and $29,000 in annual Social Security benefits, your provisional income would be:
$25,000 + $5,000 + (½ x $29,000) = $44,500
Because this is beyond the $34,000 income threshold, 85% of your Social Security income will be taxed.
So, nearly $25,000 of your Social Security benefits ($29,000 x 0.85 = $24,650) for the year would be taxable in this case. Again, that’s only the amount of money you’ll be charged taxes on – not what you’re actually paying in taxes. The other roughly $4,000 would be tax-free.
In some cases, it may make sense to reduce your other income streams to prevent additional taxation of your Social Security benefits. While some advisors may recommend their client delays taking Social Security as long as possible to get increased benefits, it might be helpful to reduce the tax liability on Social Security income by delaying other income streams instead. For instance, you could push back distributions from a 401(k) or traditional IRA.
This is because any 401(k) or IRA distributions you take in a year will count toward your provisional income, putting you at risk of increased taxes on your Social Security benefits. However, in some cases this tradeoff may be well worth it, such as if you converted your 401(k) or IRA to a Roth IRA to save on taxes in the future. A financial advisor can help you do the calculations to see which strategy could be more beneficial.
Dealing With and Managing Your RMDs
If you’re in your 70s, you may be already taking or preparing to take required minimum distributions (RMDs) from your retirement accounts. RMDs will necessarily increase your provisional income in a lot of cases, but there may be ways to keep this income out of your provisional income to keep your tax rate on your Social Security benefits low.
For example, you can preempt the taxes by converting your 401(k) or traditional IRA to a Roth IRA. While this will trigger a tax bill up front, it may save even more than just taxes on your Social Security benefits in the long run, since Roth IRA distributions are tax-free. Note that you often cannot make penalty-free withdrawals from a Roth IRA within five years of opening an account, however.
Another alternative is to take an RMD as a qualified charitable distribution, or QCD, if you don’t need the money. QCDs are excluded from your taxable income and wouldn’t push you into a higher threshold of provisional income.
It’s important to plan for Social Security taxes in your overall retirement budget. Note that the portion of your benefits that are subject to taxes may change each year depending on your other income streams. In turn, you’ll want to plan ahead each year for these considerations.
Retirement Planning Tips
As you plan for your golden years, it’s important to get an accurate estimate of how much money you’ll have saved up by the time you retire. Luckily, SmartAsset’s retirement calculator can help you project how much money you may need to retire and whether you’re on track to hit this target.
A financial advisor can help you navigate the sometimes complex world of retirement planning. Finding a financial advisor doesn’t have to be hard. SmartAsset’s free tool matches you with up to three vetted financial advisors who serve your area, and you can have a free introductory call with your advisor matches to decide which one you feel is right for you. If you’re ready to find an advisor who can help you achieve your financial goals, get started now.
Keep an emergency fund on hand in case you run into unexpected expenses. An emergency fund should be liquid — in an account that isn’t at risk of significant fluctuation like the stock market. The tradeoff is that the value of liquid cash can be eroded by inflation. But a high-interest account allows you to earn compound interest. Compare savings accounts from these banks.
Are you a financial advisor looking to grow your business? SmartAsset AMP helps advisors connect with leads and offers marketing automation solutions so you can spend more time making conversions. Learn more about SmartAsset AMP.
Companies with high dividend yields can seem attractive, but there is far more to income stocks than above-average yields. Any corporation’s payouts are in danger without a robust business backing it up. That’s why choosing the right dividend stock requires looking beyond the yield and into the company’s fundamentals.
Let’s illustrate that with two examples: Pfizer(NYSE: PFE), and Medical Properties Trust(NYSE: MPW). While both have attractive yields, the former is a worthy investment, but the latter, not so much. Here’s why.
The high-yield stock to buy: Pfizer
The drugmaker’s stock isn’t popular on the market right now, with shares significantly lagging the market over the past two years. In the meantime, the stock’s dividend yield rose, and as of this writing, it stands at 5.7%. Despite Pfizer’s issues, the company can maintain its dividend program.
To be fair, Pfizer’s financial results are relatively poor compared to what it delivered in 2021 and 2022 — two years during which its sales skyrocketed thanks to its work in the coronavirus area. Yet, its top line inflected well above pre-pandemic levels, a very encouraging sign that points to secular growth in the business.
Pfizer’s COVID-19 drugs will eventually stop affecting its results as much. Moreover, there’s no letup in the company’s research & development expenses (which are far higher than pre-pandemic levels) that saw operating and net income drop below pre-COVID levels.
And so there is a strong possibility that a whole lot of products are in the pipeline, which should help the company return to profitable growth. Currently, Pfizer’s pipeline has over 100 programs. But two areas where the company is focusing its research efforts, and worth a special mention, are in the weight loss space and oncology.
Then, there are the company’s efforts in oncology. Pfizer acquired Seagen, an oncology specialist, for $43 billion. CEO Albert Bourla said of the acquisition: “We are not buying the golden eggs. We are acquiring the goose that is laying the golden eggs.” Seagen had several approved cancer drugs and a deep pipeline, but it was a much smaller company than Pfizer, with less funding and smaller footprints in the industry. Now that they are a single entity, Pfizer should become a much more prominent player in oncology.
So, despite a poorer showing over the last year or so, the company’s underlying business boasts excellent prospects. Pfizer’s dividend should be safe. It has increased its payouts by 17% in the past five years. Pfizer is a reliable, high-yield dividend stock to buy and hold.
The high-yield stock to avoid: Medical Properties Trust
Medical Properties Trust (MPT), a healthcare-focused real estate investment trust (REIT), has been bruised and battered since early 2023. The company’s revenue, earnings, and share price have all moved in the wrong direction.
Unlike in Pfizer’s case, this isn’t because MPT was falling from incredible heights. Here’s the reason. Steward Healthcare, one of its important tenants, had trouble keeping up with rent payments. Steward officially filed for bankruptcy in May.
As a result of this issue, MPT had no choice but to slash its dividends. It has done it twice since mid-2023. MPT’s yield remains impressive at 5.56%. Still, dividend seekers loathe payout cuts, so MPT might not be the best option right now.
Some will object that the company looks on the verge of putting its Steward-related problems in the rearview mirror. True enough. MPT recently reached agreements to put new tenants in 15 of the 23 hospitals previously operated by Steward Healthcare. The average term of the lease is about 18 years.
But as per the agreement, these new tenants won’t start paying rent until the first quarter of 2025, and even then, they will only pay half of the contractual agreement by the end of next year. They will gradually ramp things up until they reach the total amount in fourth-quarter 2026.
This is a win for MPT: It gets rid of its troubled tenant and replaces it with four new ones (more diversification), which (unless financial problems also arise with them) will pay regular and predictable amounts until at least 2042 on average. However, MPT still has work to do in fixing its business. It has yet to find solutions for some of Steward’s former facilities, including some hospitals under construction.
Even if it had, given the issues it has faced lately, I’d recommend staying away from the stock, at least for now. Yes, MPT is improving its business, but it’s best to watch how things unfold from the sidelines until it can prove that it is officially back by delivering consistently good results.
Should you invest $1,000 in Pfizer right now?
Before you buy stock in Pfizer, consider this:
The Motley Fool Stock Advisor analyst team just identified what they believe are the 10 best stocks for investors to buy now… and Pfizer wasn’t one of them. The 10 stocks that made the cut could produce monster returns in the coming years.
Consider when Nvidia made this list on April 15, 2005… if you invested $1,000 at the time of our recommendation, you’d have $740,704!*
Stock Advisor provides investors with an easy-to-follow blueprint for success, including guidance on building a portfolio, regular updates from analysts, and two new stock picks each month. TheStock Advisorservice has more than quadrupled the return of S&P 500 since 2002*.
Prosper Junior Bakiny has no position in any of the stocks mentioned. The Motley Fool has positions in and recommends Pfizer. The Motley Fool has a disclosure policy.
On CNBC’s “Halftime Report Final Trades,” Josh Brown of Ritholtz Wealth Management said PayPal Holdings, Inc. PYPL continues to make new highs. “I am rolling up my stop-loss, but staying with the trade,” he added.
On Sept. 23, Deutsche Bank analyst Bryan Keane maintained PayPal with a Buy and raised the price target from $74 to $94.
Brian Belski of BMO Capital Markets said Citizens Financial Group, Inc.CFG has a 4% dividend yield and 18% free cash flow yield.
On Sept. 20, Citizens Financial Group announced the appointment of Claude E. Wade to the company’s board of directors, effective March 1, 2025. The company also said Wendy Watson will retire from the board after her current term expires at the annual meeting of shareholders in April 2025.